Evaluating Metrics for Fund Selection
Morningstar vs Lipper vs S&P Capital IQ…
June 2025. Reading Time: 10 Minutes. Author: Nicolas Rabener.
SUMMARY
- The most popular fund selection metrics have no predictive power
- Unsurprisingly, fees matter
- Fund selection is challenging
INTRODUCTION
Fund databases such as Morningstar, FE Fund Info, and Lipper use broadly similar methodologies to rank investment funds. Morningstar’s quantitative Star Rating evaluates funds based on risk-adjusted returns relative to peers over multiple time horizons. Lipper’s Leader Ratings assess funds across five dimensions: total return, consistent return, capital preservation, expenses, and tax efficiency – all benchmarked against peer groups. S&P Capital IQ, meanwhile, uses a model that incorporates performance, volatility, and Sharpe ratios.
While these systems share a common goal – to identify funds likely to outperform or deliver superior risk-adjusted returns on a relative basis – their effectiveness remains an open question.
In this research article, we will analyze and compare the different fund ranking methodologies to assess their predictive value.
EVALUATION OF FUND RANKING METRICS
Most fund databases evaluate performance relative to peer groups rather than benchmark indices – a practice that arguably lowers the performance bar for funds (pun intended). If benchmark indices were used instead, it would likely reveal that a relatively small number of funds consistently outperform, as evidenced by the research from S&P SPIVA. This insight, however, may not align with the commercial interests of firms that sell fund data.
In contrast, our research has no such limitations. We evaluate funds against their benchmark indices, all of which are investable through low-cost ETFs. Our analysis focuses on all U.S.-listed equity mutual funds and ETFs with at least a 10-year performance history. To ensure meaningful comparisons, we only include funds with an R² of at least 0.80 relative to their benchmarks – our benchmark selection achieves an average R² of 0.93. The resulting dataset includes approximately 2,500 funds.
We rank funds using several metrics and select the top and bottom 10% during an in-sample period (2015 – 2019), and then evaluate their behavior in the out-of-sample period (2020 – 2025). The metrics include:
-
Outperformance: Total return relative to the fund’s benchmark index
-
Sharpe Ratio: Return per unit of volatility
-
Outperformance Consistency: Number of years the fund beat its benchmark in the in-sample period
-
Information Ratio: Excess return over the benchmark divided by the tracking error
-
Alpha: The component of excess return not explained by asset class exposures or common equity factors (i.e. manager skill)
-
Fees: Management fees charged by the fund
OUTPERFORMANCE
Many investors rely on a simple strategy: identify funds that have outperformed their benchmarks and assume that this outperformance will persist. However, our earlier research has shown that this kind of performance chasing is an ineffective fund selection method (read Chasing Mutual Fund Performance).
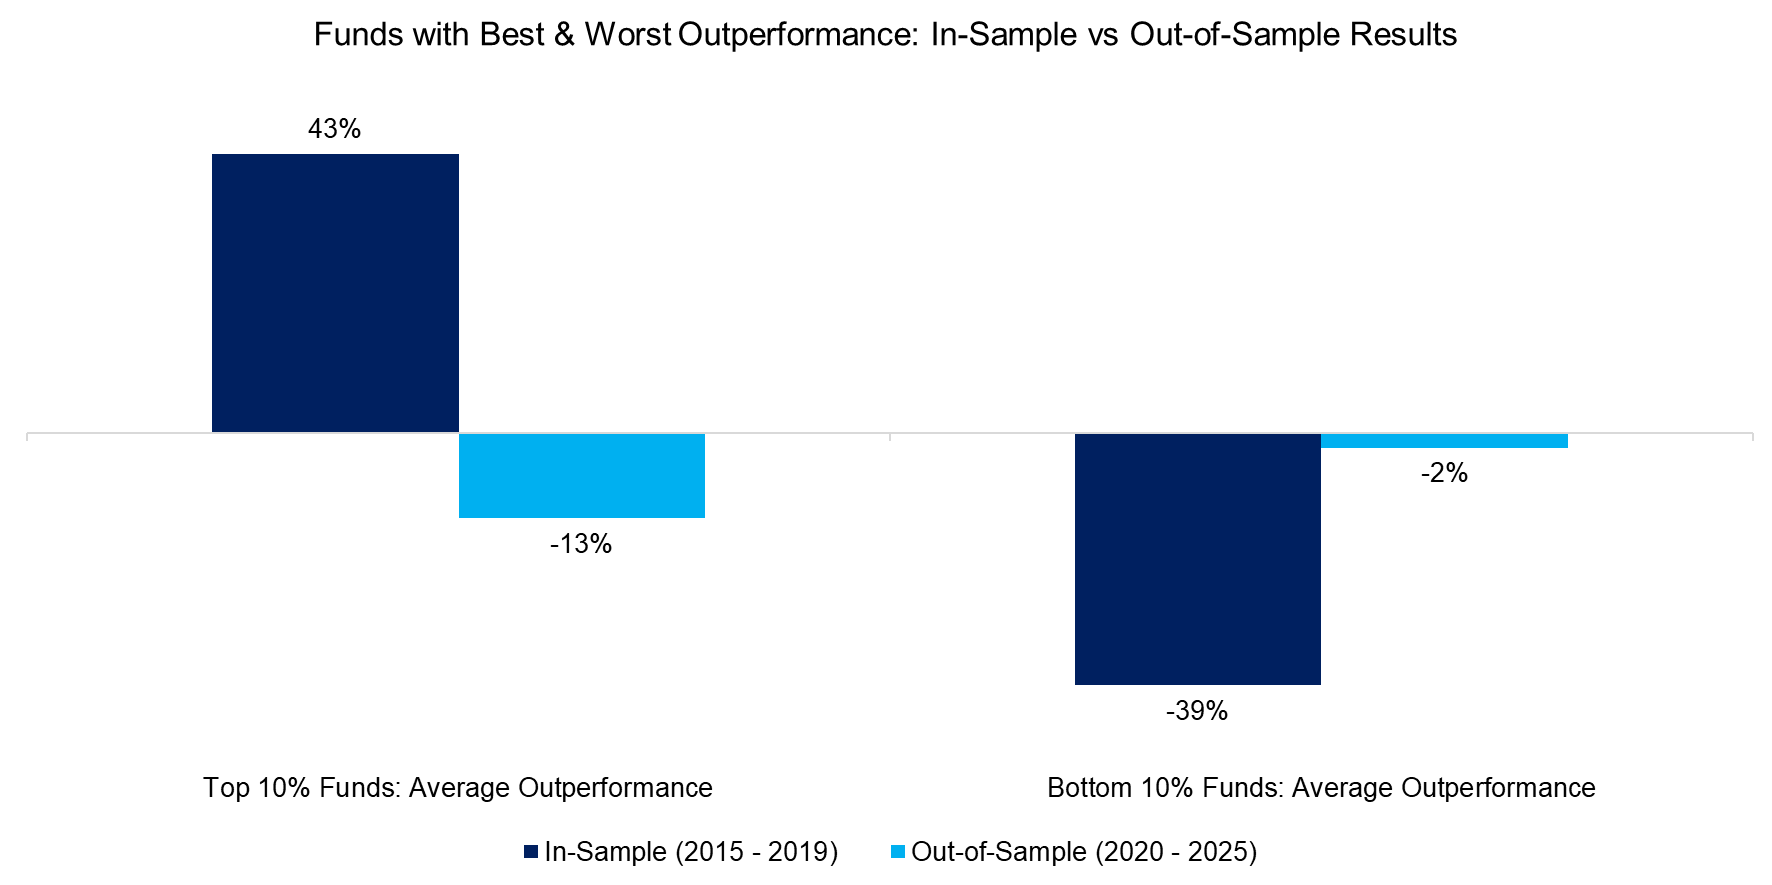
Our current analysis reinforces that conclusion. Using our dataset, we find that the top 10% of funds based on outperformance (43%) during the in-sample period (2015 – 2019) actually underperformed the bottom 10% (-39%) during the out-of-sample period of 2020 – 2025 (-13% versus -2%).
In other words, investors would have fared better by selecting the worst-performing funds from the prior period rather than the best – an approach that, while statistically compelling, is psychologically counterintuitive and difficult to implement in practice.
Source: Finominal
SHARPE RATIOS
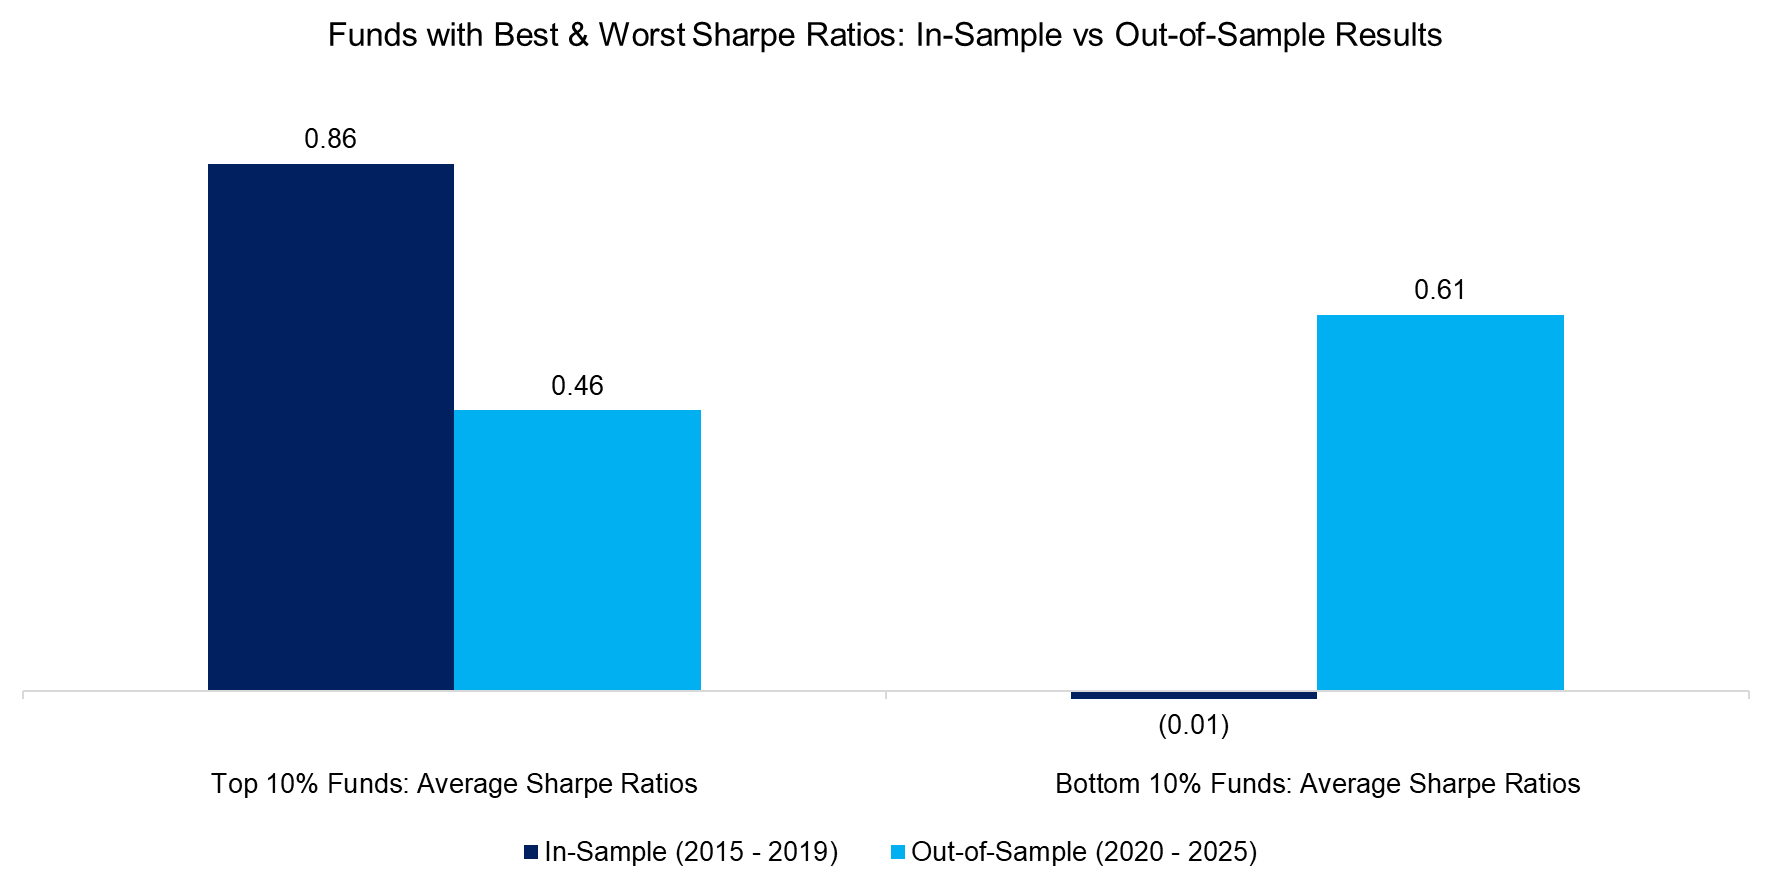
Next, we examine the top and bottom 10% of funds based on their in-sample Sharpe ratios. Somewhat surprisingly, the results show that funds with the highest Sharpe ratios during the in-sample period (average of 0.86) delivered lower out-of-sample Sharpe ratios (average of 0.46) than those with the lowest in-sample Sharpe ratios (average of 0.61).
Source: Finominal
OUTPERFORMANCE CONSISTENCY
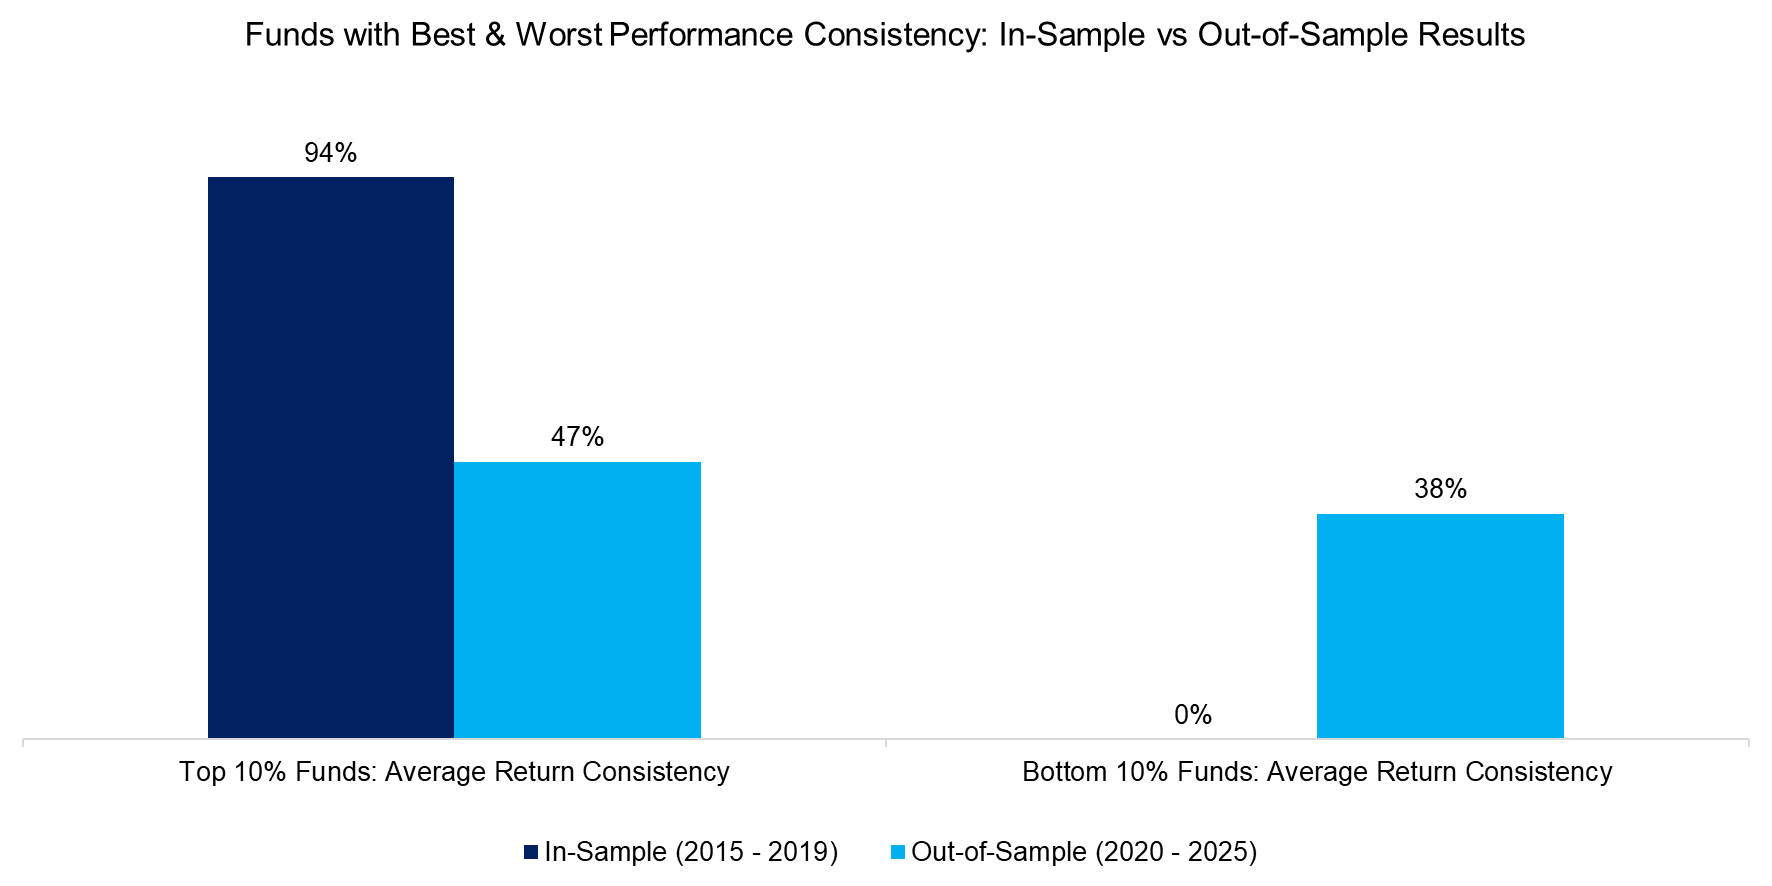
The top 10% of funds ranked by performance consistency outperformed their benchmarks in 94% of the years during the in-sample period (2015 – 2019). However, this consistency dropped sharply to just 47% in the out-of-sample period. Conversely, the bottom 10% – funds that failed to beat their benchmarks in any year in-sample – managed to do so 38% of the time thereafter.
Source: Finominal
ALPHA
Ultimately, successful fund selection hinges on identifying managers who deliver true value beyond broad asset class or equity factor exposures. To isolate this, we conduct a regression analysis using standard asset classes (equities, bonds, commodities, currencies) and common equity factors (value, momentum, size, quality, and low volatility) to estimate each fund’s alpha during the in-sample period.
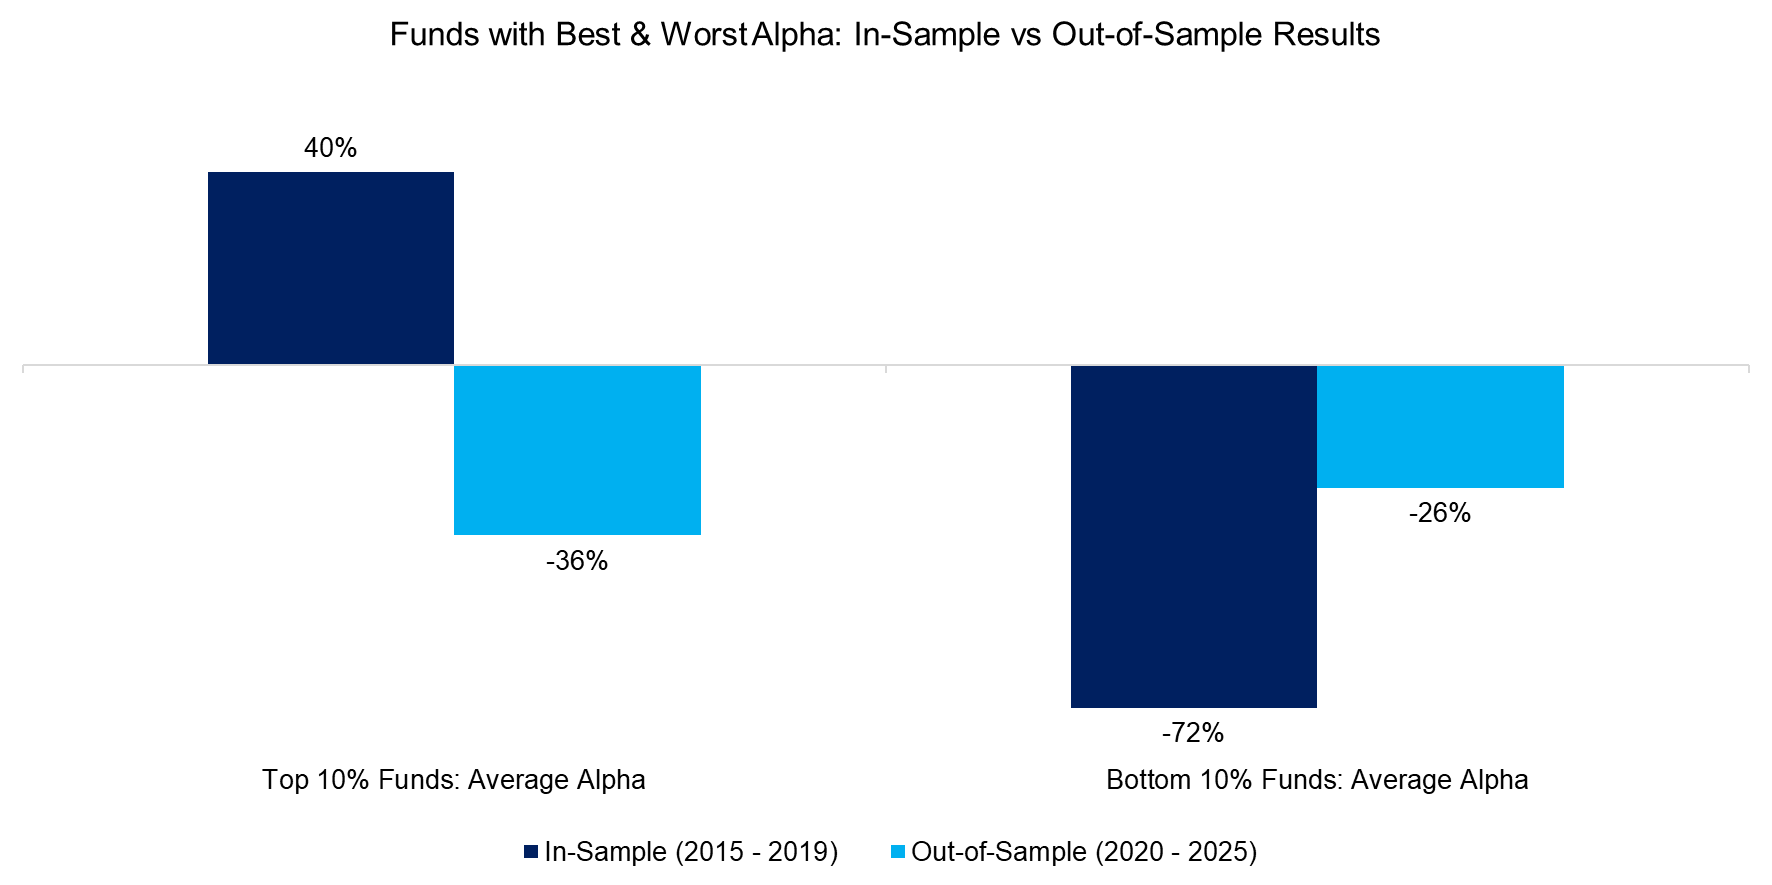
The results are striking. Funds with the highest average alpha in-sample (+40%) went on to deliver negative alpha out-of-sample (-36%). In fact, they underperformed even the funds with the lowest in-sample alpha, which posted a smaller negative alpha of -26% out-of-sample.
Source: Finominal
INFORMATION RATIO
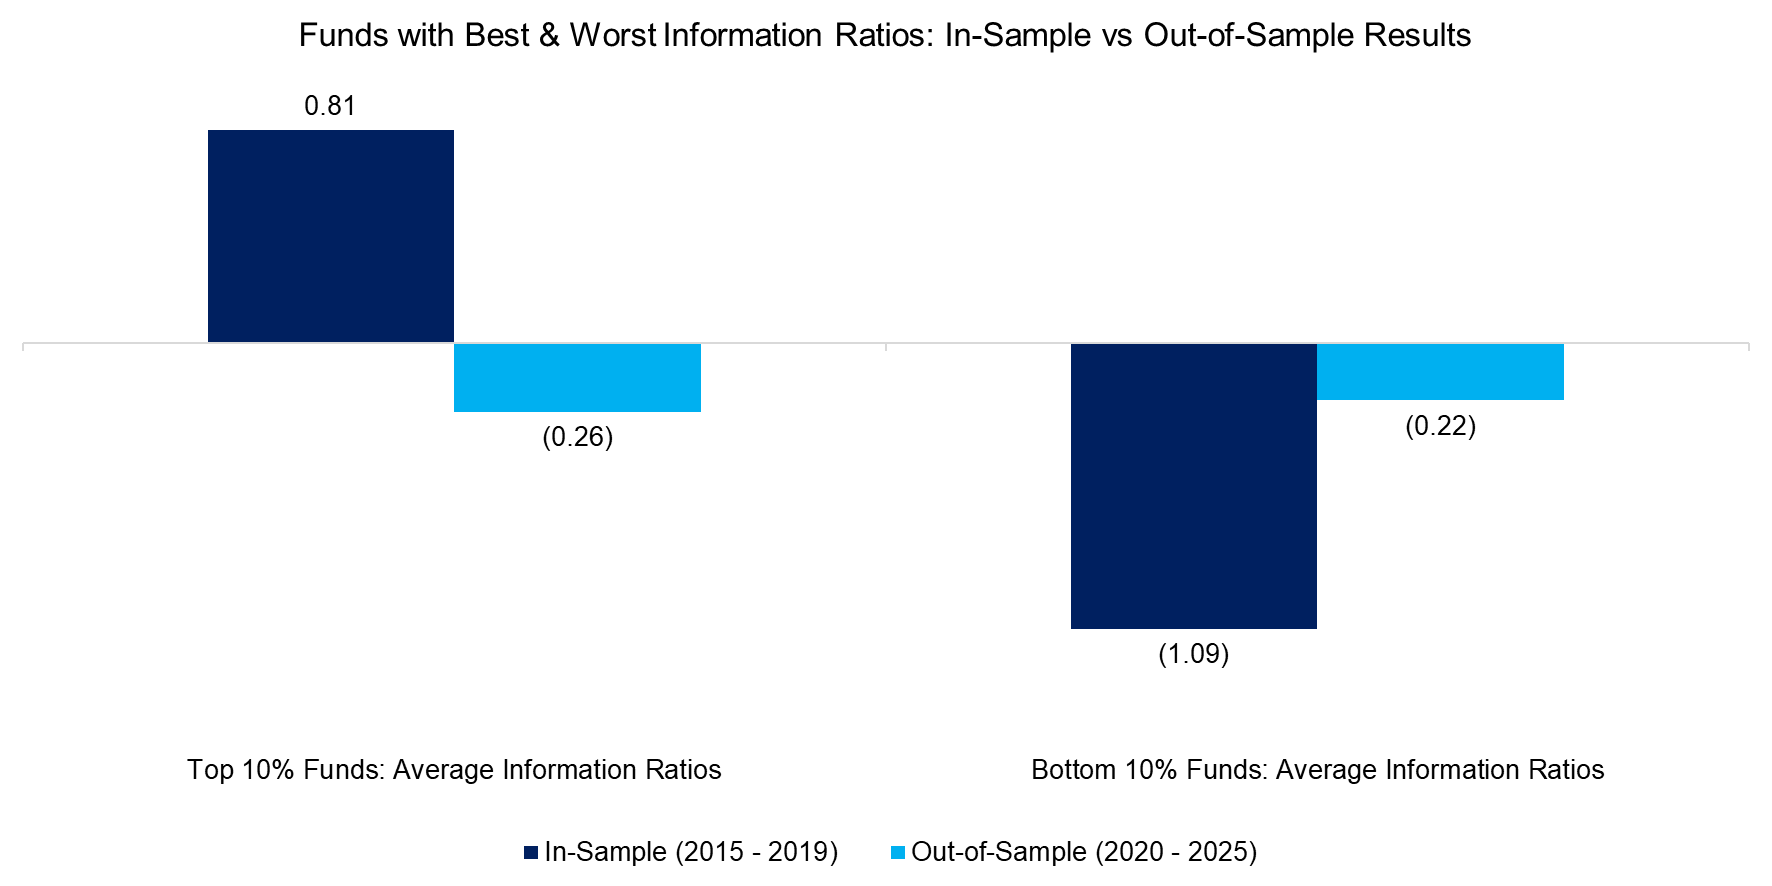
The Information Ratio offers an elegant way to assess how efficiently a fund has delivered outperformance relative to its active risk. However, the results reveal a disconnect between past and future performance: funds with the highest in-sample Information Ratios (0.81) went on to post negative out-of-sample ratios (-0.26), slightly worse than those with the lowest in-sample ratios, which averaged -0.22 out-of-sample.
Source: Finominal
FEES
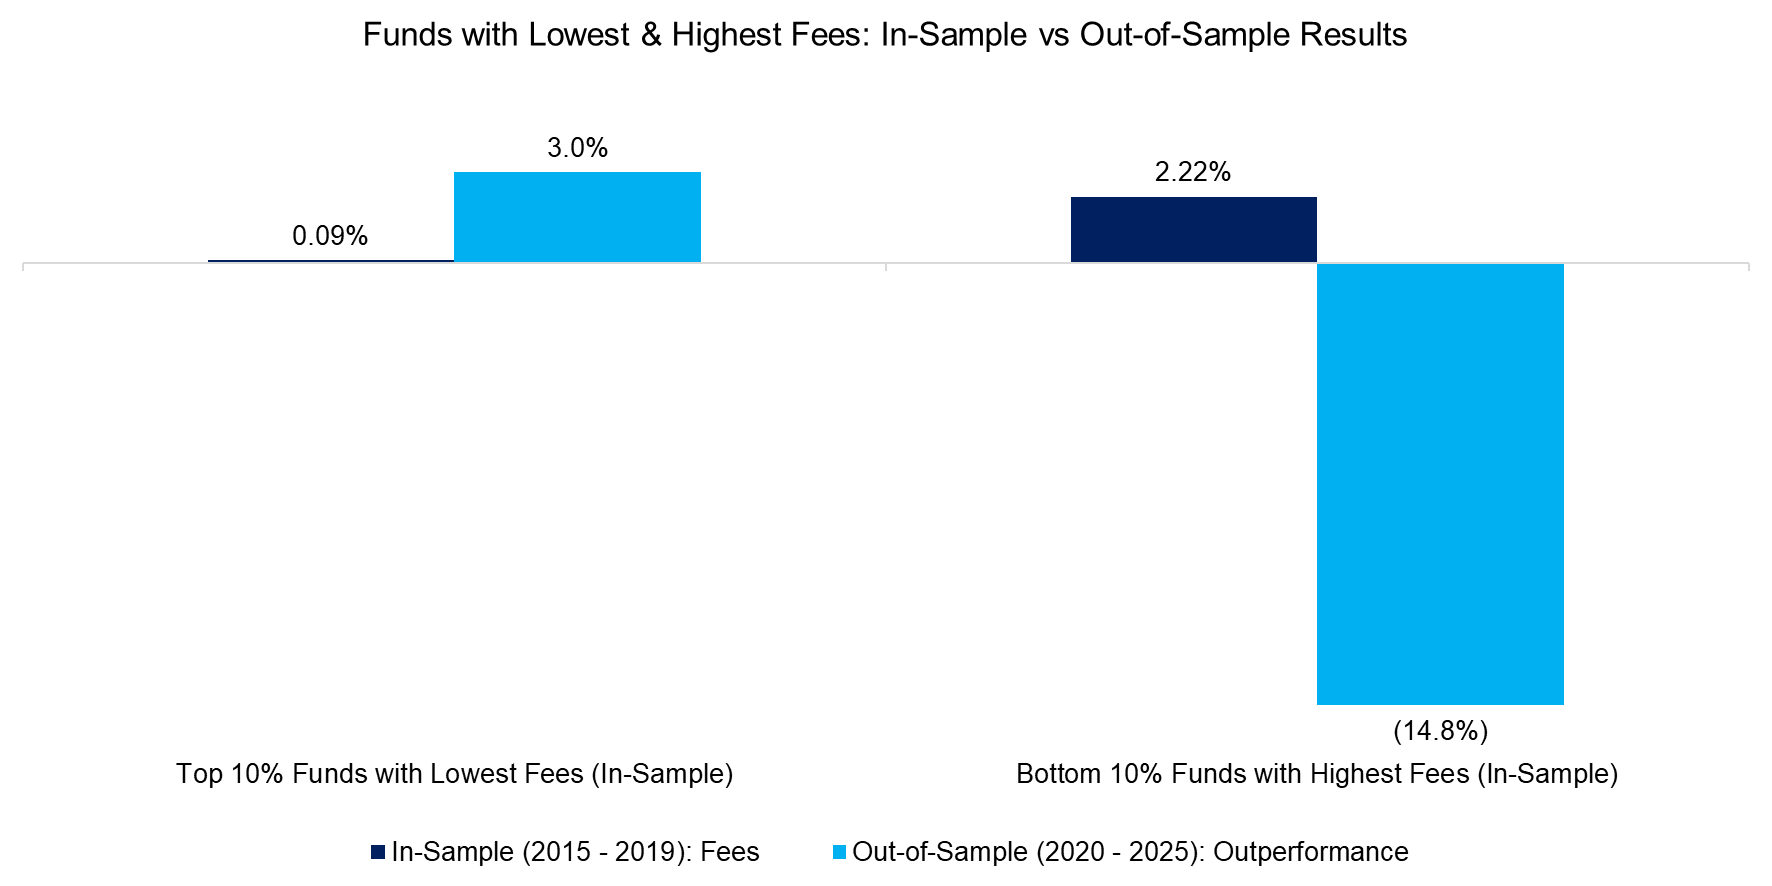
Finally, we assess the out-of-sample performance of the top and bottom 10% of funds based on fees. The results are clear: low-fee funds delivered positive outperformance of +3.0%, while high-fee funds lagged significantly, with negative outperformance of -14.8% (read Top Fee Generating, Wealth Creating and Destroying ETFs).
Source: Finominal
METRIC COMPARISON
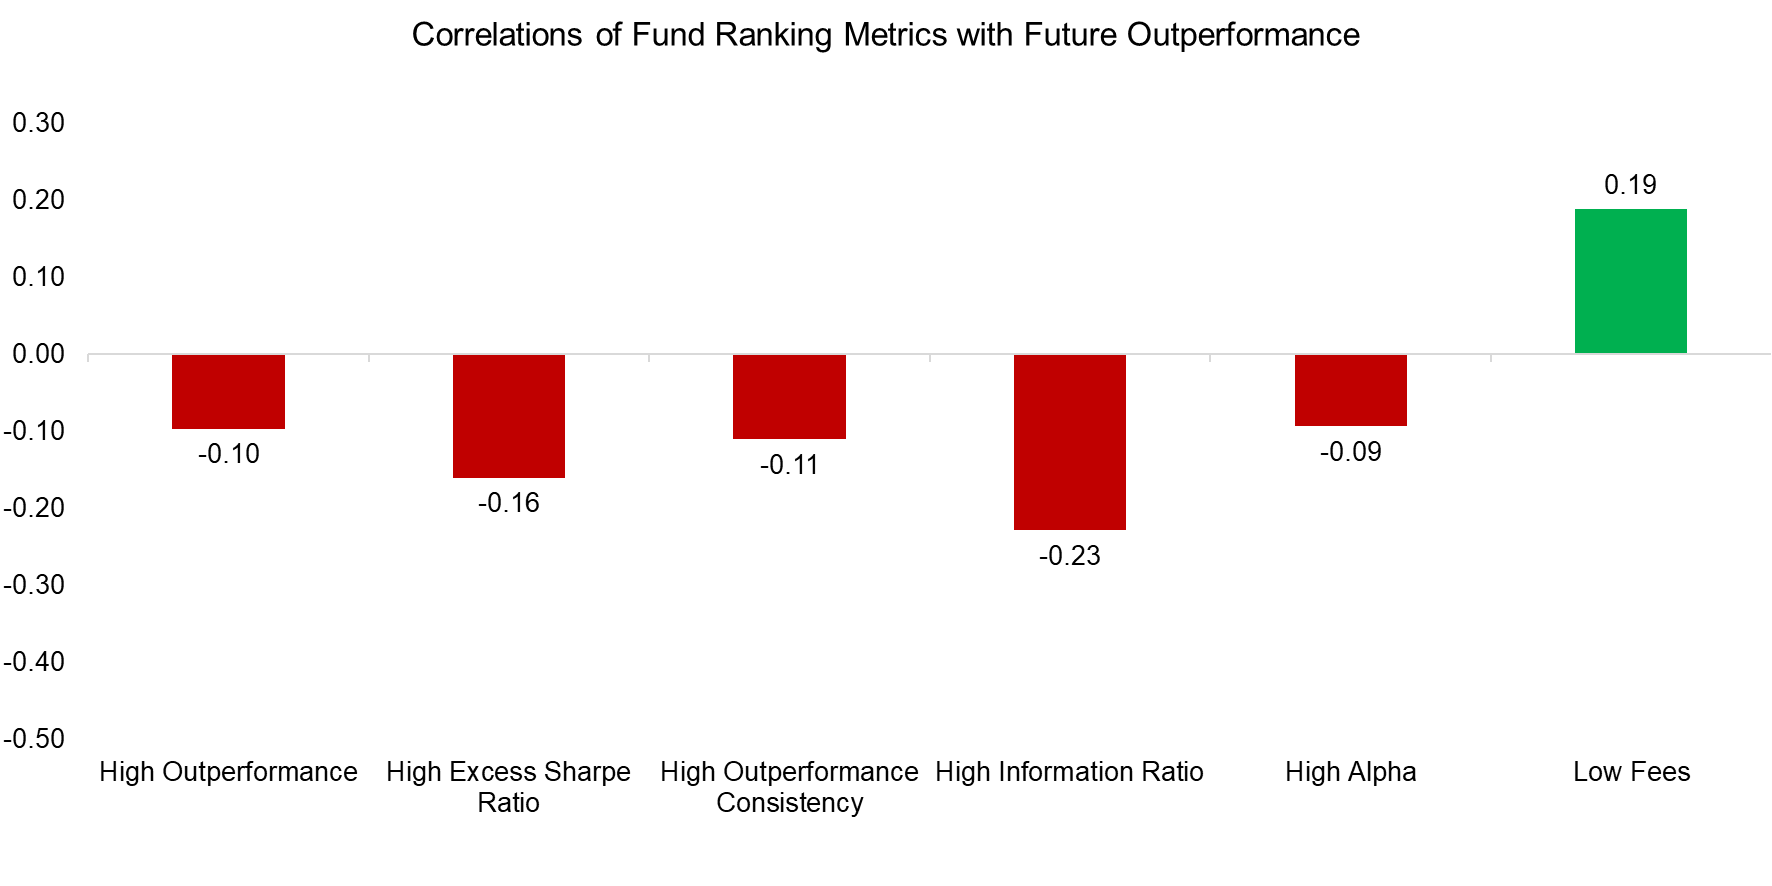
We calculate the correlations between in-sample metrics and future outperformance. The results show slightly negative correlations across all metrics – except for fees, which exhibit a modest positive correlation.
Source: Finominal
FURTHER THOUGHTS
This analysis suggests that the most commonly used metrics for fund selection are not only ineffective, but in many cases, produce inverse results – meaning investors might be better off choosing funds that score poorly on these measures.
Are fund database providers like Morningstar aware of this? In fact, yes. Some have published their own evaluations and reached similar conclusions about the limitations of their methodologies. That said, our analysis considered each metric in isolation; it’s possible that combining them could enhance predictive power. Additionally, some providers have introduced qualitative fund assessments – likely in response to such critiques – though there is little evidence to suggest these are significantly more effective at forecasting future performance.
Since all these metrics use returns as an input, this simply reinforces that investors are better off betting on mean reversion than chasing performance.
RELATED RESEARCH
Chasing Mutual Fund Performance
Measuring Performance Chasing
The Fallacy of Betting on the Best Stock Market
Thematic versus Momentum Investing
An Anatomy of Thematic Investing
Thematic Investing: Thematically Wrong?
Stock Selection versus Asset Allocation
The Juggernaut Index
Top Fee Generating, Wealth Creating and Destroying ETFs
ABOUT THE AUTHOR
Nicolas Rabener is the CEO & Founder of Finominal, which empowers professional investors with data, technology, and research insights to improve their investment outcomes. Previously he created Jackdaw Capital, an award-winning quantitative hedge fund. Before that Nicolas worked at GIC and Citigroup in London and New York. Nicolas holds a Master of Finance from HHL Leipzig Graduate School of Management, is a CAIA charter holder, and enjoys endurance sports (Ironman & 100km Ultramarathon).
Connect with me on LinkedIn or X.

