Exploring Defined Outcome ETFs
Structured products in an ETF wrapper – a recipe for disaster?
November 2020. Reading Time: 10 Minutes. Author: Ben McMillan & Nicolas Rabener.
SUMMARY
- Defined outcome ETFs have quickly gathered almost $5 billion in assets
- Not unexpected given their much lower drawdowns when the market crashed in March 2020
- However, they are complex and expensive products and there are viable alternatives
INTRODUCTION
If ETFs had an arch enemy, then it probably would not be mutual funds, but rather structured products. ETFs symbolize simplicity, transparency, liquidity, and low fees. In stark contrast, structured products are generally complex, opaque, difficult to trade, and expensive.
A classic structured product is a note that allows investors to participate in the stock market with defined downside but limited upside (therefore earning the “defined outcome” moniker). The same payoff profile could be constructed via a zero-coupon bond and an option. Retail investors, in particular, like these strategies as they seem to provide attractive risk-reward scenarios with so-called “defined outcomes”. Banks and brokerages like selling these products to retail investors as the fees are lucrative. On the face of it, structured products are not always expensive, some are even free, but the cost disclosure typically does not include the fees from the trading desk that creates and manages these over time.
There has been very little discussion in the media about structured products in comparison to stocks, mutual funds, or ETFs, but structured products represent a huge market with approximately $7 trillion invested globally (which is actually slightly more than the global ETF market). Given that there are more than 7,000 ETFs covering almost every imaginable index, sector, or theme, issuers have (not surprisingly) turned to importing ideas from the structured product market to the ETF world.
In this short research note, we will explore defined outcome ETFs, which represent structured products in an ETF wrapper that are rapidly becoming popular with investors.
DEFINING THE DEFINED OUTCOME ETF MARKET
A defined outcome ETF is a product that provides exposure to a stock index (like the S&P 500) and offers a reduced downside in exchange for limited upside, i.e. a roughly defined outcome for return expectations (read Option-Based Strategies: Opt In or Opt Out?).
For example, one of the most popular products in this space offers a cap of 8.5% and a buffer of 15%. This means investors participate in the upward movement of the stock market up to a limit of 8.5%. Above that, investors get no further returns. However, if the index crashes, then the investor is protected for the first 15% of negative returns. If stocks crash more than that, then investors start losing money as well. The index levels are set when the product is launched, which explains why the product names often include the month of issuance and are reset on an annual basis.
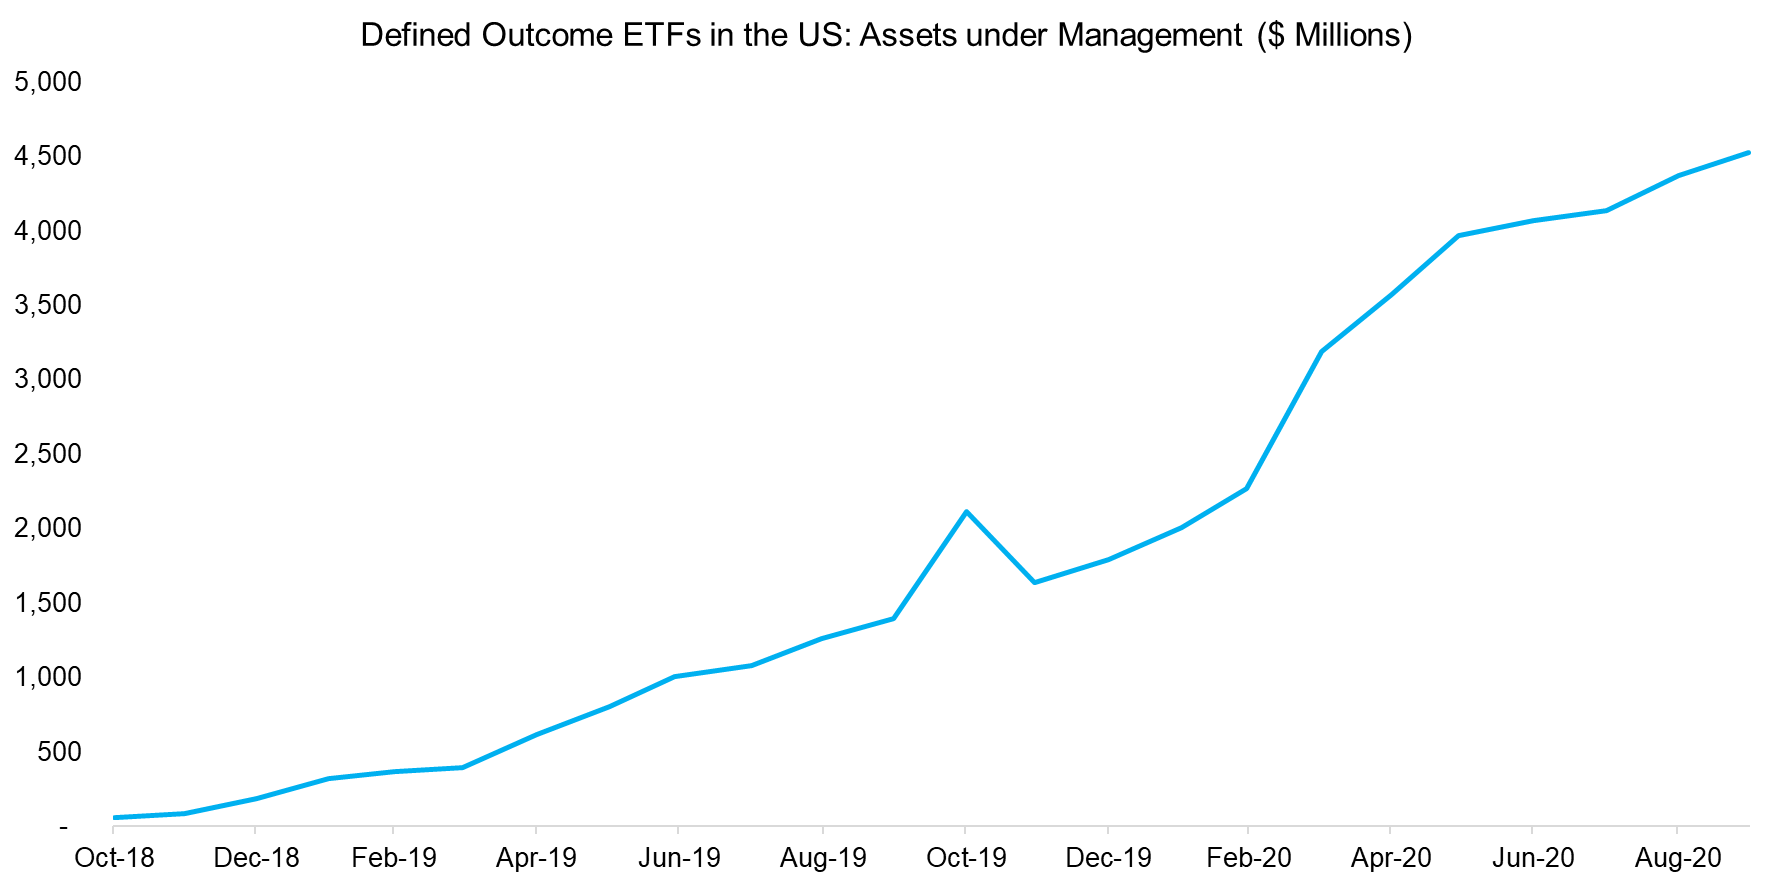
We focus on defined outcome ETFs in the US, which is a relatively new market. Two companies, First Trust / CBOE Vest and Innovator Capital Management, dominate this market and have collectively launched over 50 ETFs. In less than two years, investors have allocated almost $5 billion to these products and inflows have been highly consistent over time.
Source: IDX, FactorResearch
PERFORMANCE OF DEFINED OUTCOME ETFS IN 2020
The inflows into these ETFs have accelerated in 2020 as the global pandemic and market volatility has shifted investors’ focus to capital protection. The crisis also offers an opportunity for investors to scrutinize if the products performed as advertised in marketing materials.
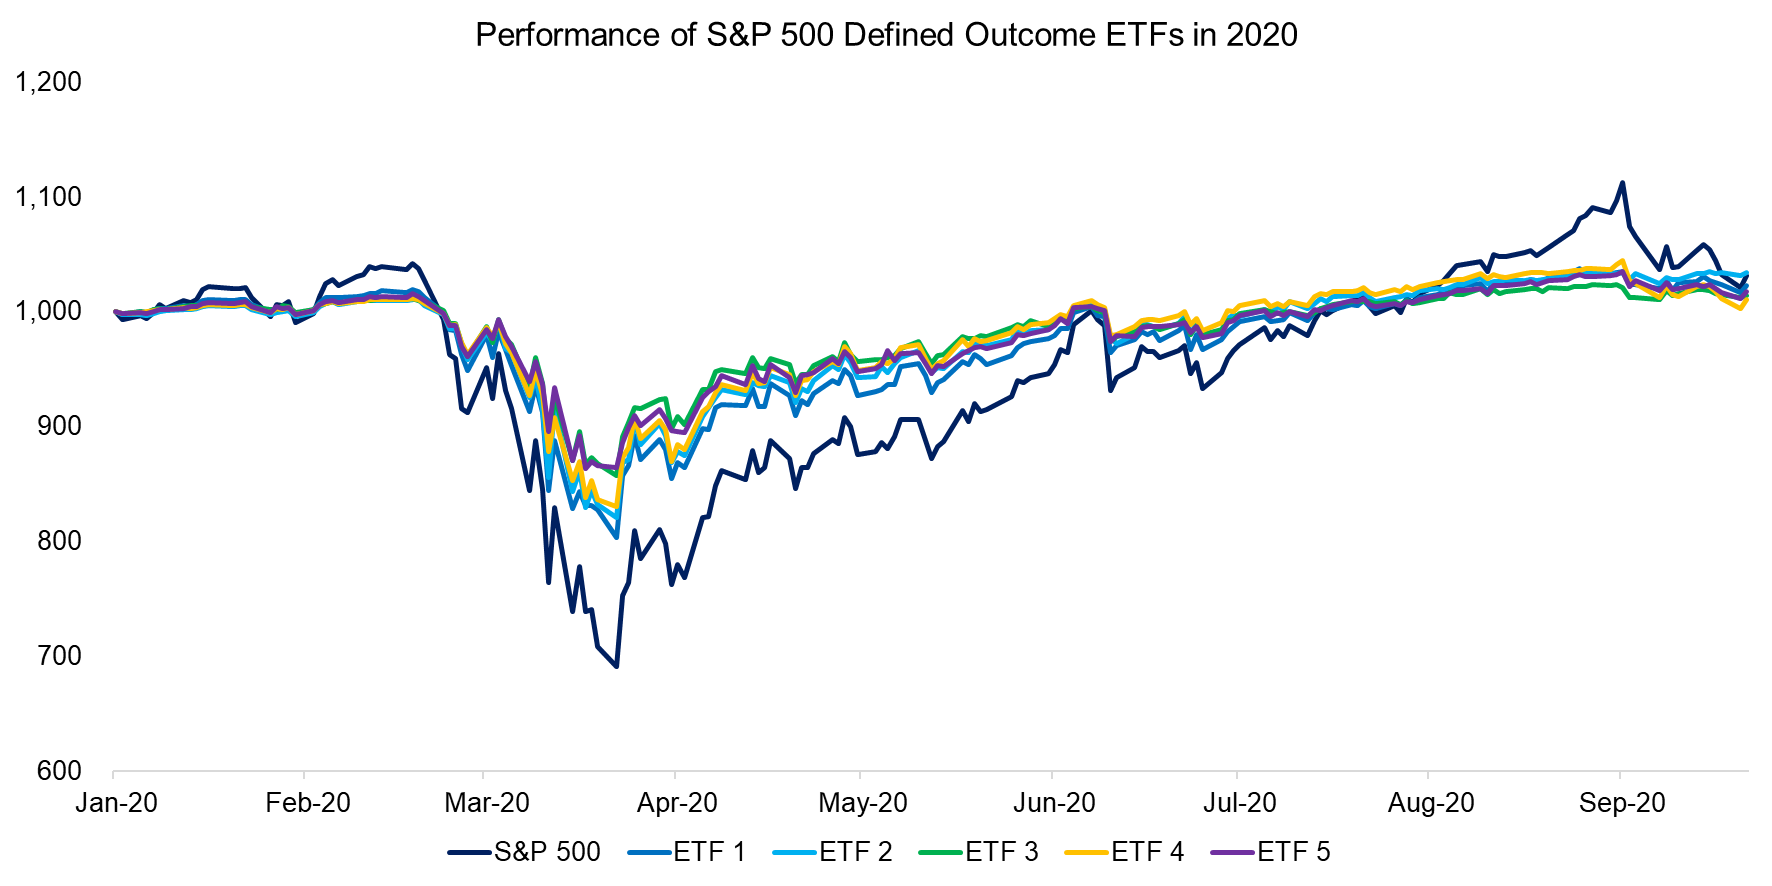
We highlight the performance of five defined outcome ETFs tracking the S&P 500, which cumulatively manages more than $1 billion in assets. We observe that these lost significantly less than the S&P 500 in March 2020 (when the S&P 500 reached its maximum drawdown), however, the ETFs also stopped participating in the recovery rally in August as they reached their cap. This is important because it highlights the trade-off between the buffered downside and upside characteristics which is a key consideration in all defined outcome ETFs.
Source: IDX, FactorResearch
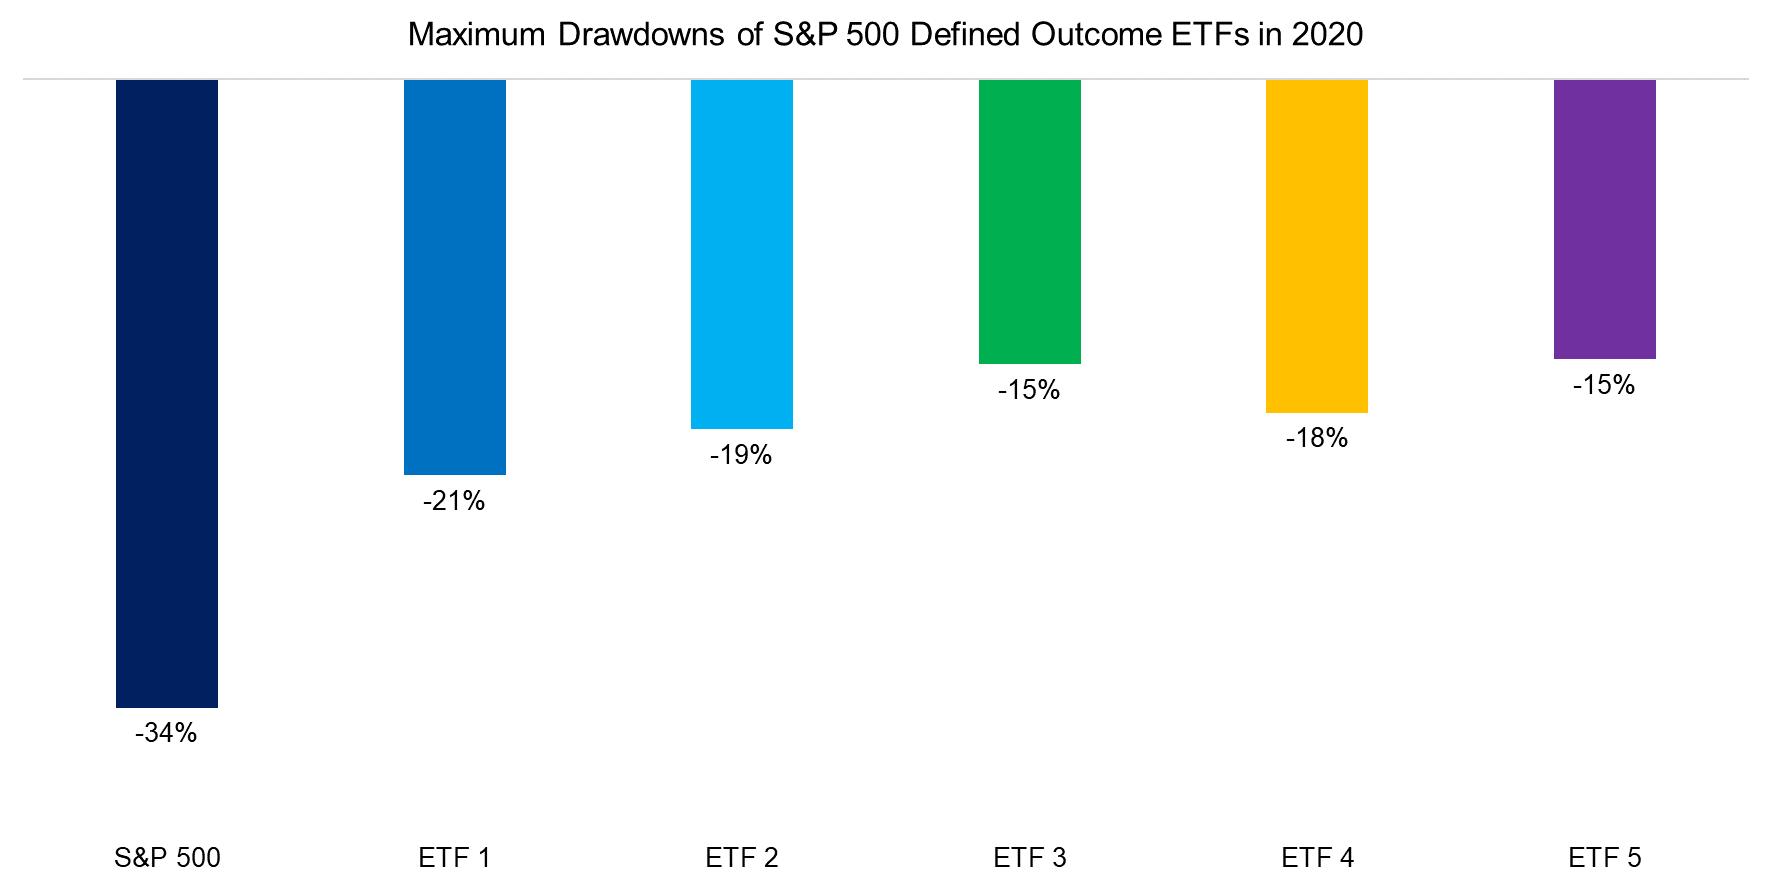
Overall, the year-to-date performance of the five defined outcome ETFs in 2020 was as expected with relatively little differentiation between the products (which can be viewed as a positive attribute). The maximum drawdowns reached during the depths of the COVID-19 crisis ranged from 15% to 21%, which is significantly less than the 34% decrease in the S&P 500.
The drawdowns vary as the ETFs have different buffers and dates for resetting the index levels. This is an underappreciated feature of these products that Investors need to be very aware of, as these dates have a significant impact on returns depending on when the investment is actually made. For example, if an investor would have bought a newly launched defined outcome ETF in March 2020, then the cap would have been reached relatively quickly thereby significantly limiting the investor’s exposure to the subsequent rally.
The sensitivity on the index resetting date also explains why some fund-of-funds products are currently being launched that allocate equally to ETFs for each of the different months, which essentially reduces the path dependency.
Source: IDX, FactorResearch
THE DOWNSIDE OF DEFINED OUTCOMES
In addition to the dependency on the index resetting date, investors also should be aware that defined outcome ETFs are based on price-only indices, i.e. they are not entitled to the dividends from the underlying stocks. The current dividend yield of the S&P 500 is “only” 1.75%, which may not seem much, but in a low-yielding environment, every basis point counts. Sacrificing this dividend yield can end up being a non-trivial “cost” to defined outcome ETFs over time.
Furthermore, defined outcome ETFs, like structured products, are expensive. Almost all of the products are charging management fees between 0.75% and 0.85% per annum, compared to almost zero costs for plain-vanilla ETFs for the S&P 500. Now, downside protection isn’t free, of course, but it’s worth understanding just what the true cost (both explicit and implicit) is.
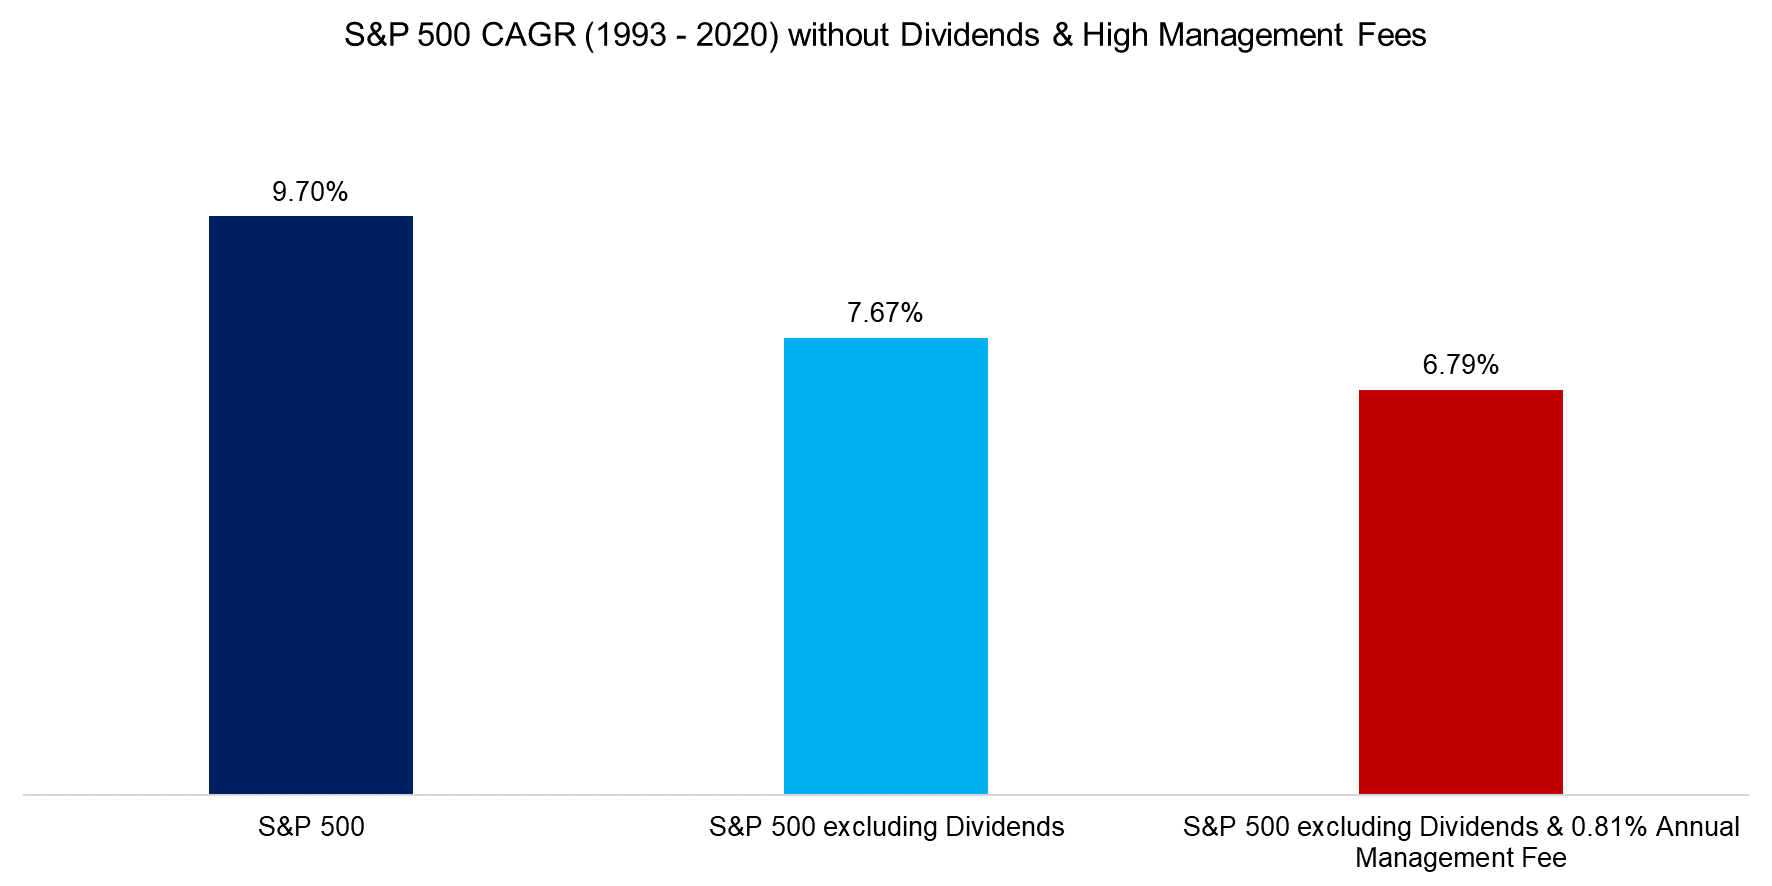
We take a closer look at both the explicit cost of management fees as well as the implicit cost of excluding dividends as it relates to the S&P 500. In this case, the annual return would have decreased from 9.70% to 6.79% per annum for the period between 1993 and 2020. This is probably quite a bit more than many investors realize.
Source: IDX, FactorResearch
ALTERNATIVES TO DEFINED OUTCOME ETFS
Investors’ interest in products that focus on capital protection is comprehensible given the global pandemic as well as the potential for elevated volatility going forward. While Institutional investors had traditionally allocated to hedge funds, the realization has set in that high fees, lack of transparency (and liquidity), and little to no alpha generation make these largely unattractive (read Tail Risk Hedge Funds).
However, investors can also consider low volatility or other option-based products (like put-write strategies) as an alternative to defined outcome ETFs. Both of these are available as ETFs but are 50% cheaper in terms of management fees and less complex (as there are no resetting dates, caps, or buffers).
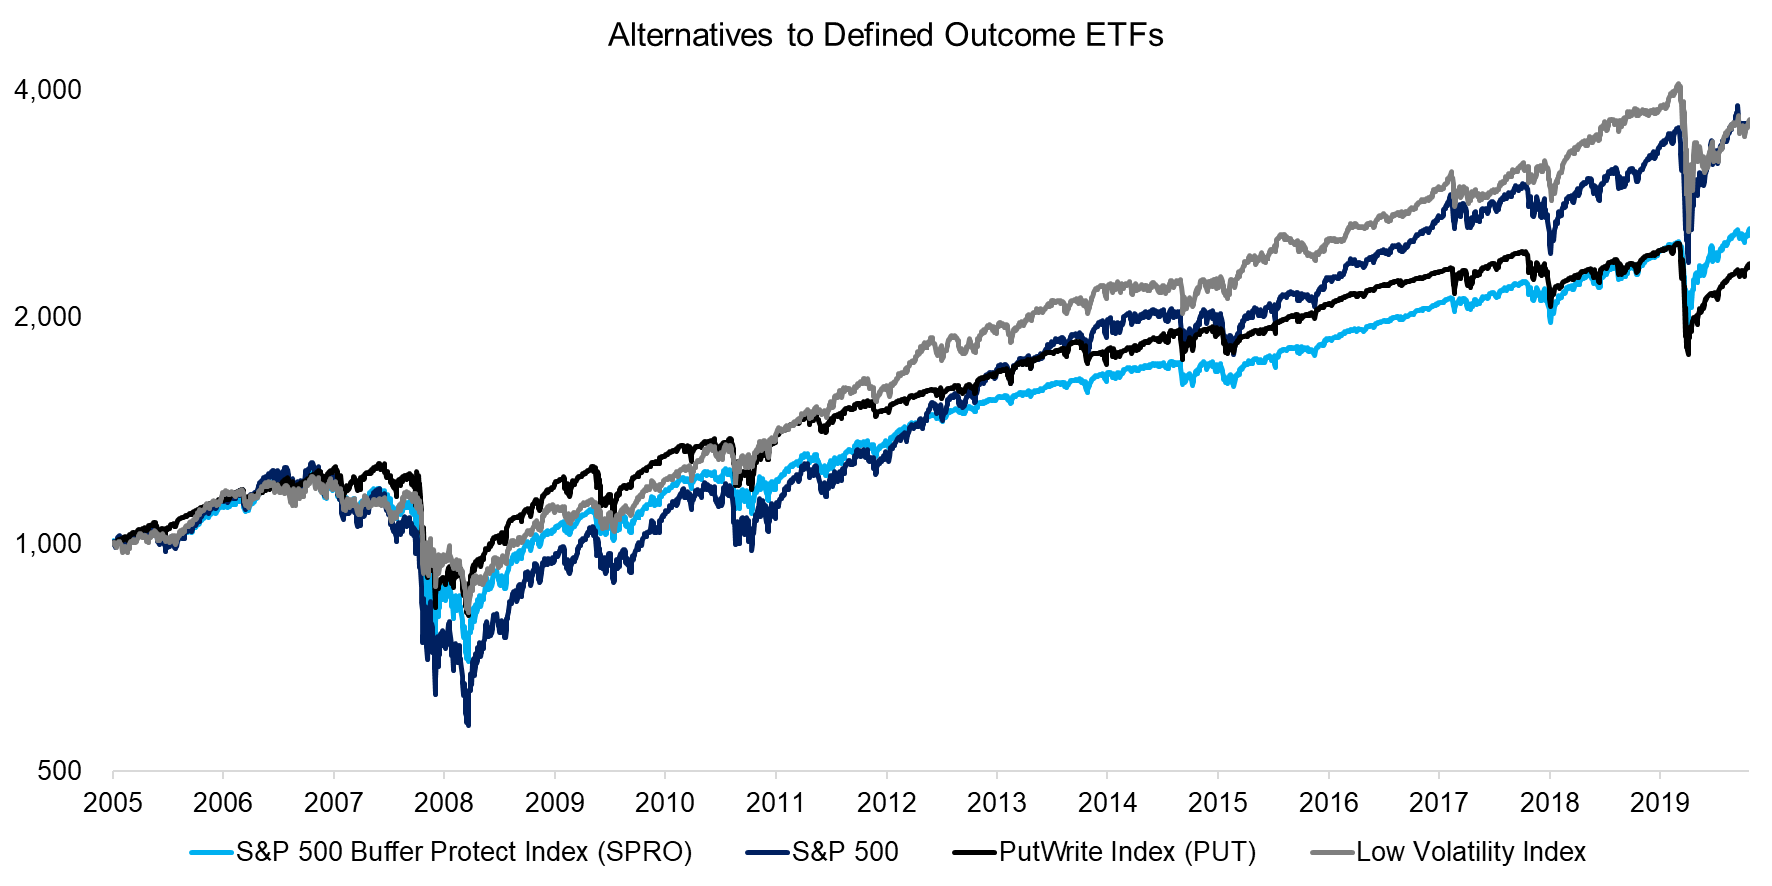
Given that most of the defined outcome ETFs in the US have only been launched recently, there are no long-term track records of realized returns available for analysis. However, the CBOE calculates the S&P 500 Buffer Protect Index (SPRO), which is the index used in some of the products and offers backtested data since 2005. The index allocates equally to 12 sub-indices, one for each month, that have a buffer of 10% and a cap.
We observe that, since 2005, the S&P 500 has generated significantly higher returns than the SPRO index, which highlights the long-term impact of a capped upside in a strong bull market. The low volatility index, by contrast, generated similar returns to the market while the put-write index had returns more comparable to SPRO. However, and more importantly, both the low-volatility and put-write indices offered similar reductions in maximum drawdowns historically relative to the SPRO Index and therefore could be considered as similarly effective but simpler alternatives to defined outcome ETFs.
Source: CBOE, IDX, FactorResearch
FURTHER THOUGHTS
Some of the departed fathers and mothers of ETFs might turn in their graves when learning about structured products in the ETF wrapper as this notion represents the very antithesis of simply holding the stock market in a low-cost, transparent, and liquid product. Defined outcome ETFs are complex and expensive products and, given the capped upside, probably not suitable for buy-and-hold investors with a long-term horizon.
However, in contrast to structured products, defined outcome ETFs are traded on a regulated exchange, which requires more stringent disclosure on fees and methodology as well as regular reporting. From this perspective, many (or most) investors will find them preferable to traditional structured products and, as a result, we would expect to continue to see a significant amount of new launches in this space. The ETF issuers are keenly aware of the $7 trillion invested in structured products and how successfully ETFs have grabbed market share from mutual funds. The first defined outcome ETFs for fixed income has already been launched.
RELATED RESEARCH
Bank Risk Premia Indices: Unbankable?
Defensive & Diversifying Strategies: What Worked in 2020?
ABOUT THE AUTHORS
Ben McMillan is the Principal and CIO of IDX. He was a founder and former portfolio manager at RQSI, where he launched the RQSI Small Cap Hedged Equity Mutual fund. Prior to that, he served as co-portfolio manager of the Van Eck Long/Short Equity Index mutual fund and developed the Lyster Watson Long/Short Equity Replication strategy. Ben holds an MS in Econometrics from the London School of Economics, and an MA and BA in Economics from Boston University.
Connect with me on LinkedIn.
Nicolas Rabener is the Founder of Finominal, which empowers investors with data and technology to analyze and improve their portfolios. Previously he created Jackdaw Capital, an award-winning quantitative hedge fund. Before that Nicolas worked at GIC and Citigroup in London and New York. Nicolas holds a Master of Finance from HHL Leipzig Graduate School of Management, is a CAIA charter holder, and enjoys endurance sports (100km Ultramarathon).
