Factor Allocation 101: Equal vs Volatility-Weighted
Simplicity Beats Complexity
September 2017. Reading Time: 10 Minutes. Author: Nicolas Rabener.
SUMMARY
- Equal-weight and volatility-weighted allocations are two common factor allocation frameworks
- Risk-return ratios are not higher with volatility-weighted allocations
- Different reasons can explain the superiority of equal-weight allocations
INTRODUCTION
In July we published a research report “Factors & Volatility-Based Risk Management” were we analysed Value, Size and Momentum based on Fama-French data and concluded that higher factor volatility is not necessarily negative for the risk-return ratios of factors. We decided to have another look and enhance the analysis by adding more factors and adopting a constant volatility target (aka risk parity model). In this short research note we will analyse the differences between equal-weight and volatility-weighted multi-factor portfolios in the US, Europe and Japan.
METHODOLOGY
We’re going to focus on six factors: Value, Size, Momentum, Low Volatility, Growth and Quality in the US, Europe, and Japan. The factors are constructed as beta-neutral long-short portfolios by taking the top and bottom 10% of the stock universes. Only companies with a minimum market capitalization of $1bn are considered and 10bps of transaction costs are included. The multi-factor portfolios are rebalanced annually.
The volatility-weighted portfolio targets a constant volatility of 14% in the US and Europe and 16% in Japan for each factor. The volatility targets are based on matching the volatility profiles of both multi-factor portfolios. The volatility-weighting, which implies that a factor can get allocations of more or less than 100% of capital, is conducted quarterly and incurs a transaction cost of 10bps. We ignore financing costs that would be charged from levering up factors below the target volatility, which means that the volatility-weighted performance is slightly overstated.
EQUAL VS VOLATILITY-WEIGHTED ALLOCATIONS: PERFORMANCE
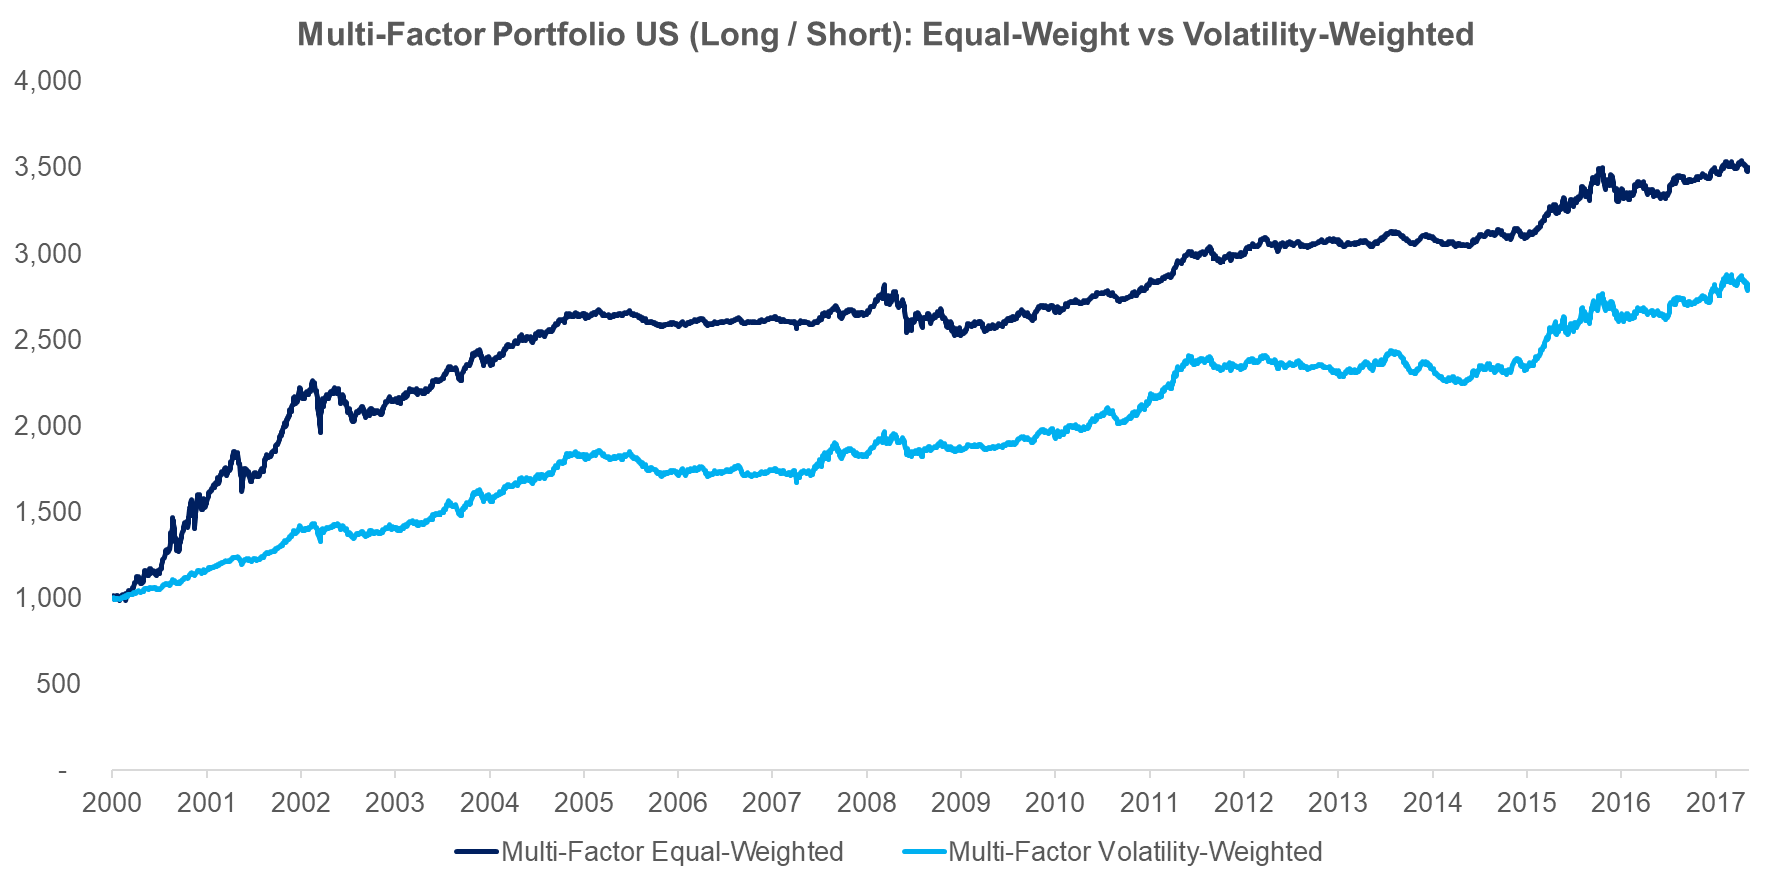
The chart below shows the performance of the equal-weight and volatility-weighted multi-factor portfolios for the US from 2000 to 2017. We can observe that the equal-weight portfolio significantly outperforms the volatility-weighted portfolio. The shapes of the curves are similar, which is to be expected given that they combine the same factors. If we would look at the individual factors we would see that the volatility-weighted performance is only clearly better for the Momentum factor as it avoids the Momentum crash of 2009.
Source: FactorResearch
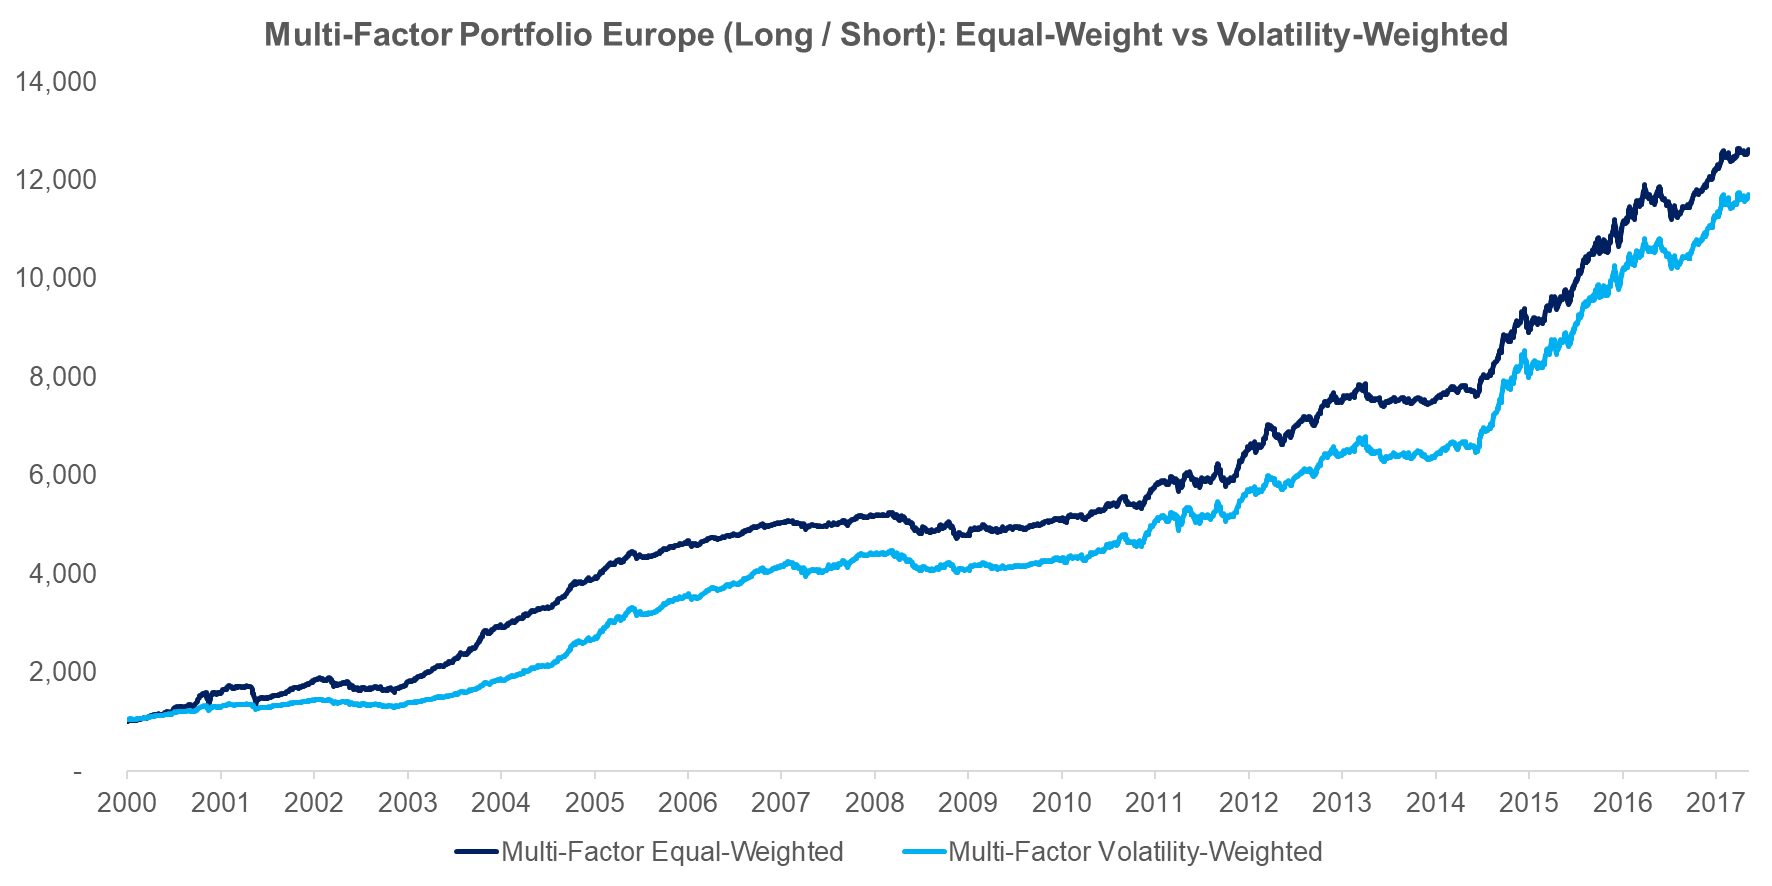
The next chart shows the performance of the two multi-factor portfolios in Europe and we can see that volatility-weighted portfolio also underperforms the equal-weight portfolio.
Source: FactorResearch
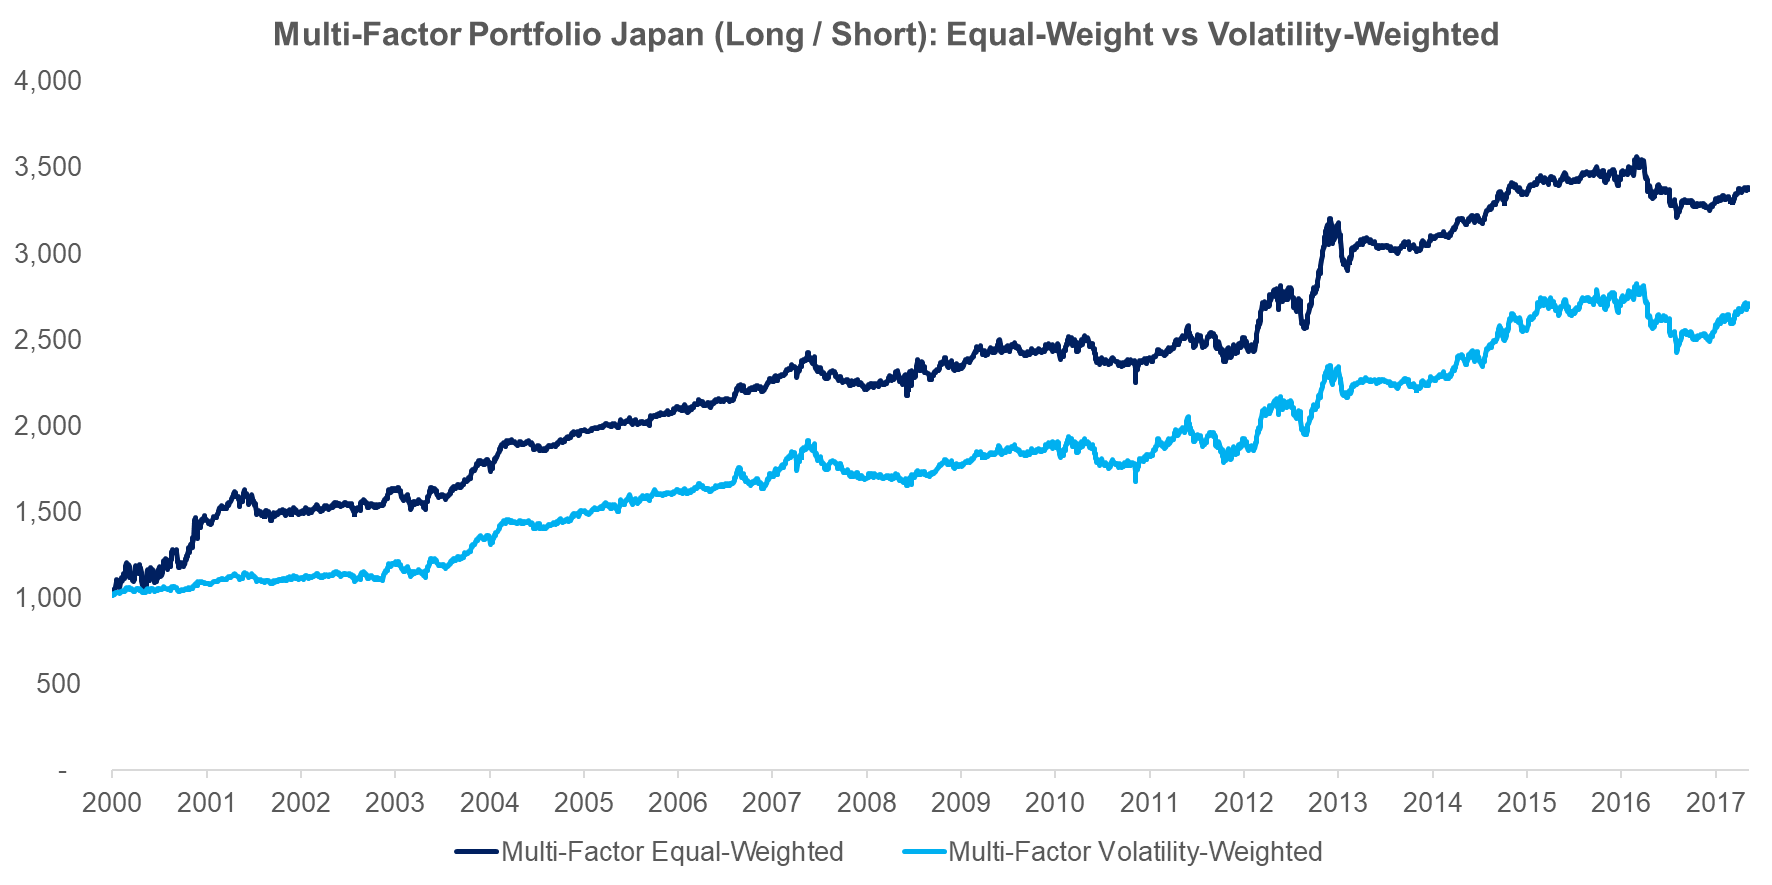
The last comparison shows the two portfolios in Japan, where again we can observe a significant outperformance of equal-weight multi-factor portfolio (read Equity Factors In Japan).
Source: FactorResearch
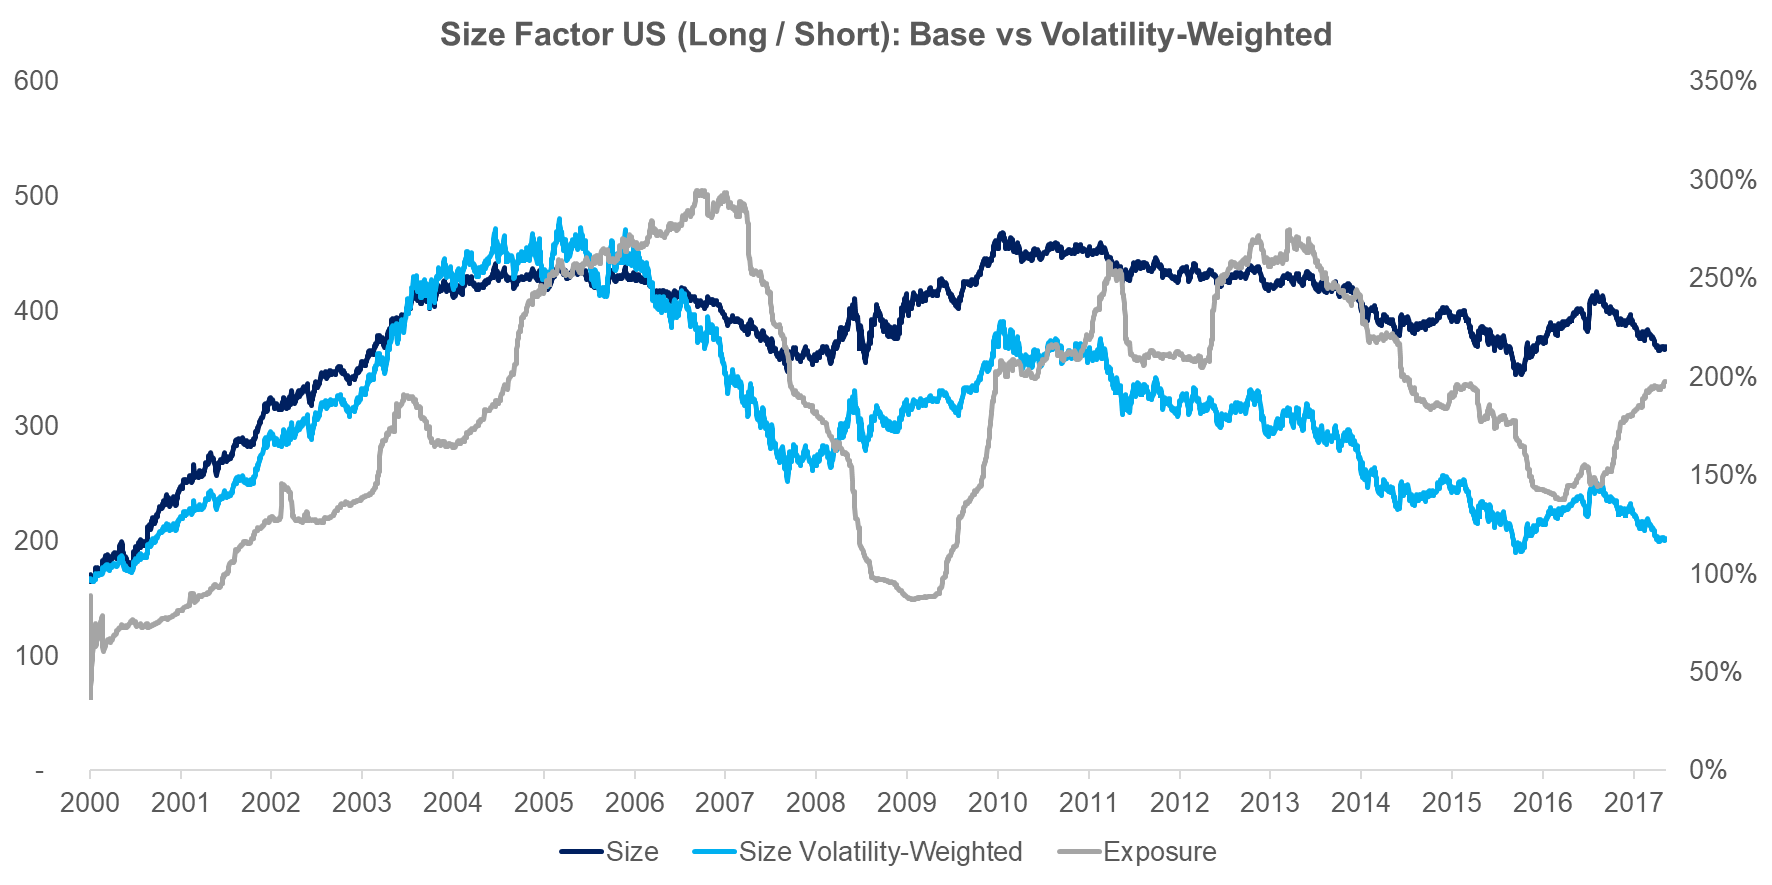
It’s somewhat perplexing that the volatility-weighted portfolios show such meaningful underperformance as this approach is very common with investors. So far we looked at the performance on portfolio level and we can also analyse the effect of volatility-weighting on single factor level. The chart below shows the Size factor (long / short) in the US, where we can observe the factor in two versions: unadjusted and volatility-weighted. The Size factor had an average volatility of 8.7% from 2000 to 2017, so leverage is required to achieve the 14% volatility target. Most of the underperformance stems from 2006 were the factor volatility was very low, which means the volatility-weighting would have levered the factor exposure significantly. However, this was just when the factor started a slow, but steady decline, so that the losses were magnified and much larger than for the unadjusted Size factor.
Source: FactorResearch
EQUAL VS VOLATILITY-WEIGHTED ALLOCATIONS: RISK METRICS
Investors tend to use volatility-weighting allocation frameworks for improving risk-return ratios and decreasing drawdowns, not necessarily for increasing the performance. The chart below shows the risk-return ratios for the three regions and does not show an improvement compared to the equal-weight portfolios.
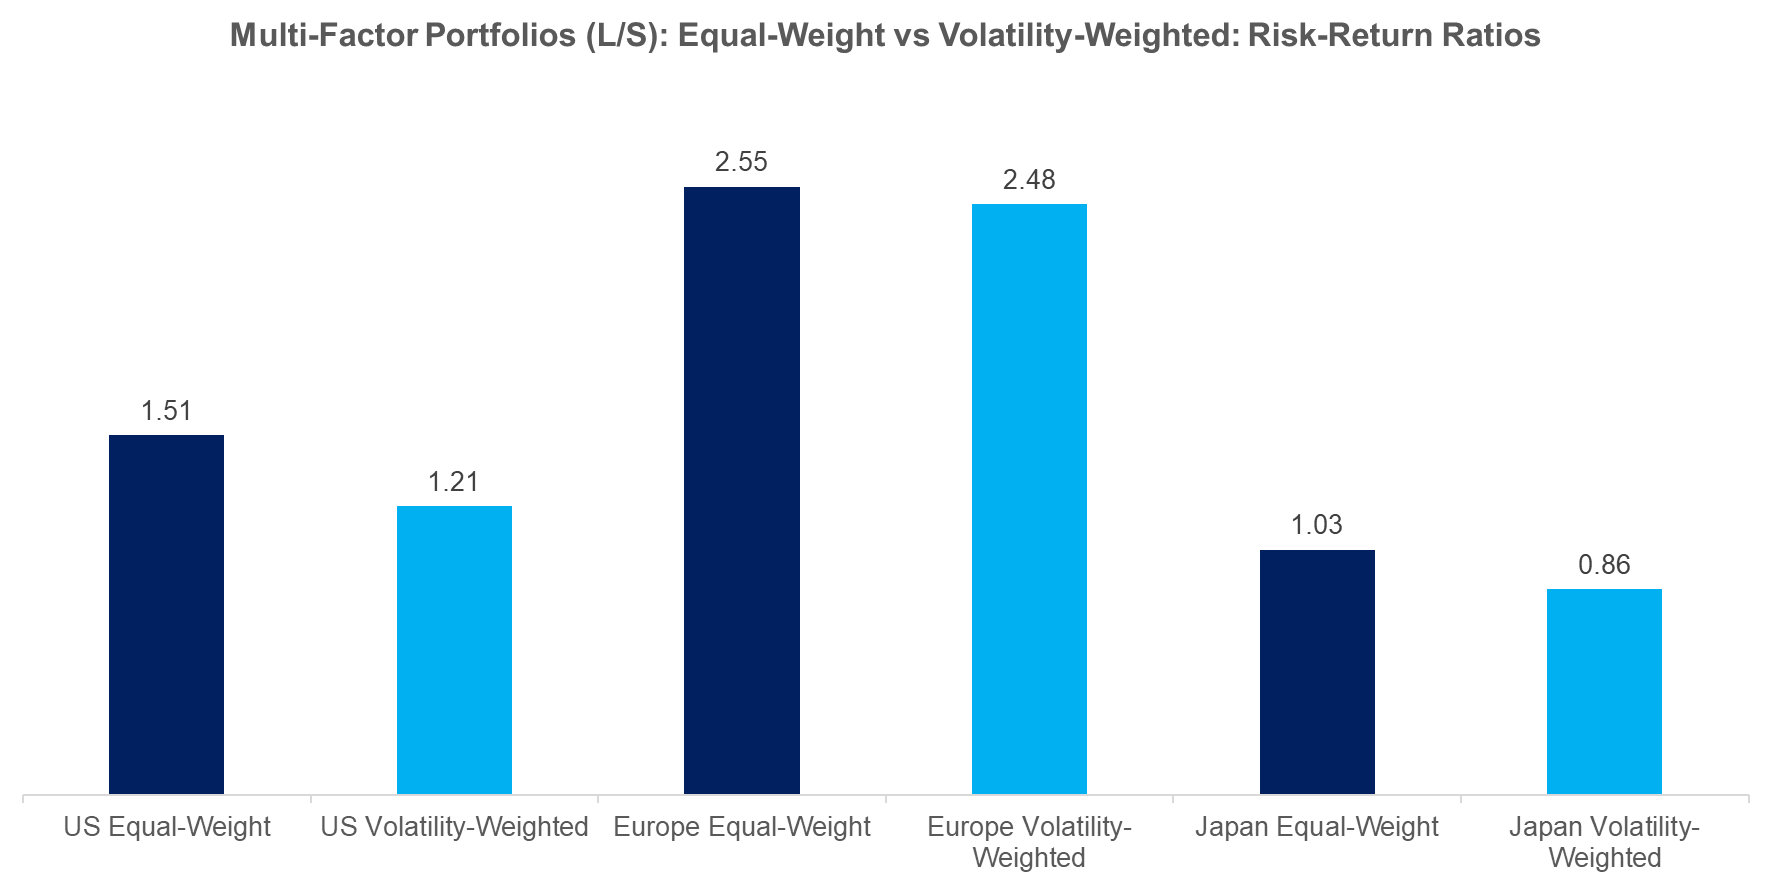
Source: FactorResearch
In addition to analysing the risk-return ratios it’s also interesting to study the drawdowns, which are shown below. These do improve in the US and Europe for the volatility-weighted multi-factor portfolios, but not in Japan, which is an ambiguous result.
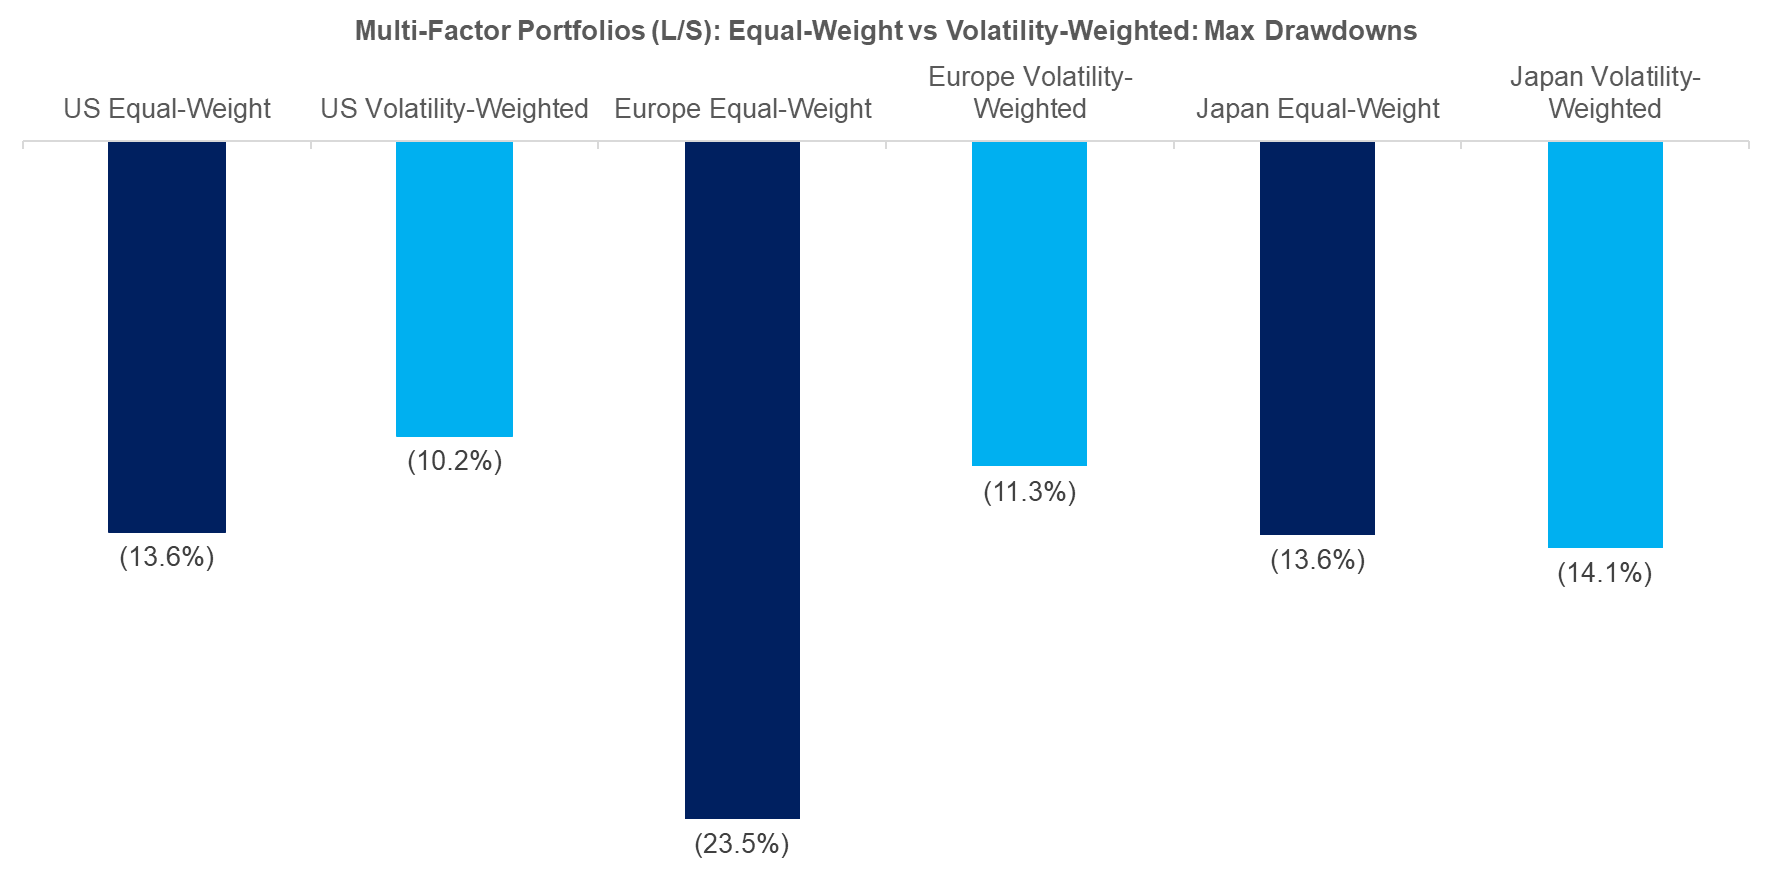
Source: FactorResearch
Given the abundance of risk parity products and supporting research it’s surprising that the volatility-weighting allocation framework does not improve risk-return ratios and reduce drawdowns for a multi-factor portfolio compared to an equal-weight portfolio. We believe there are multiple reasons that may explain this:
- The relationship between historical and future volatility is weak
- Higher factor volatility does not imply lower risk-return ratios for factors
- Higher transaction costs as the portfolio is rebalanced more frequently
FURTHER THOUGHTS
This short note highlights that a volatility-weighted allocation framework is not superior to an equal-weighting for a multi-factor portfolio from a performance or risk perspective. The beauty of the equal weighting is the simplicity and low portfolio maintenance. The analysis could be enhanced by considering the correlations of the factors, i.e. running a mean-variance optimisation, although that would not likely change the conclusion of this analysis.
ABOUT THE AUTHOR
Nicolas Rabener is the CEO & Founder of Finominal, which empowers professional investors with data, technology, and research insights to improve their investment outcomes. Previously he created Jackdaw Capital, an award-winning quantitative hedge fund. Before that Nicolas worked at GIC and Citigroup in London and New York. Nicolas holds a Master of Finance from HHL Leipzig Graduate School of Management, is a CAIA charter holder, and enjoys endurance sports (Ironman & 100km Ultramarathon).
Connect with me on LinkedIn or X.

