Factor Construction: Beta vs $-Neutrality
Is Beta Driving Factor Performance?
June 2017. Reading Time: 10 Minutes. Author: Nicolas Rabener.
SUMMARY
- Factors constructed $-neutral didn’t benefit much from beta-exposure from 2000 to 2017
- Beta-neutrality is only a must for Low Volatility
- However, beta-neutral factors offer lower correlation to long-only indices
INTRODUCTION
Calculating factor performance is, unfortunately, as much art as science as numerous assumptions need to be made. Amongst these are the definitions of the stock universe, the portfolio size, the factor, the ranking methodology, the rebalancing period, the transaction costs, etc. All of these decisions have a significant impact on the factor performance and there are no clearly established industry standards. One of the finer points is how the long and short portfolios should be constructed, where the choice is between $-neutral and beta-neutral. Pondering about this brings up the question how much factor performance is driven by beta, if they are constructed $-neutral like the well-known Fama-French factors. In this short note we’re going to analyse the difference in factor performance between $-neutral and beta-neutral portfolios.
METHODOLOGY
The factors used in the analysis are Value, Size, Momentum, Low Volatility, Quality and Growth. Factor data is available for all developed markets. Portfolios select the top and bottom 10% of the stock universes in the US, Europe, and Japan compared to 20% for the UK, Australia, Hong Kong and Singapore given smaller stock universes.
The $-neutral portfolios are model-free as the long portfolios receive the same allocation in $-terms as short portfolios, e.g. $100 each. For the avoidance of doubt, $ simply refers to a unit of currency and not to the US$. Beta-neutral portfolios are constructed by increasing the weights of stocks which have a one-year beta to the local index of below 1 and decreasing the weights of stocks with a beta above 1, i.e. as a result the long and short portfolios will both have a beta of 1.
VALUE FACTOR (2000 – 2017)
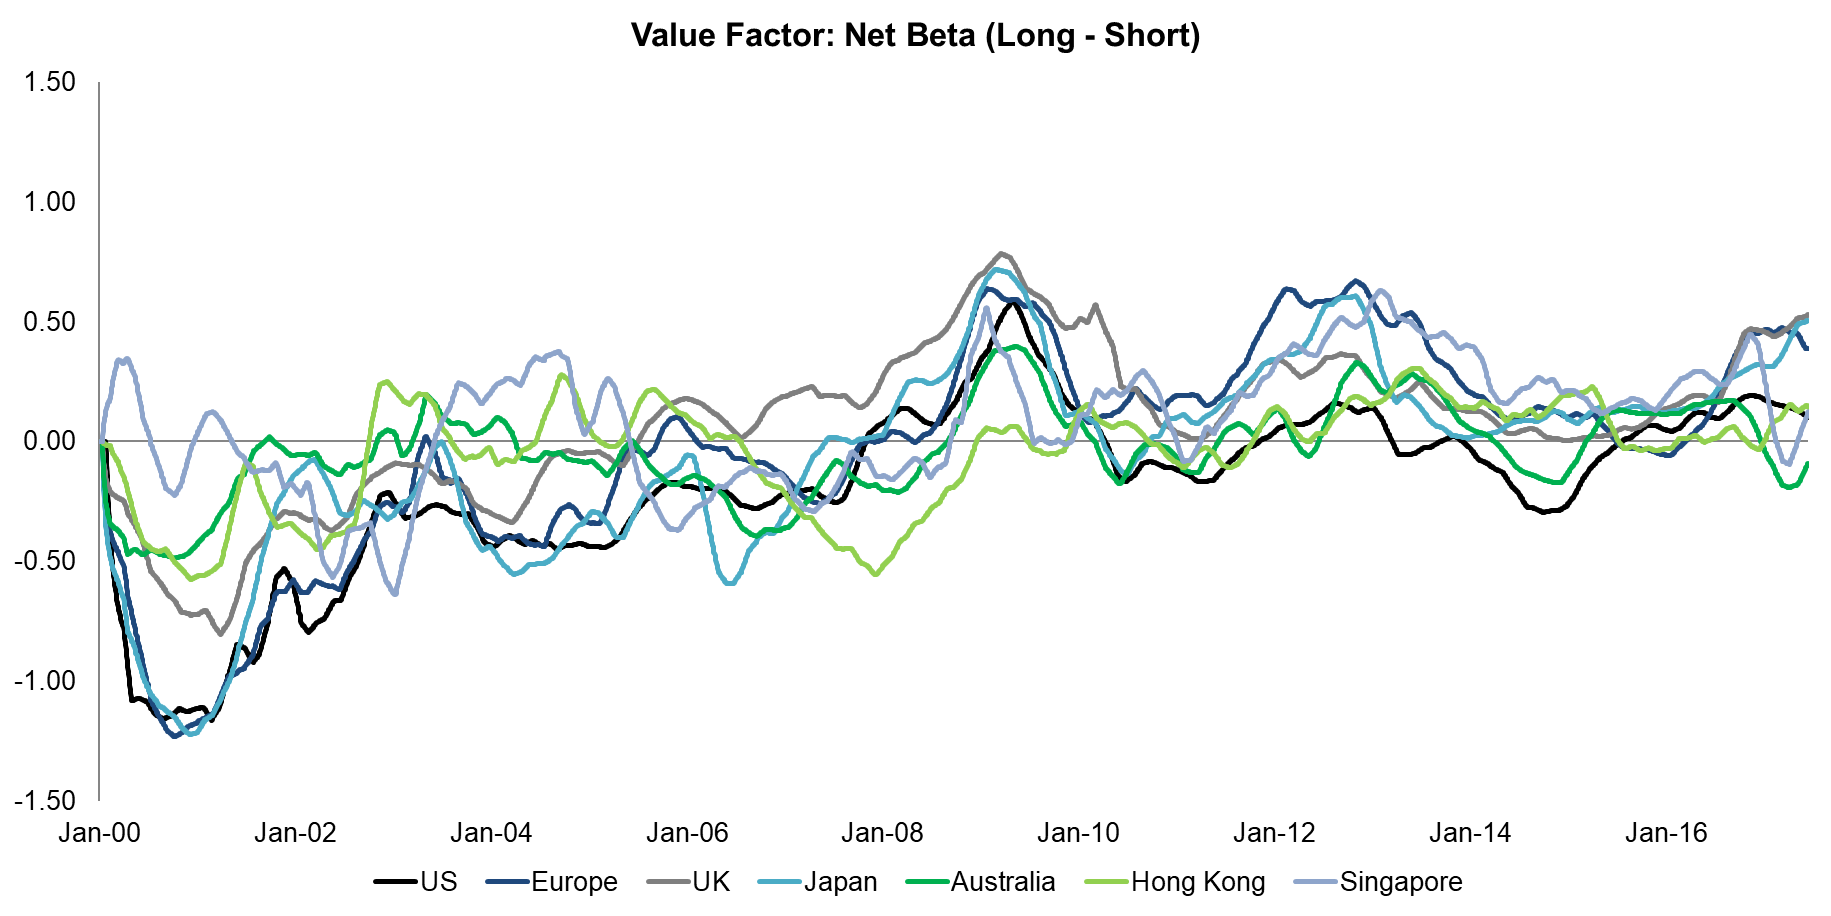
The chart below shows the net beta, which is the beta of the long portfolio minus the beta of the short portfolio, for the Value factor from 2000 to 2017 (read Value US Sectoral Analysis). A positive net beta would imply that the factor would have benefited from the rising nature of equity markets while a negative net beta would mean the inverse. We can observe that Value had a net beta of close to zero on average, indicating that the factor performance was not likely significantly influenced by market returns.
Source: FactorResearch
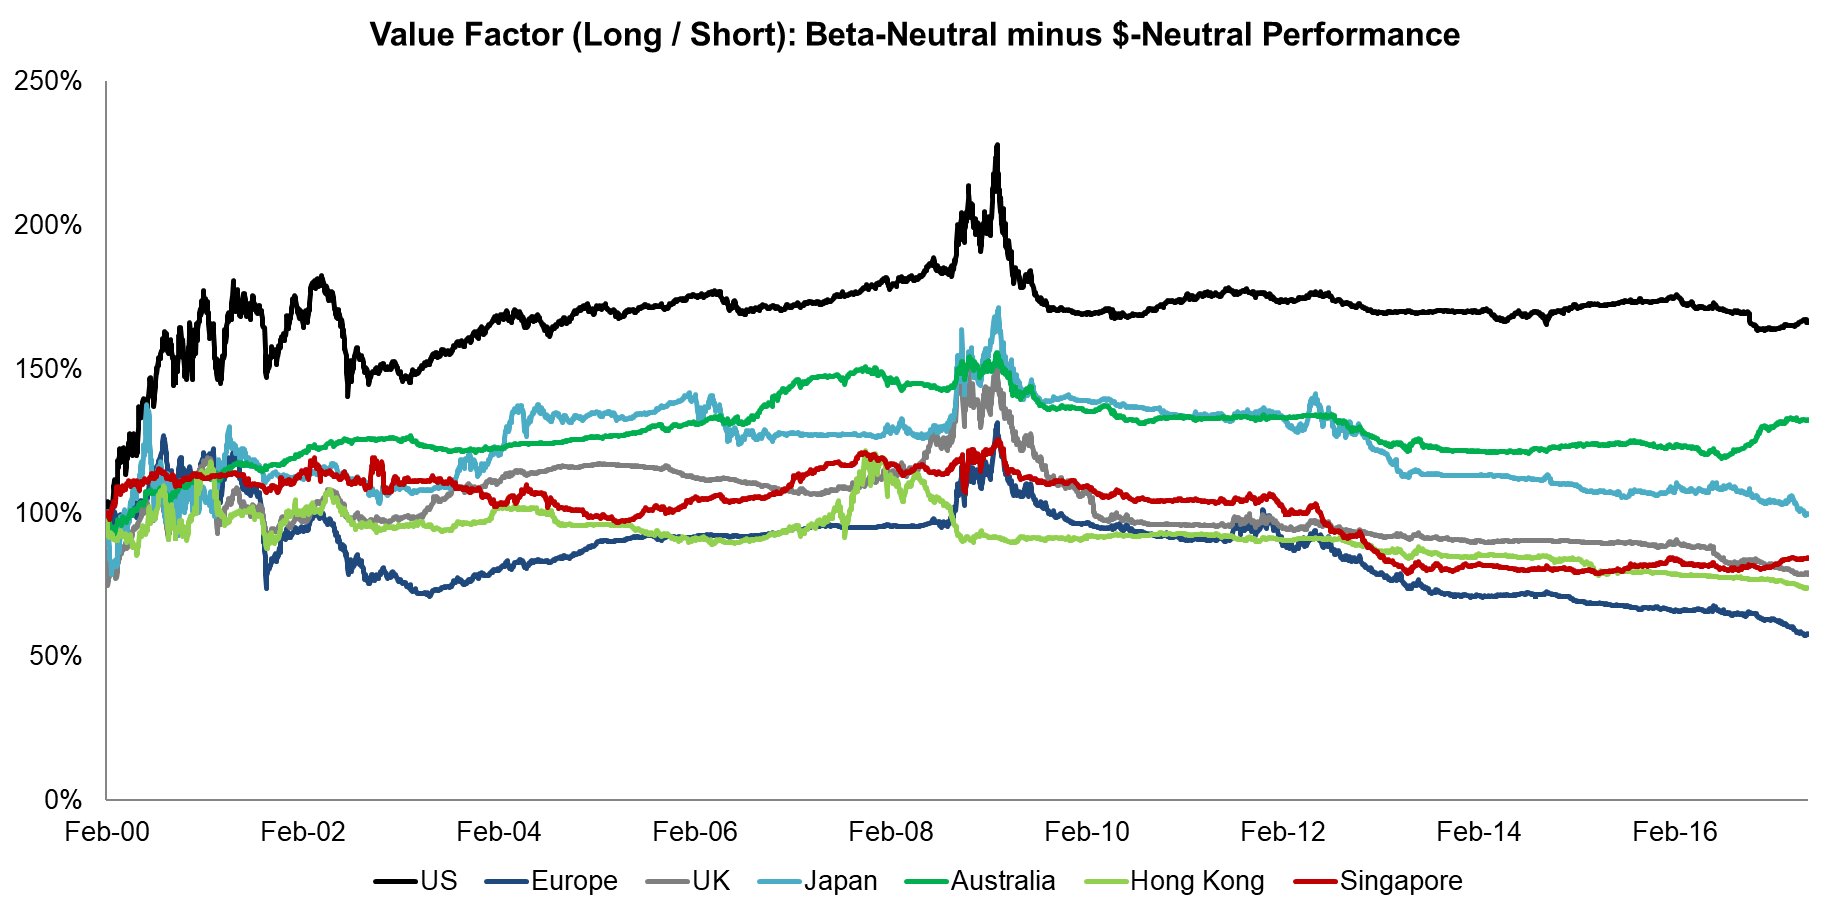
The second chart shows the difference between using beta-neutrality and $-neutrality in portfolio construction. In most markets there seems to be no significant change, which is in line with the net beta being close to zero on average. The only exception is the US, although that seems largely driven from the early years of the analysis, where the beta-neutral portfolio seems to have benefited more from the Tech bubble implosion than the $-neutral.
Source: FactorResearch
SIZE FACTOR (2000 – 2017)
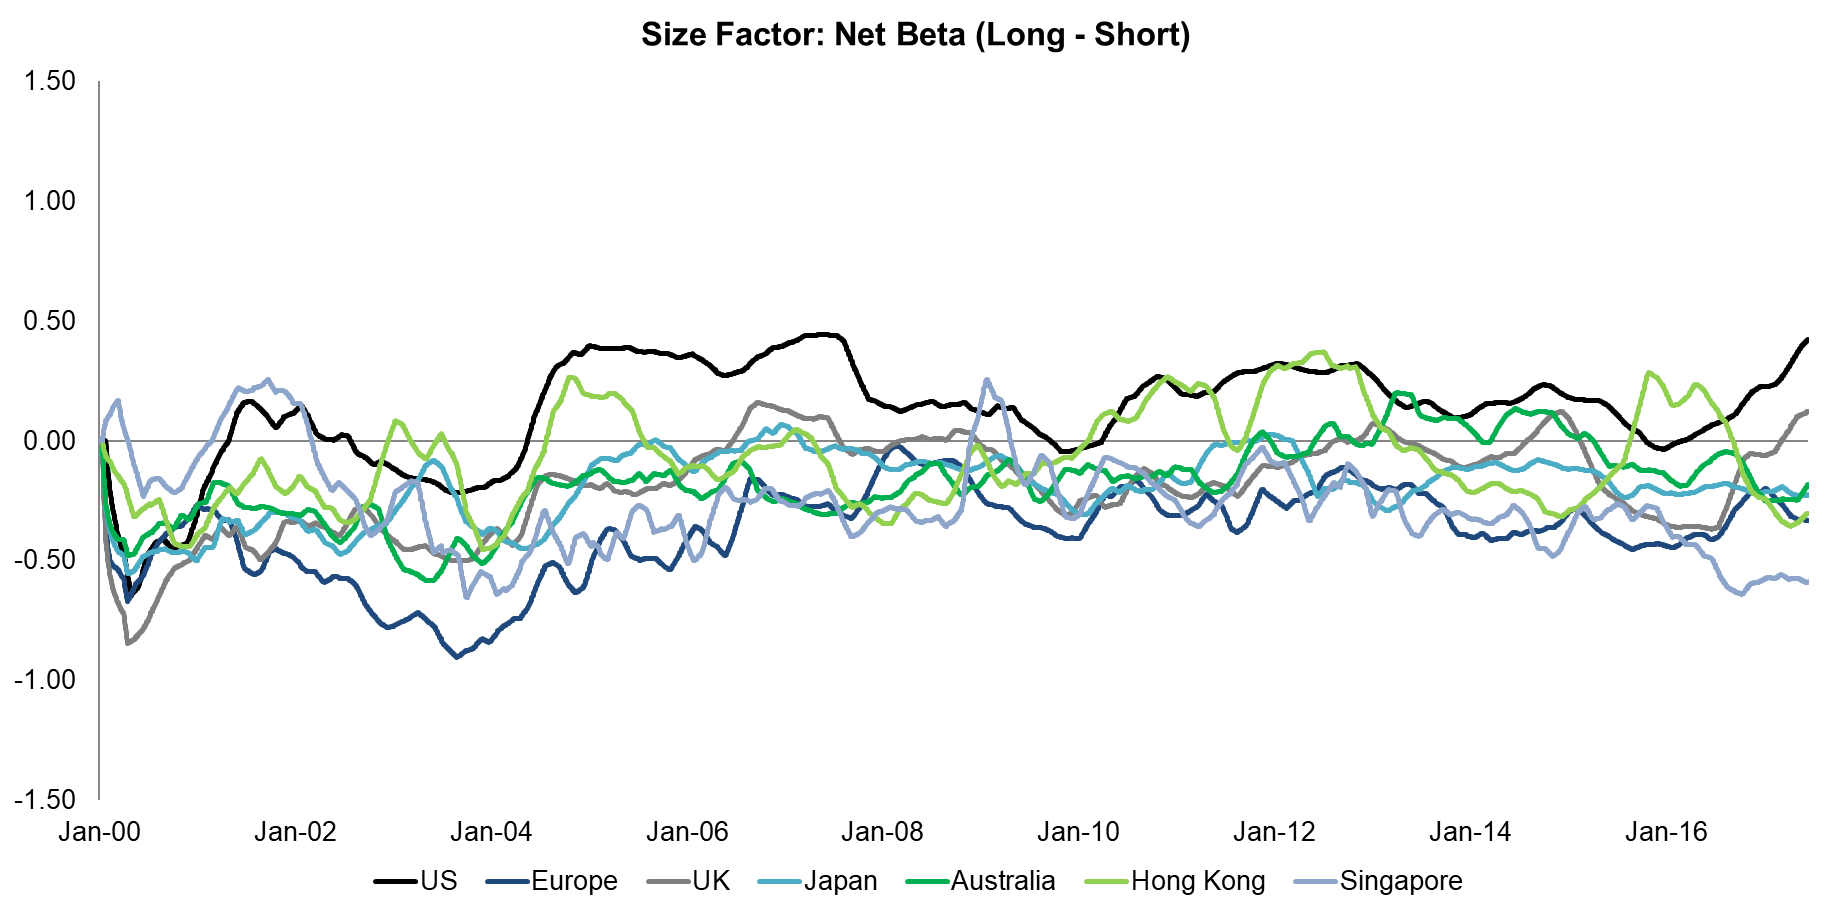
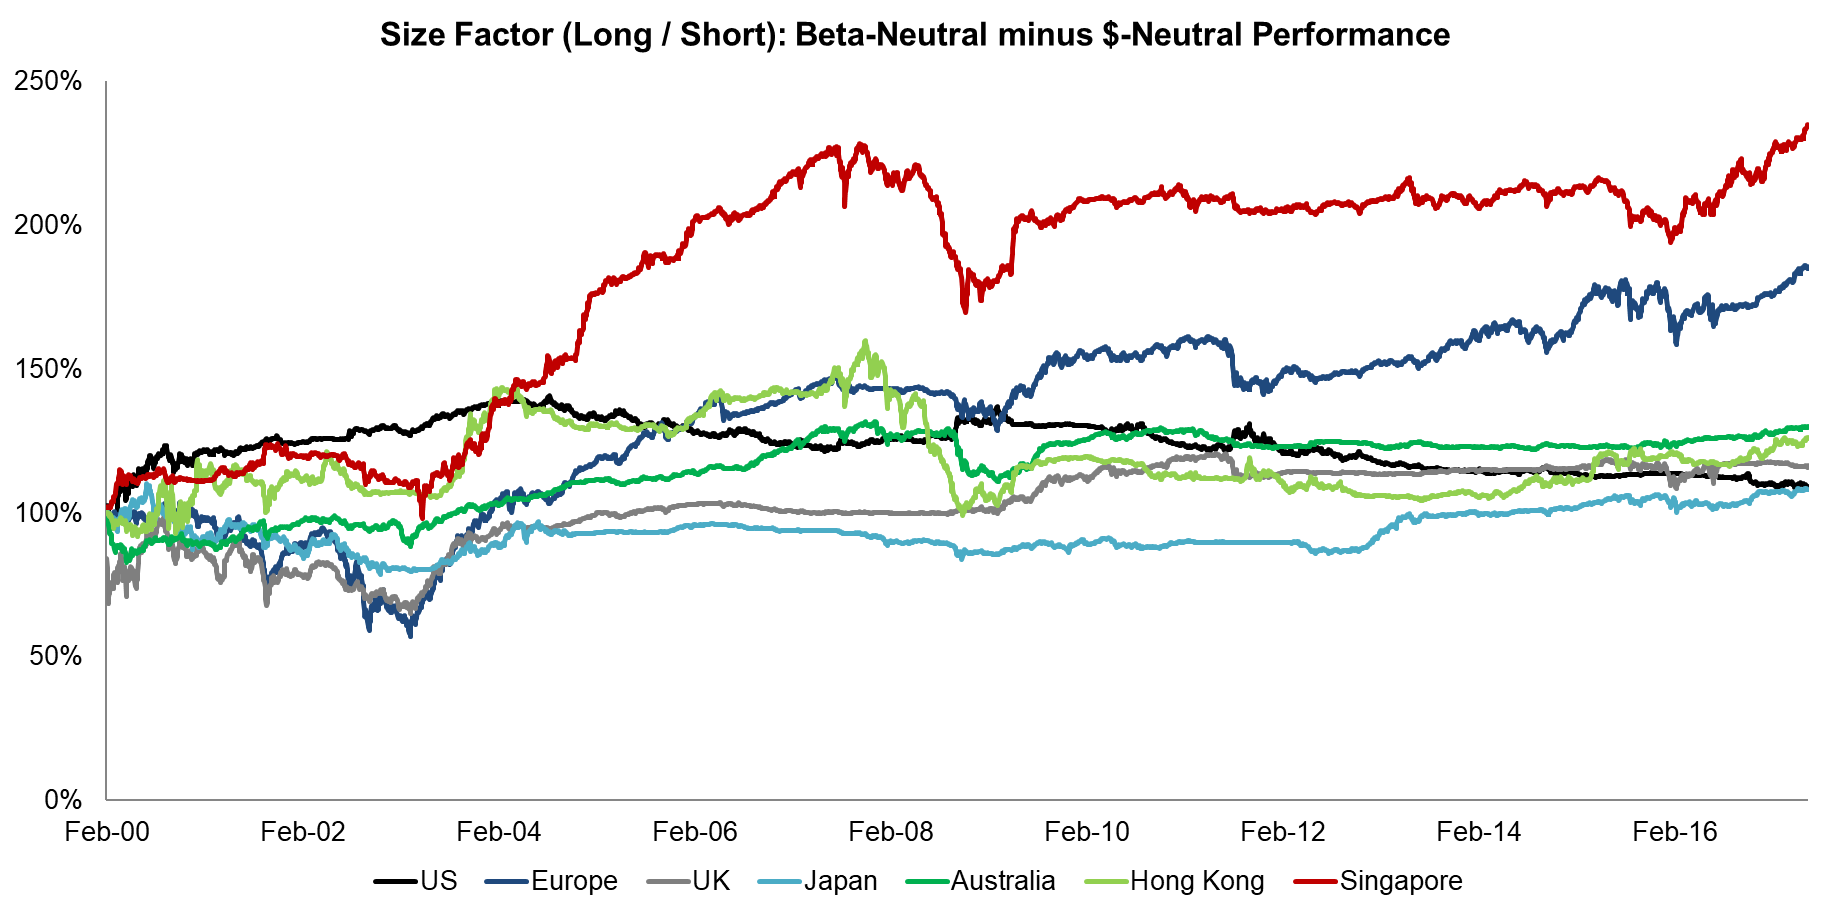
The charts below show that the net beta for the Size factor was slightly negative on average and therefore beta-neutrality improves factor performance in most markets, especially in Europe and Singapore, which had the most negative net beta on average (read Size Factor).
Source: FactorResearch
MOMENTUM FACTOR (2000 – 2017)
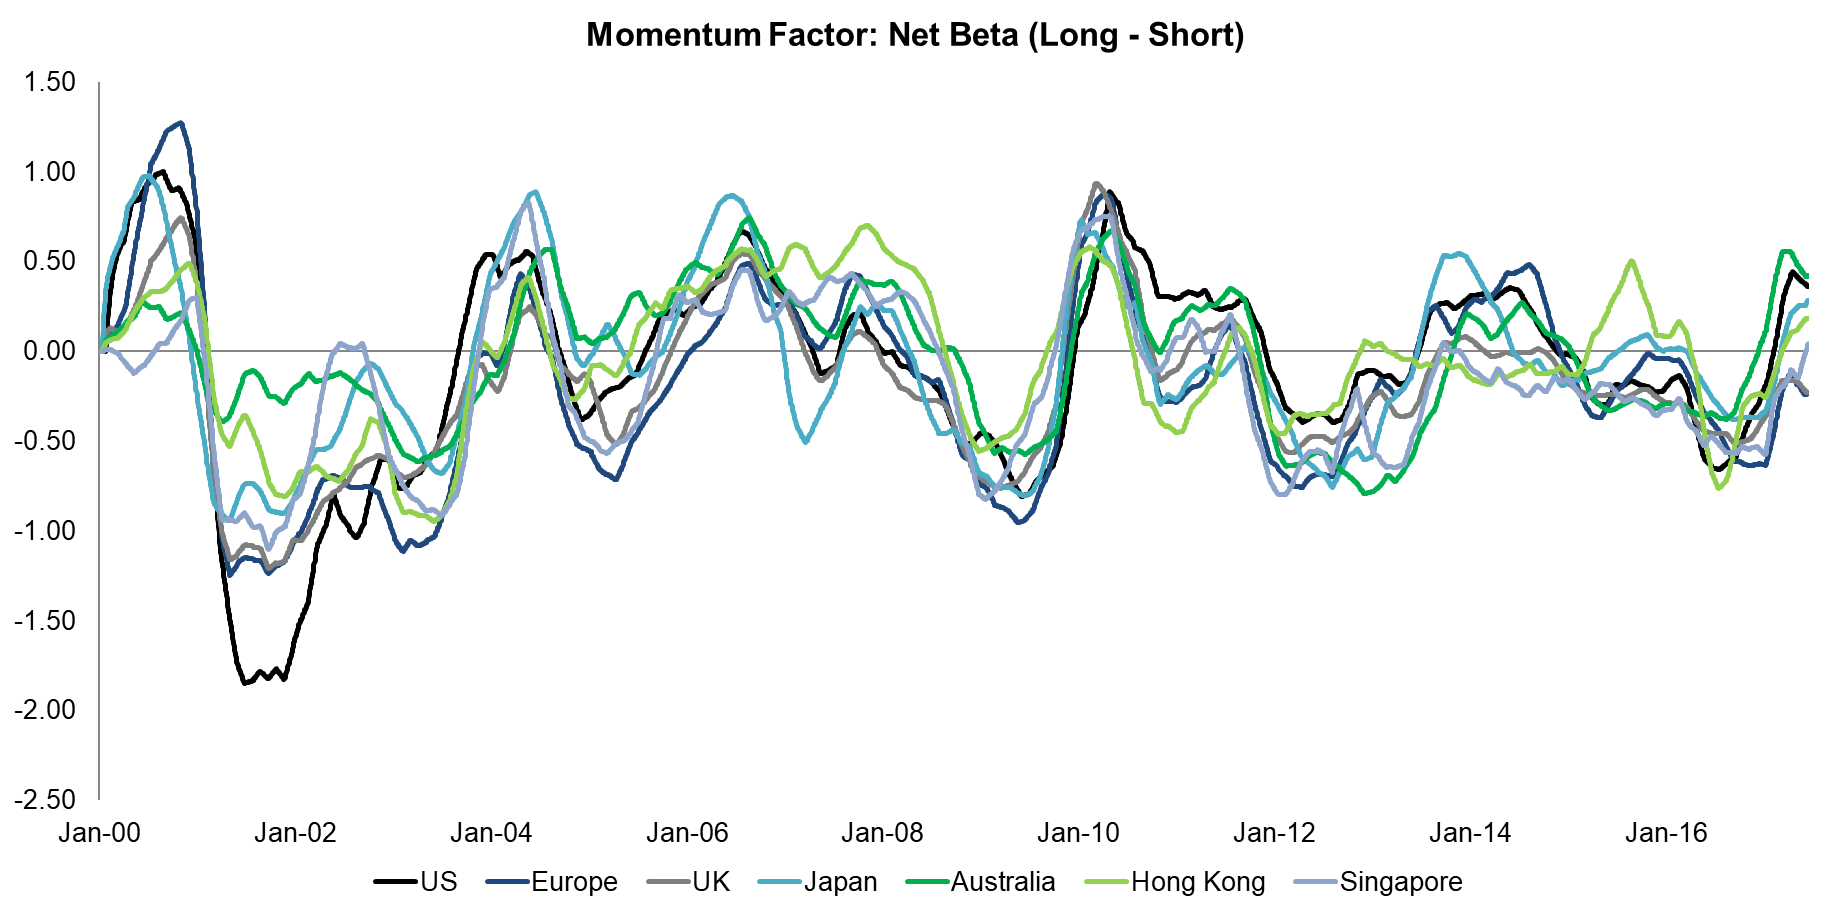
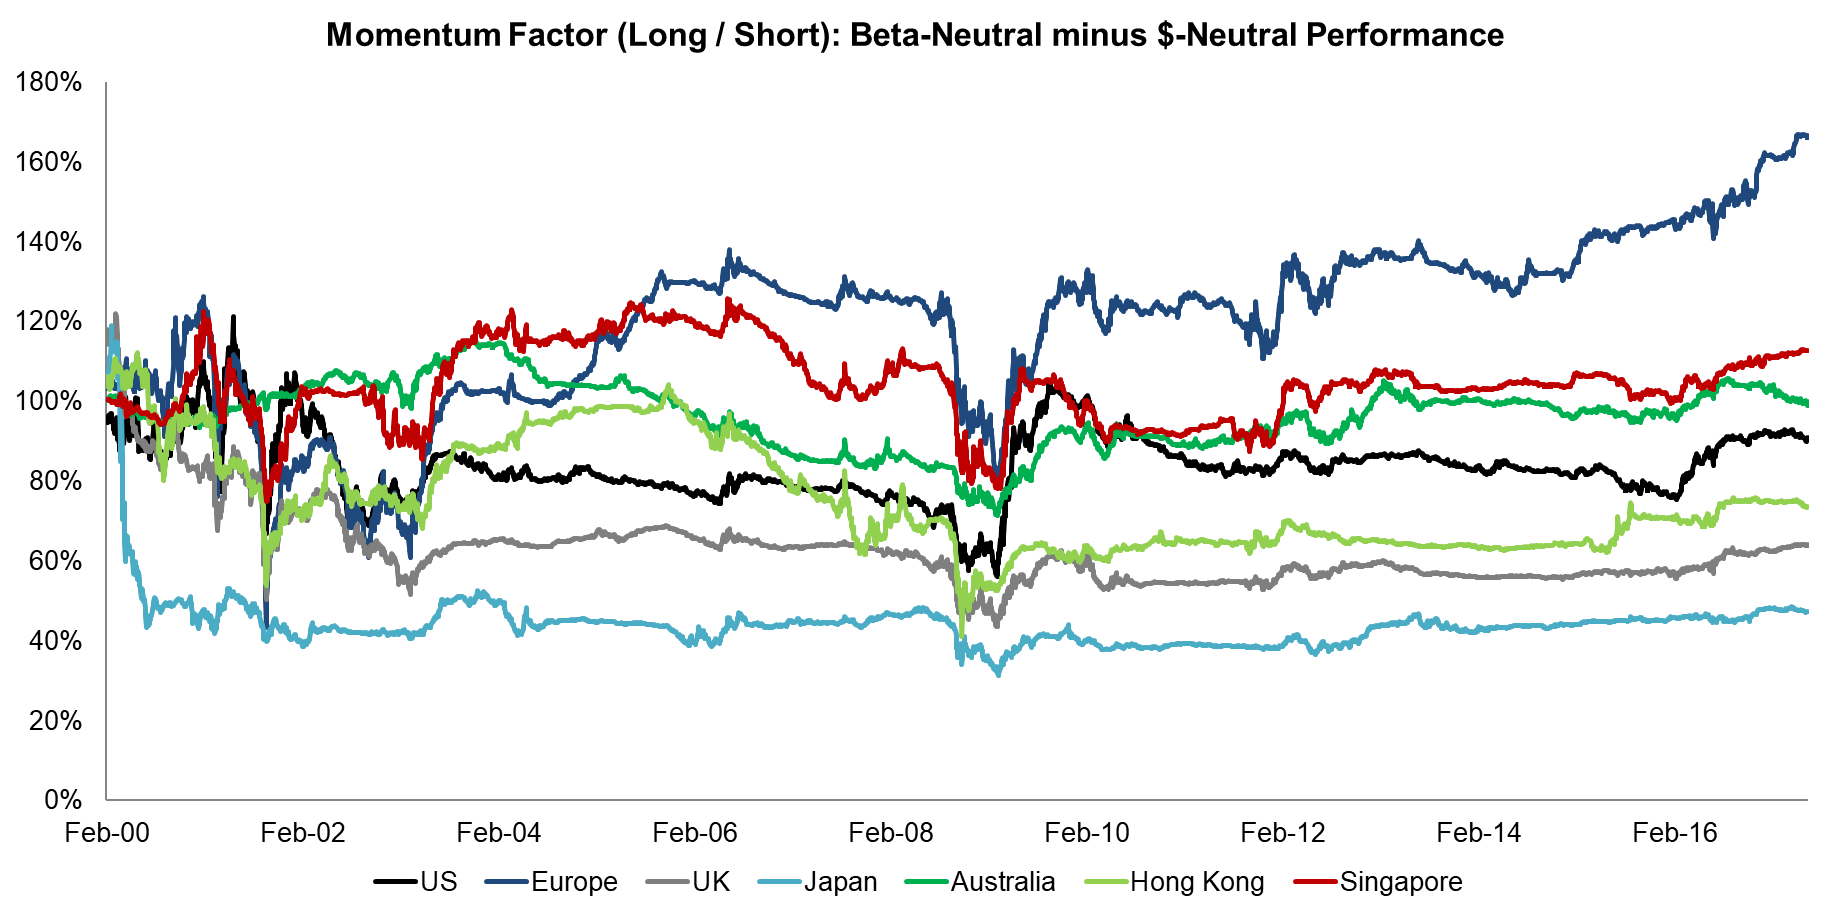
The charts below show that the net beta for the Momentum factor was highly volatile over time, which can be explained by the nature of the strategy, i.e. buying winners and selling losers, and that beta-neutrality on average does not improve performance compared to $-neutrality.
Source: FactorResearch
LOW VOLATILITY FACTOR (2000 – 2017)
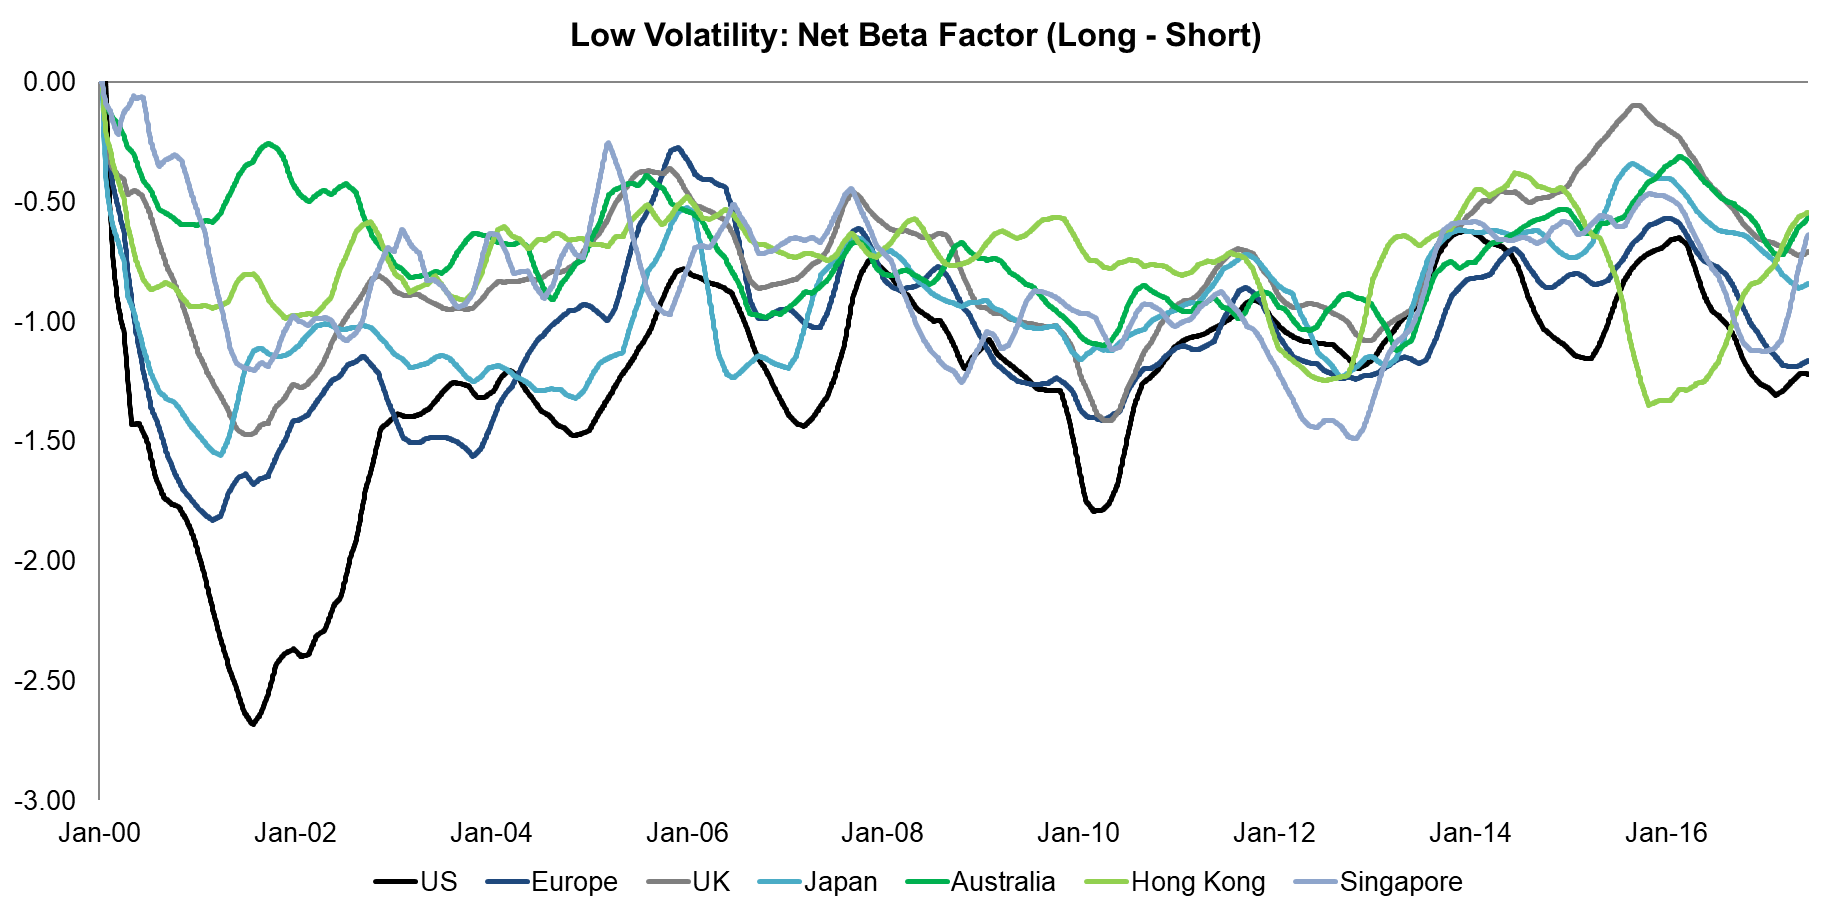
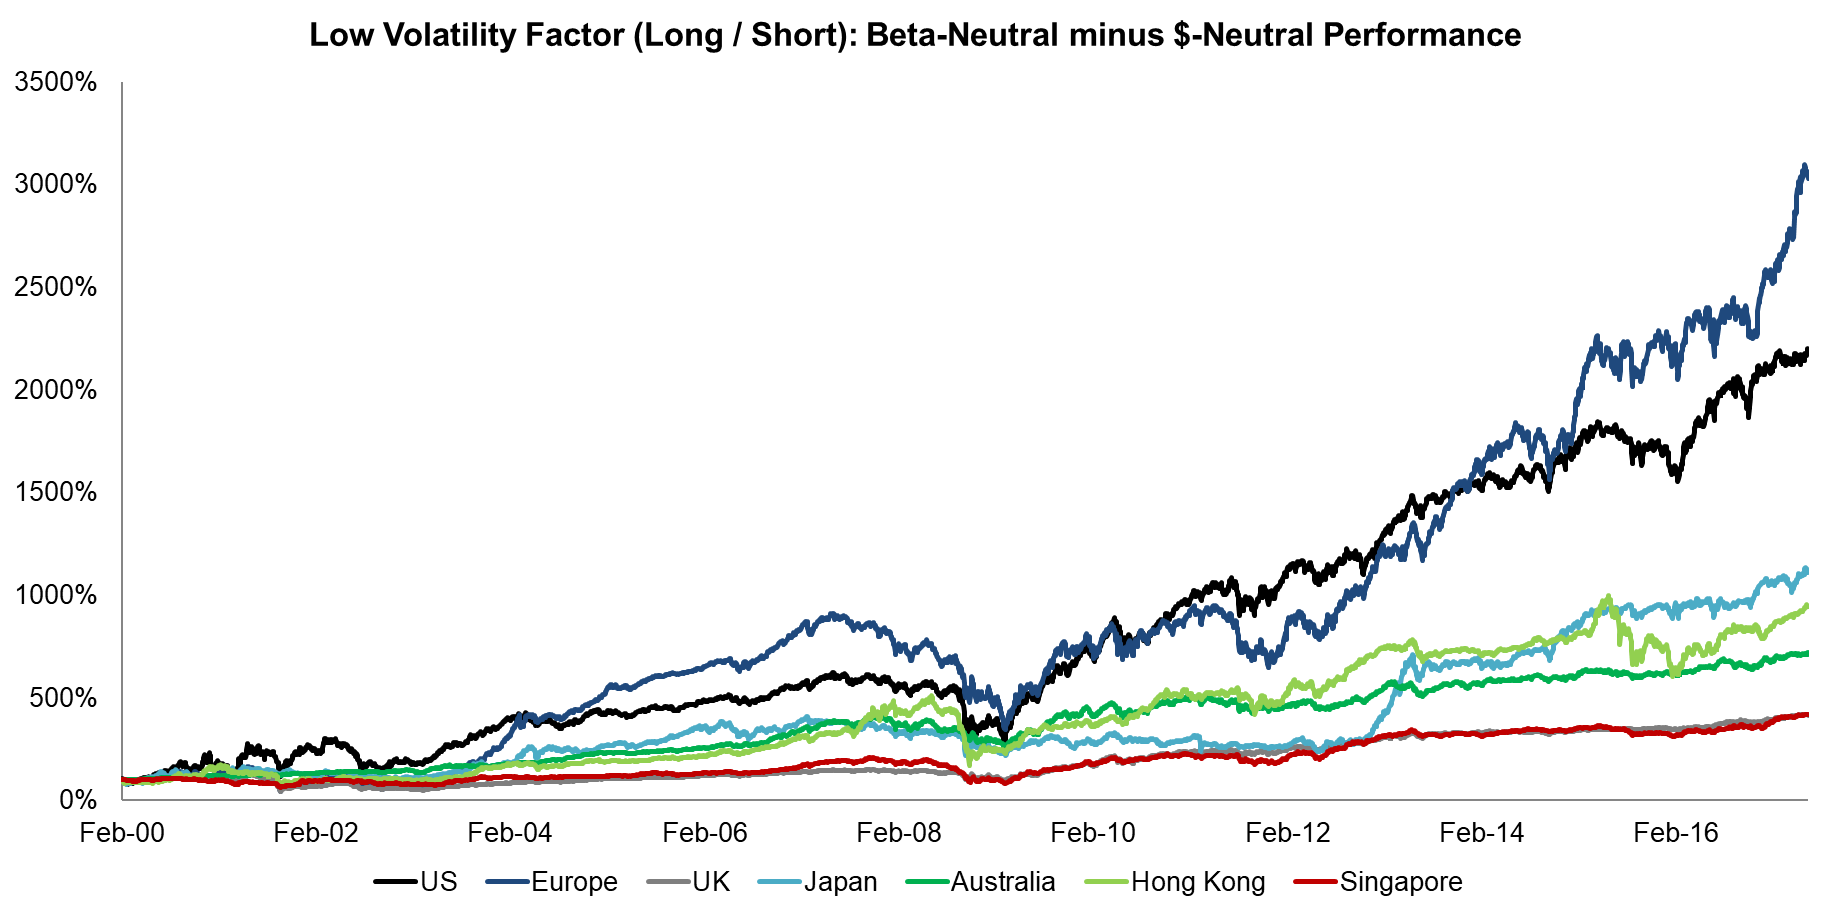
The charts below show that the net beta for the Low Volatility factor was strongly negative on average and that beta-neutrality significantly improves the factor performance, which is intuitive as the factor selects stocks based on their volatility, which is similar to beta, i.e. per definition the long portfolio will have much lower beta than the short portfolio.
Source: FactorResearch
QUALITY FACTOR (2000 – 2017)
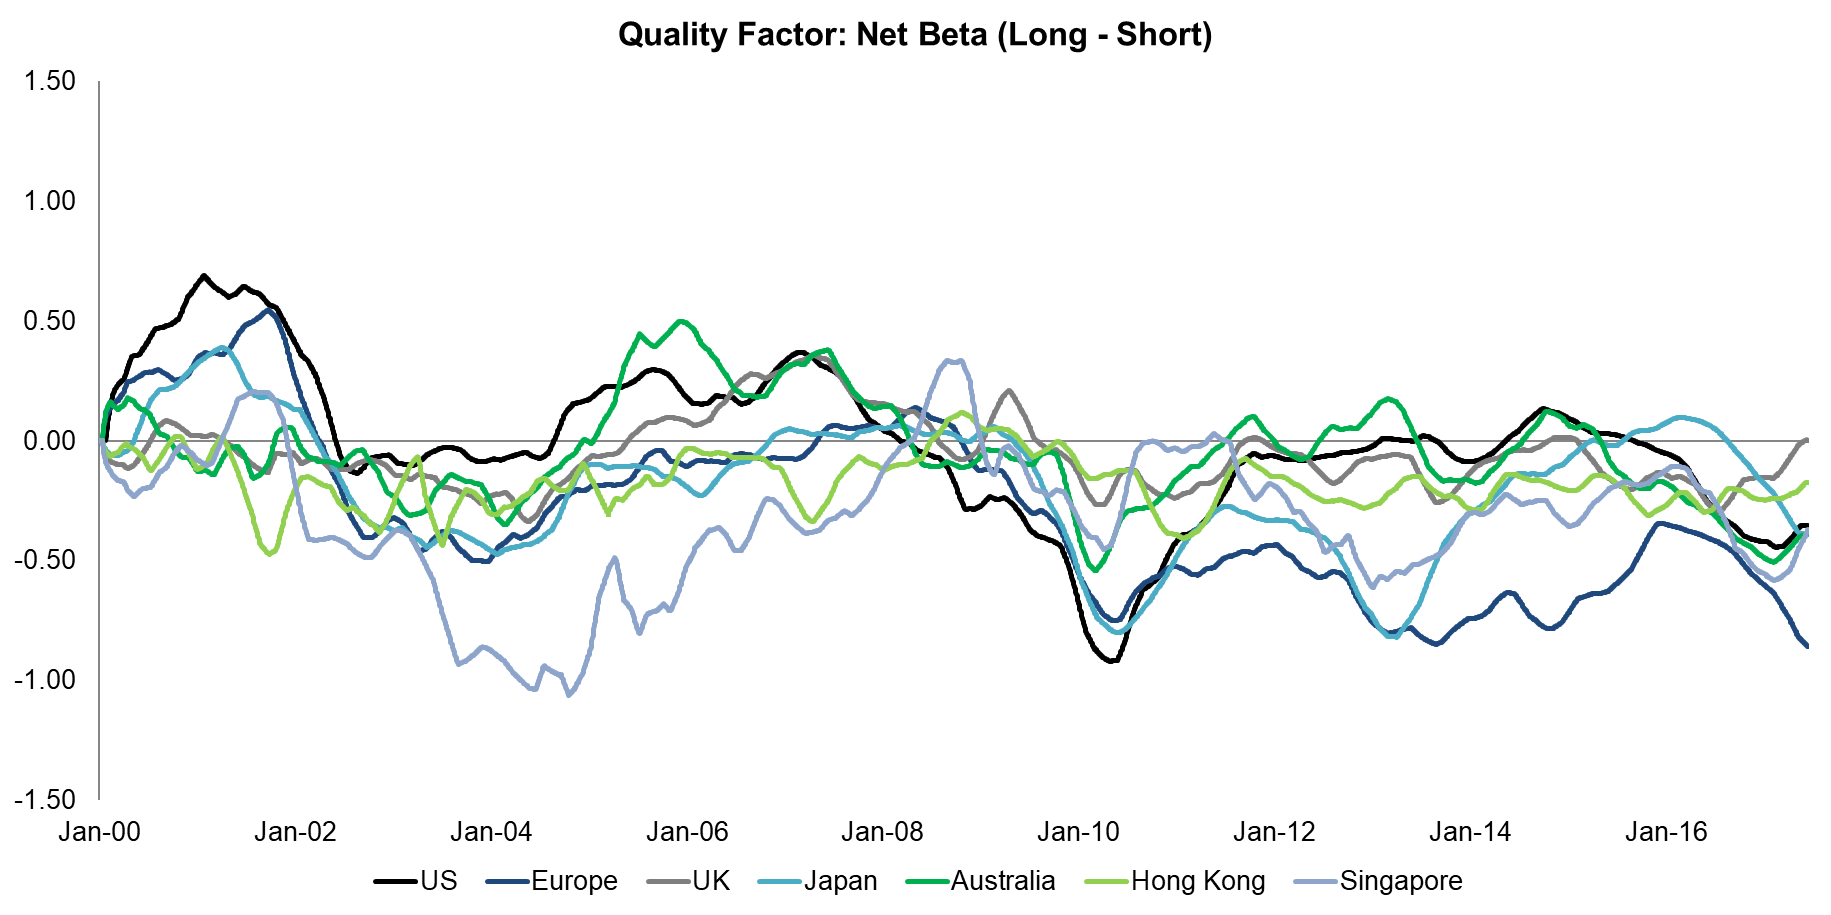
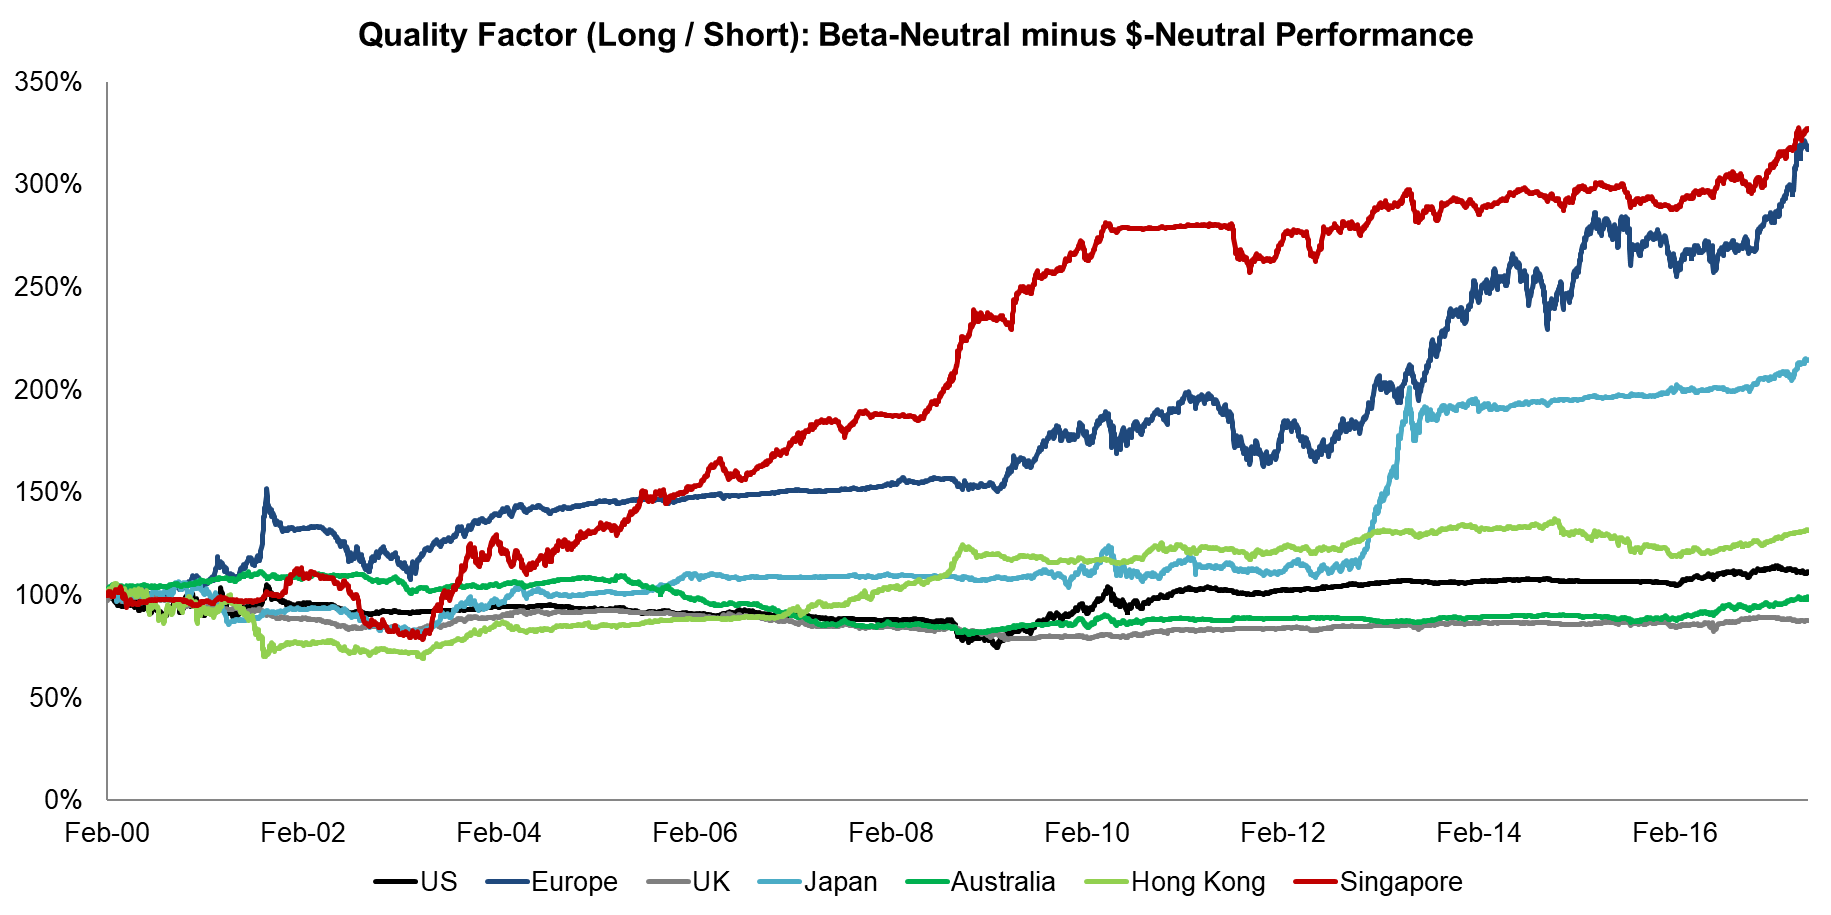
The charts below show that the net beta for the Quality factor was slightly negative on average and that beta-neutrality improves the factor performance. Companies considered high quality, which we define as having low leverage and high profitability, are often not particular exciting and frequently have betas below 1.
Source: FactorResearch
GROWTH FACTOR (2000 – 2017)
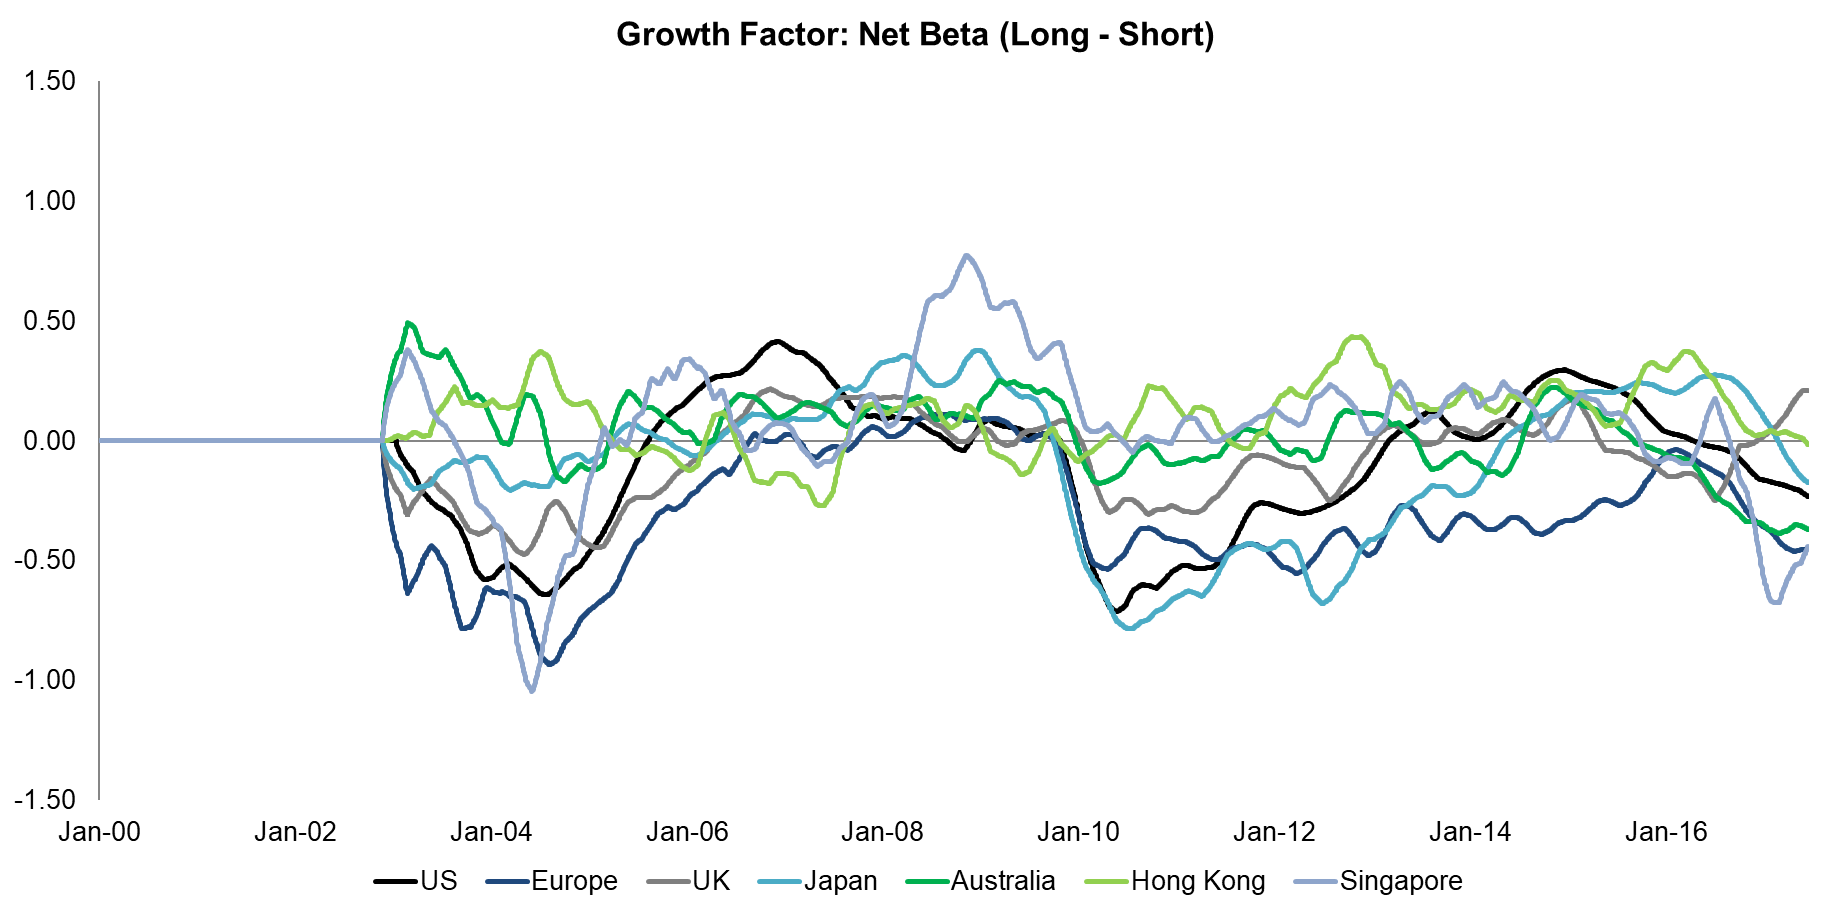
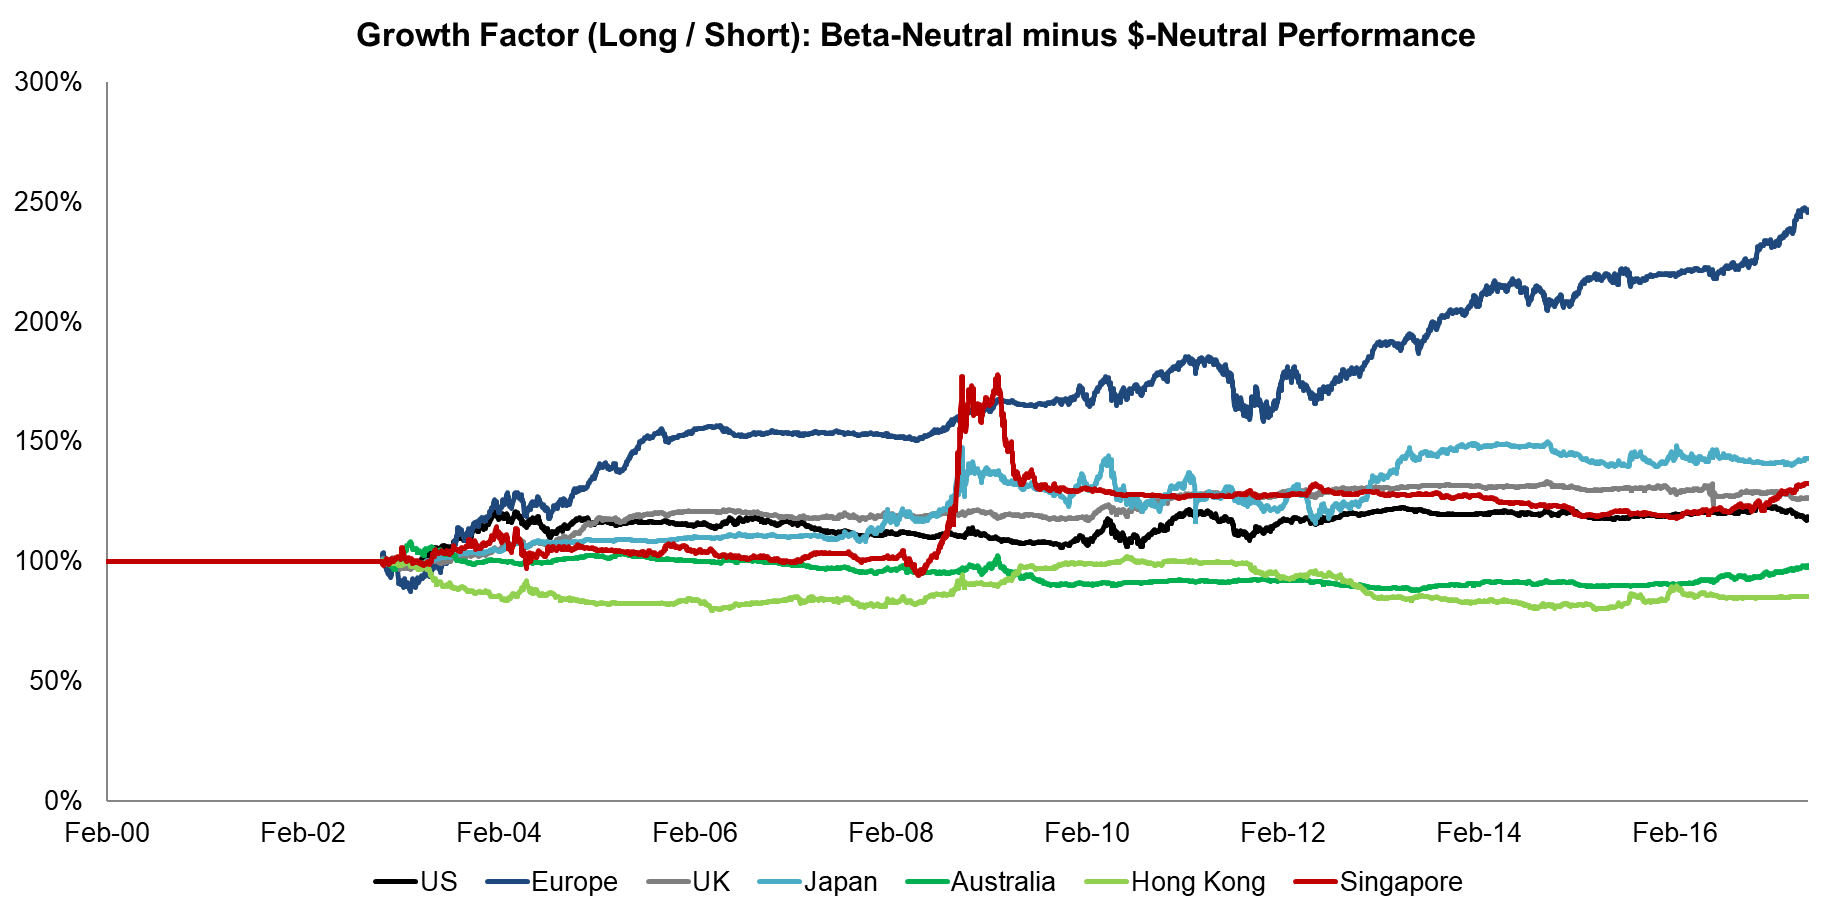
The charts below show that the net beta for the Growth factor was negative on average and that beta-neutrality improves the factor performance in some markets. It’s not intuitive that the net beta is negative, we would have expected high growth companies to have a higher beta than low growth companies.
Source: FactorResearch
FURTHER THOUGHTS
The research note shows that beta was not driving factor performance in $-neutral portfolios, in many cases beta-neutral portfolios showed better performance, despite generally rising equity markets during the observation period.
We believe that the key benefit of constructing portfolios beta-neutral is the lower correlation to long-only indices. Given that investors often seek factor exposure, especially if structured as long-short portfolios, for portfolio diversification, the lower correlation should be seen as a major advantage.
ABOUT THE AUTHOR
Nicolas Rabener is the CEO & Founder of Finominal, which empowers professional investors with data, technology, and research insights to improve their investment outcomes. Previously he created Jackdaw Capital, an award-winning quantitative hedge fund. Before that Nicolas worked at GIC and Citigroup in London and New York. Nicolas holds a Master of Finance from HHL Leipzig Graduate School of Management, is a CAIA charter holder, and enjoys endurance sports (Ironman & 100km Ultramarathon).
Connect with me on LinkedIn or X.

