Factor Construction: Portfolio Scenarios
How Many Stocks Are Needed to Capture Factor Returns?
November 2017. Reading Time: 10 Minutes. Author: Nicolas Rabener.
SUMMARY
- Most researchers create factor portfolios by taking the top & bottom 30% of stocks, which results in large portfolios
- Portfolios can be reduced, but firm risks start influencing factor returns with too few stocks
- Most investors are likely better of buying factor products then building factor portfolios themselves
INTRODUCTION
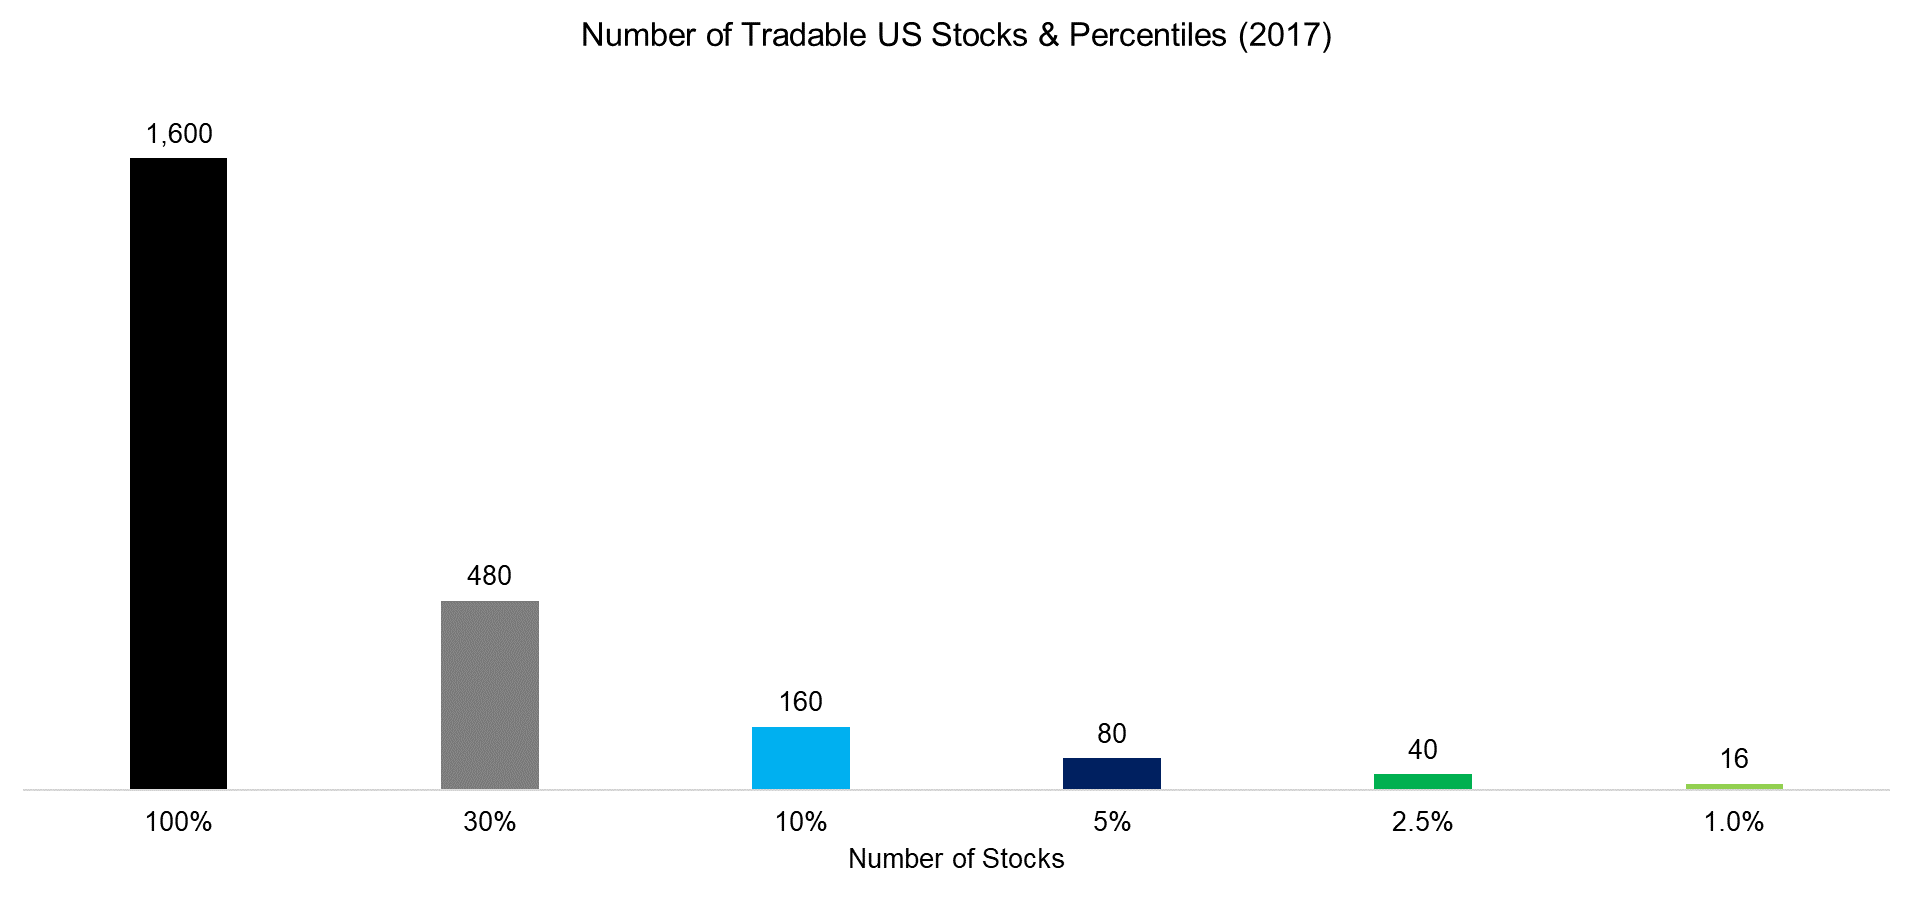
Investors glancing at the Wilshire 5000 Total Market Index would intuitively assume that the index contains 5,000 stocks, unless they already know that it currently only contains about 3,800 stocks. Interestingly the index included 7,500 stocks in 1998. The significant decline in stocks can mainly be attributed to M&A activities, private equity take-privates and fewer IPOs. The universe shrinks further to about 1,600 stocks when a few simple filters like minimum market capitalisations of $1 billion or minimum volumes are considered. However, 1,600 stocks is still a large universe for factor investors, considering that most academic researchers create factor portfolios by taking the top and bottom 30% of the stock universe. In this short research note we will analyse how many stocks investors require to effectively create factor portfolios (read Smart Beta vs Factors in Portfolio Construction).
METHODOLOGY
We utilise two sets of factor data for the US stock market. The first is from Fama-French, which includes Value, Size and Momentum, and the second is our data, which includes the first three factors as well as Low Volatility, Quality, Growth and Dividend Yield. The factors are created by constructing long-short beta-neutral portfolios of the top and bottom stocks of the US stock market. Portfolios are rebalanced monthly and include 10bps of transaction costs.
FACTOR PORTFOLIO CONSTRUCTION CONSIDERATIONS
Most academic research on factor investing is based on long-short portfolios that take the top and bottom 30% of the stock market. For our definition of tradable stocks in the US, which results in approximately 1,600 stocks, this implies 480 stocks on the long and 480 stocks on the short side, which is not practical for most investors. Only if we reduce the top and bottom to 2.5%, then we derive 40 stocks for each side, which is more practical from a portfolio management perspective.
Source: FactorResearch
VALUE, SIZE & MOMENTUM: TOP & BOTTOM 10% vs 30%
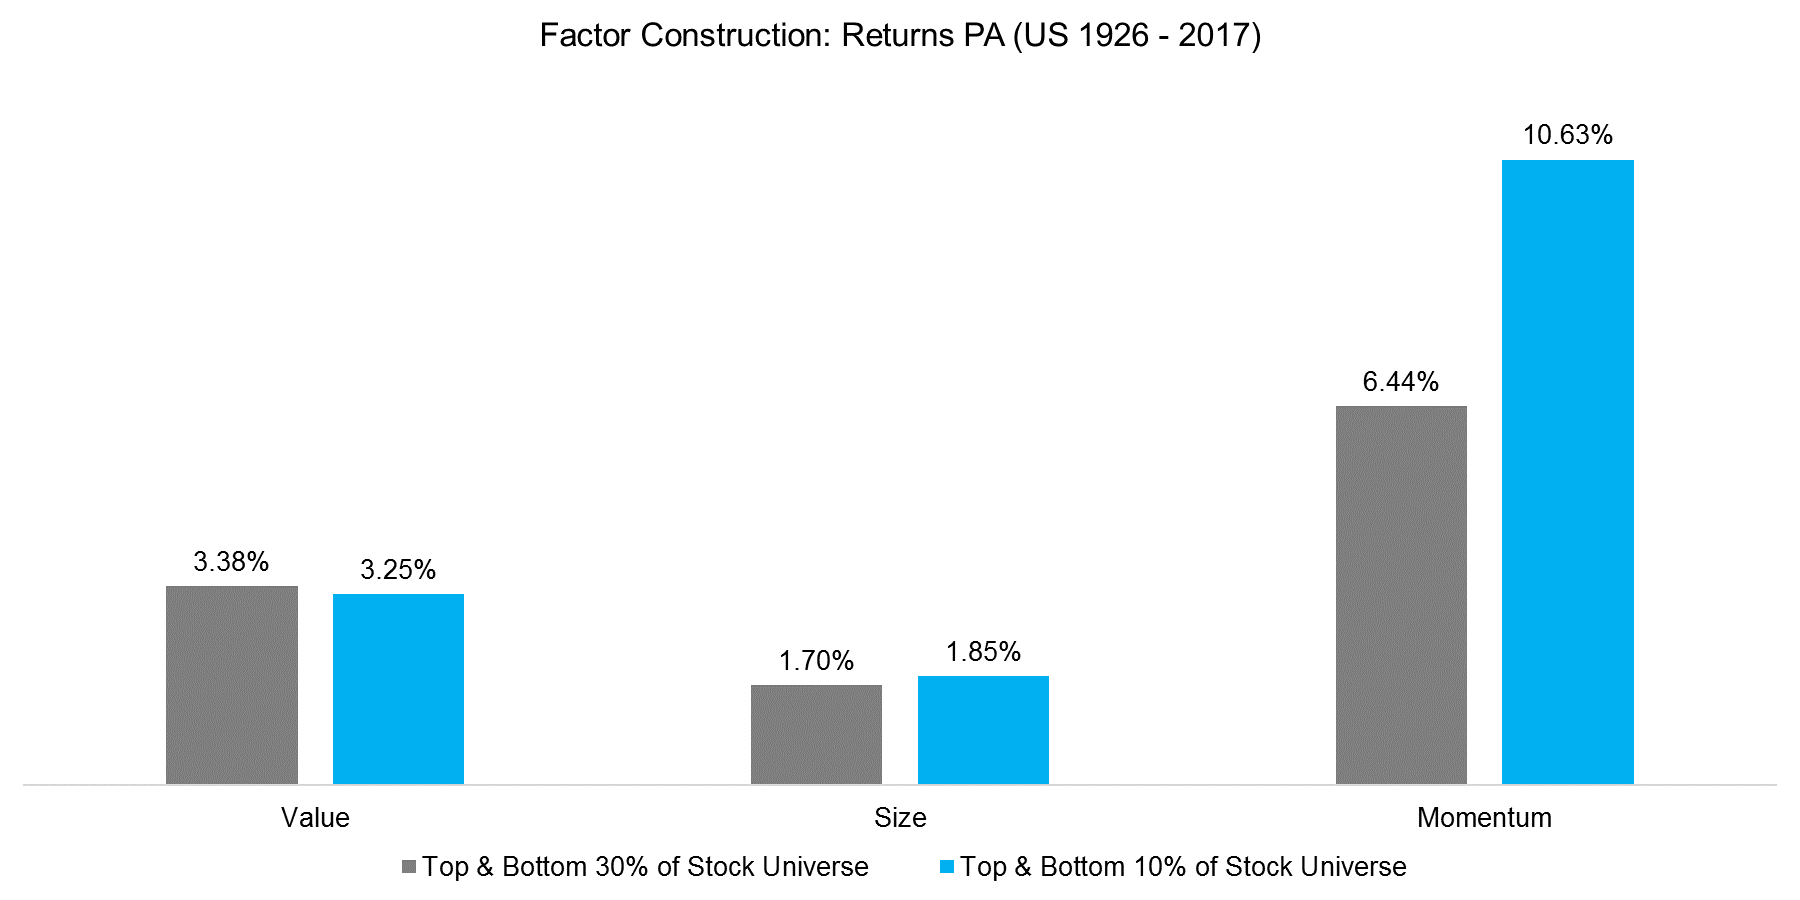
The chart below shows the returns for the Value, Size and Momentum factors from 1926 to 2016, once for the top and bottom 10% and once for the 30% of the US stock market. Investors might expect that the 10% portfolio, which comprises more extreme portfolios in terms of factor exposure, should show higher returns over the time period, but we can observe that only holds true for the Momentum factor (read Momentum Factor: Intra vs Cross-Sector).
Source: FactorResearch, Fama-French
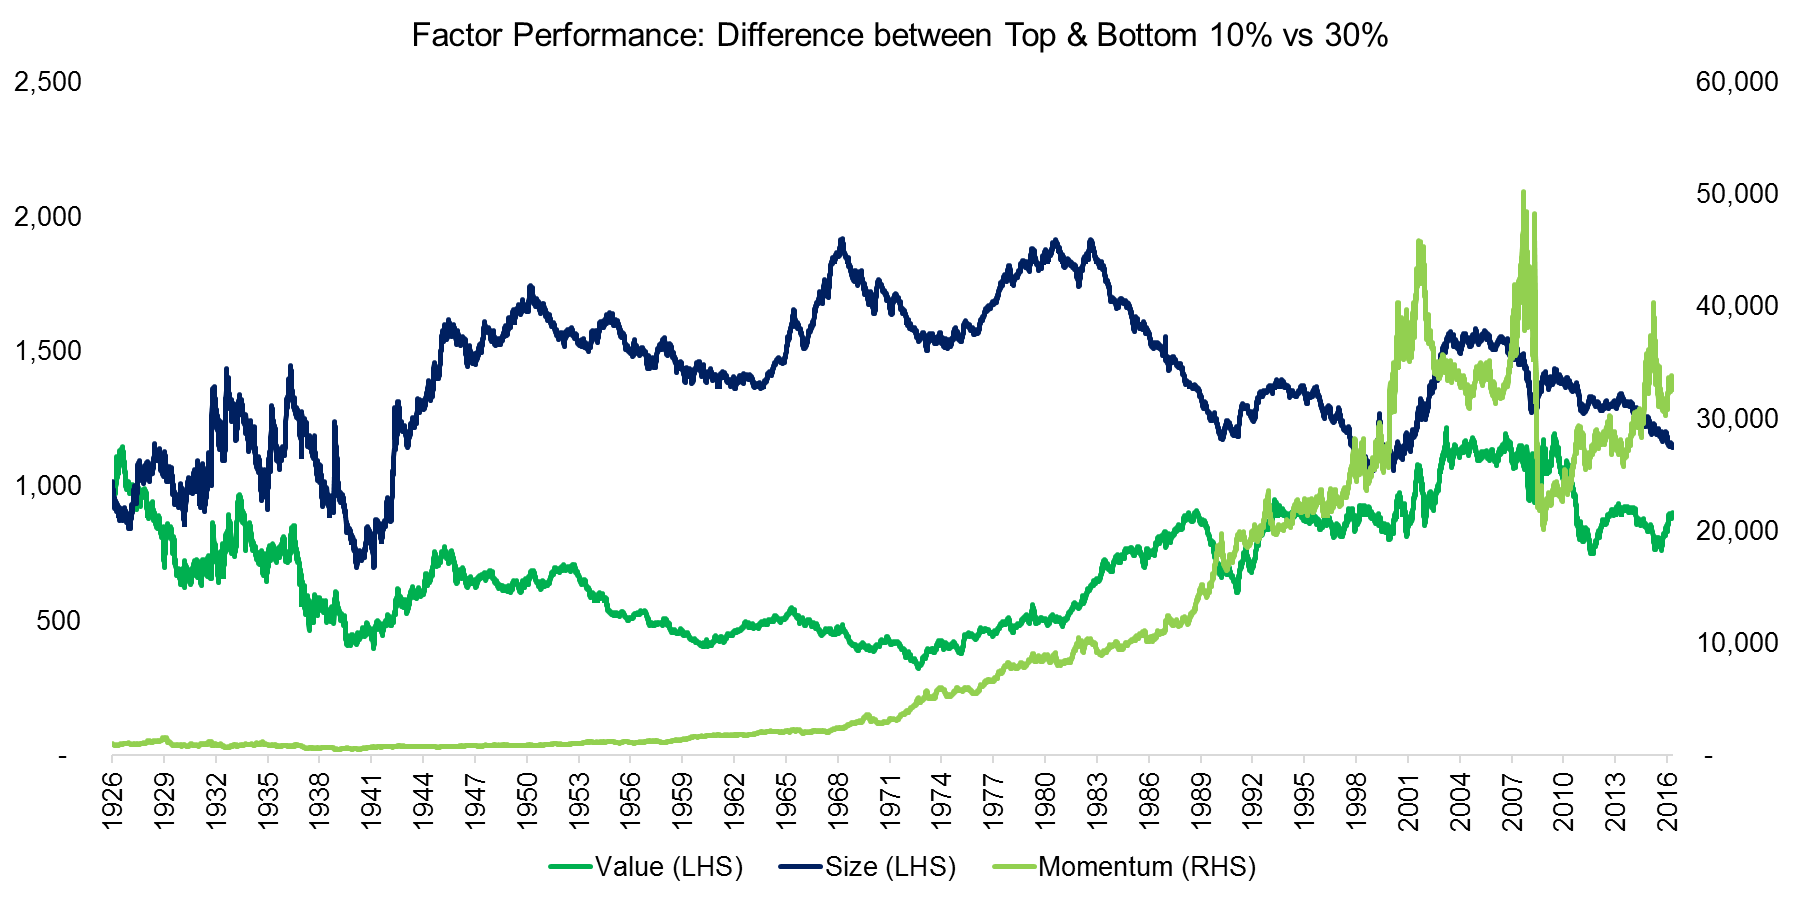
We can also analyse the difference between the portfolios over time. In the chart below we can observe that for the Value and Size factors there were periods where the 10% portfolio outperformed the 30% portfolio, but also long periods of underperformance. The Momentum factor shows consistently stronger returns over time for the 10% portfolio; however, drawdowns like the Momentum crash of 2009 are also amplified.
Source: FactorResearch, Fama-French
PORTFOLIO SCENARIOS
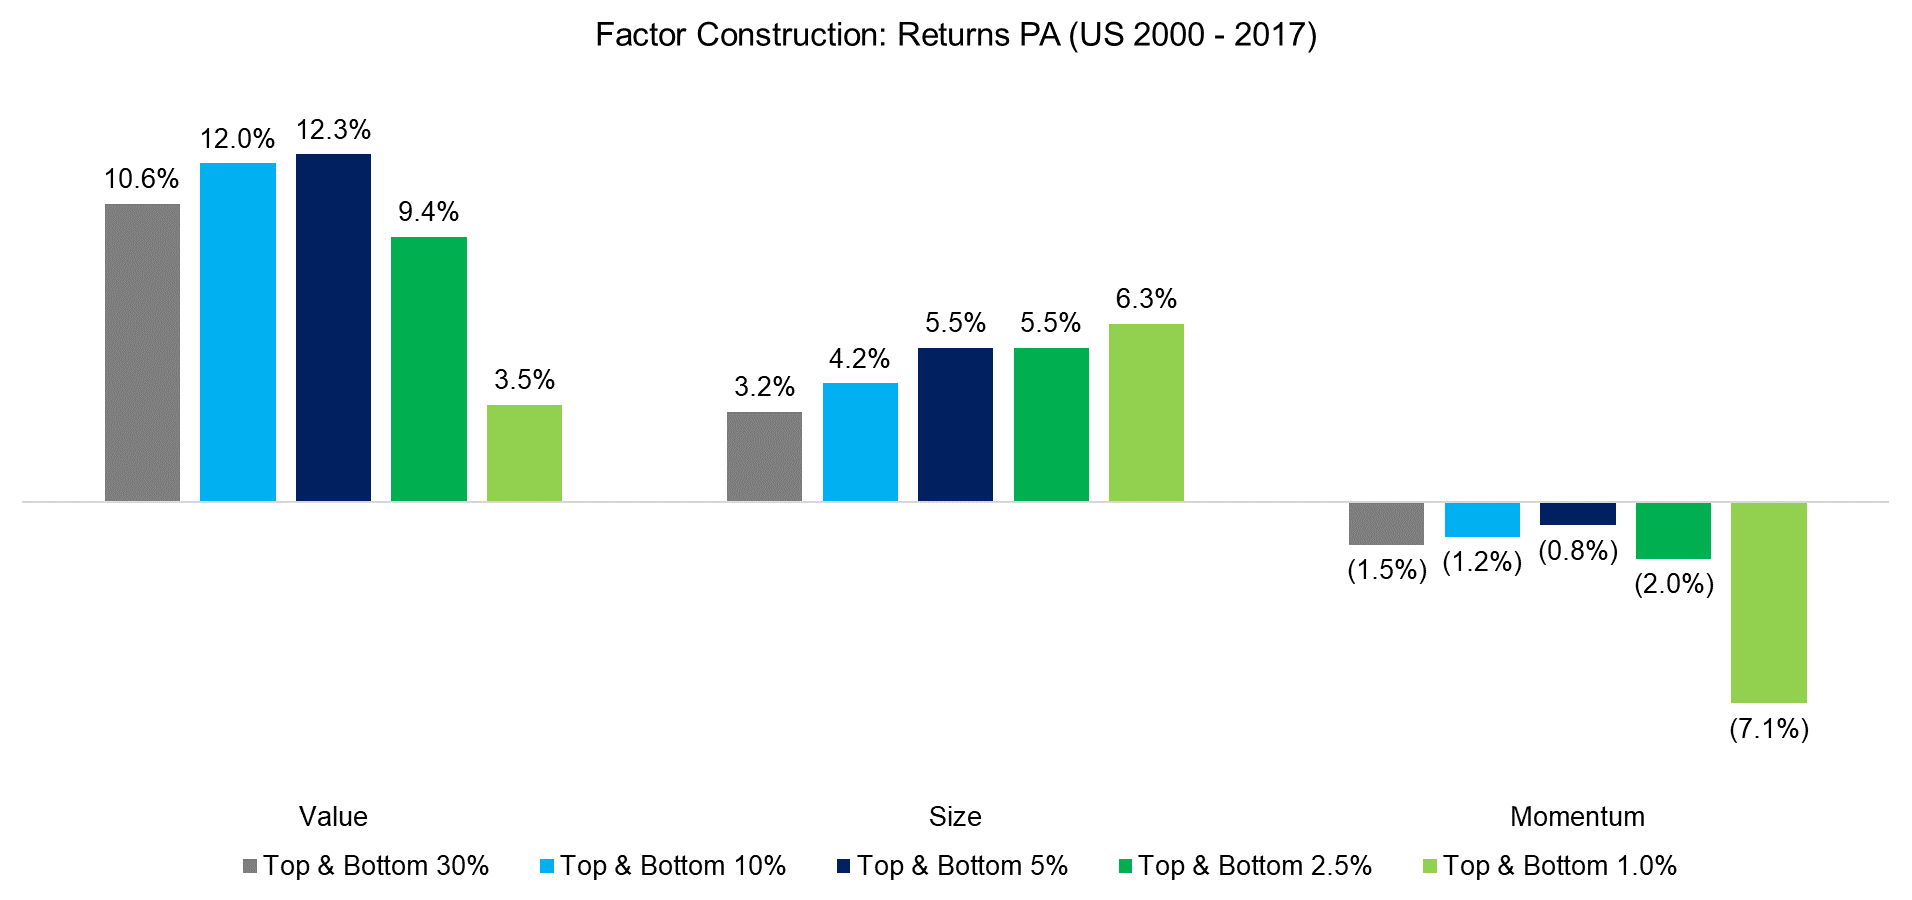
The analysis can be extended by using our factor data set to include 5%, 2.5% and 1% portfolios. We can observe that the returns per annum improve monotonously for the Value, Size and Momentum factors when reducing the portfolios from 30% to 5%. However, the results become more heterogeneous if the portfolios are reduced further, which can be explained that the single stock risk is increasing in the smaller portfolios, influencing factor returns.
Source: FactorResearch
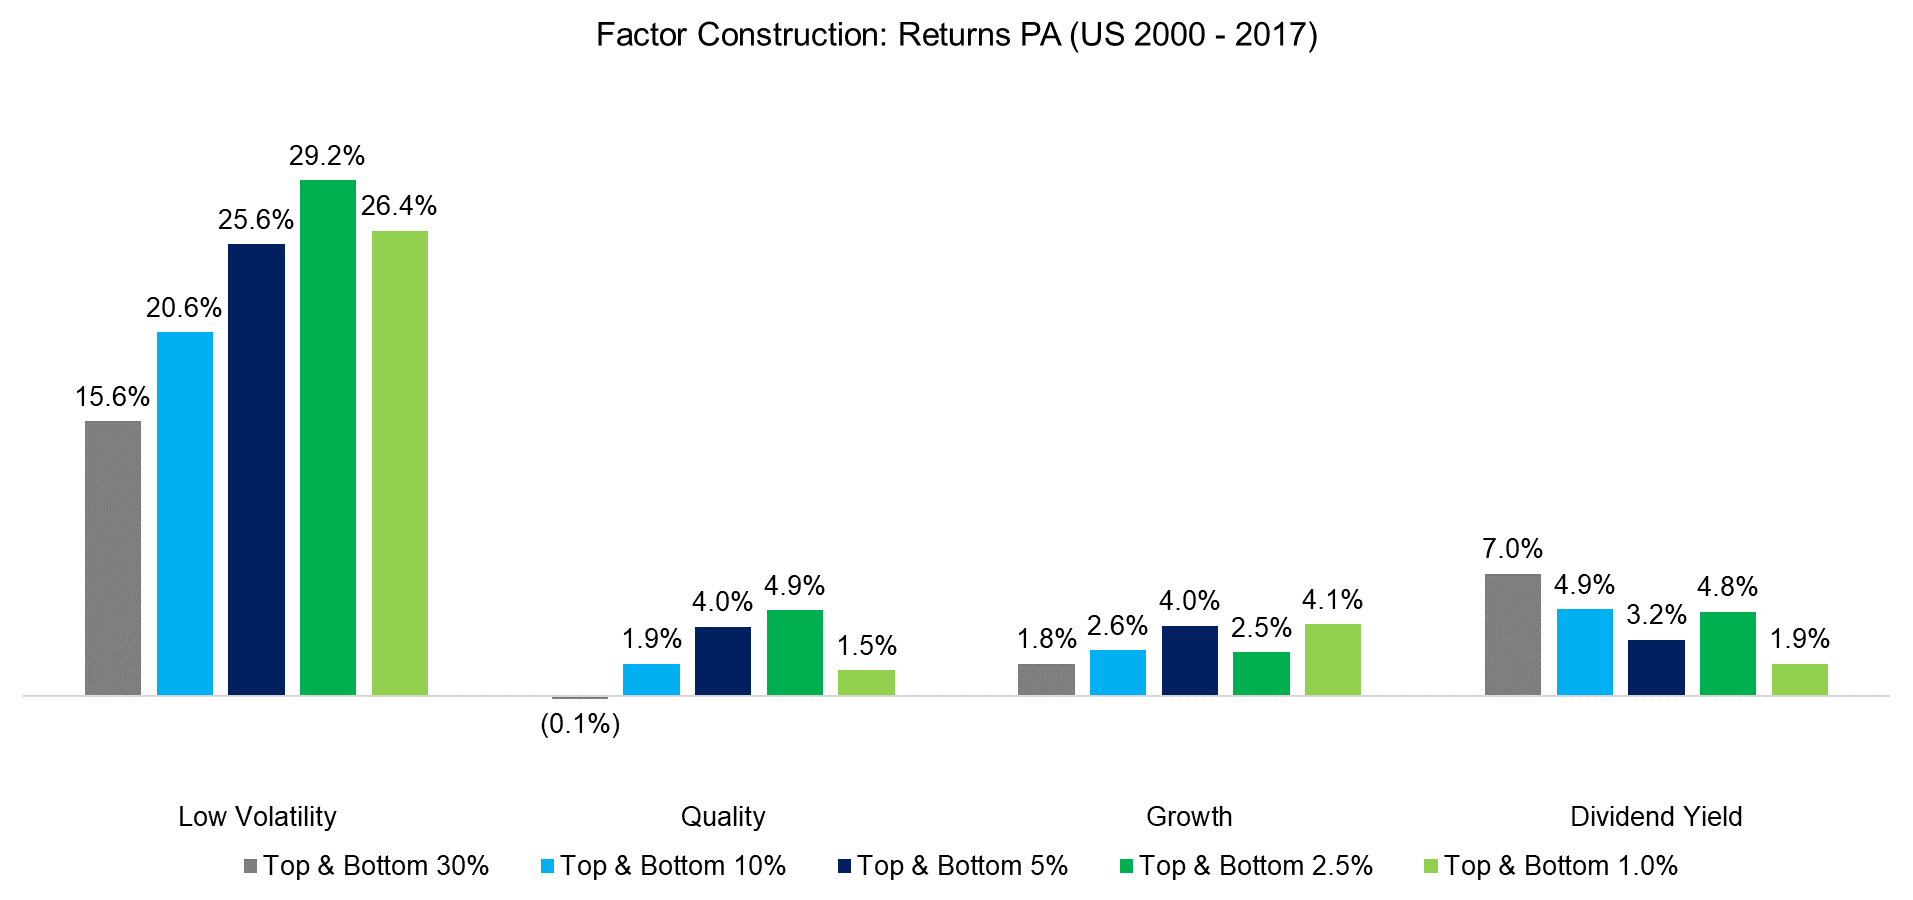
Further factors namely Low Volatility, Quality, Growth and Dividend Yield can be added to the analysis, where we can observe similar results to the previous ones. The returns per annum increase or decrease monotonously, depending if the factor performance was positive or negative over the period, from the 30% to 5% portfolios, but become more volatile thereafter.
Source: FactorResearch
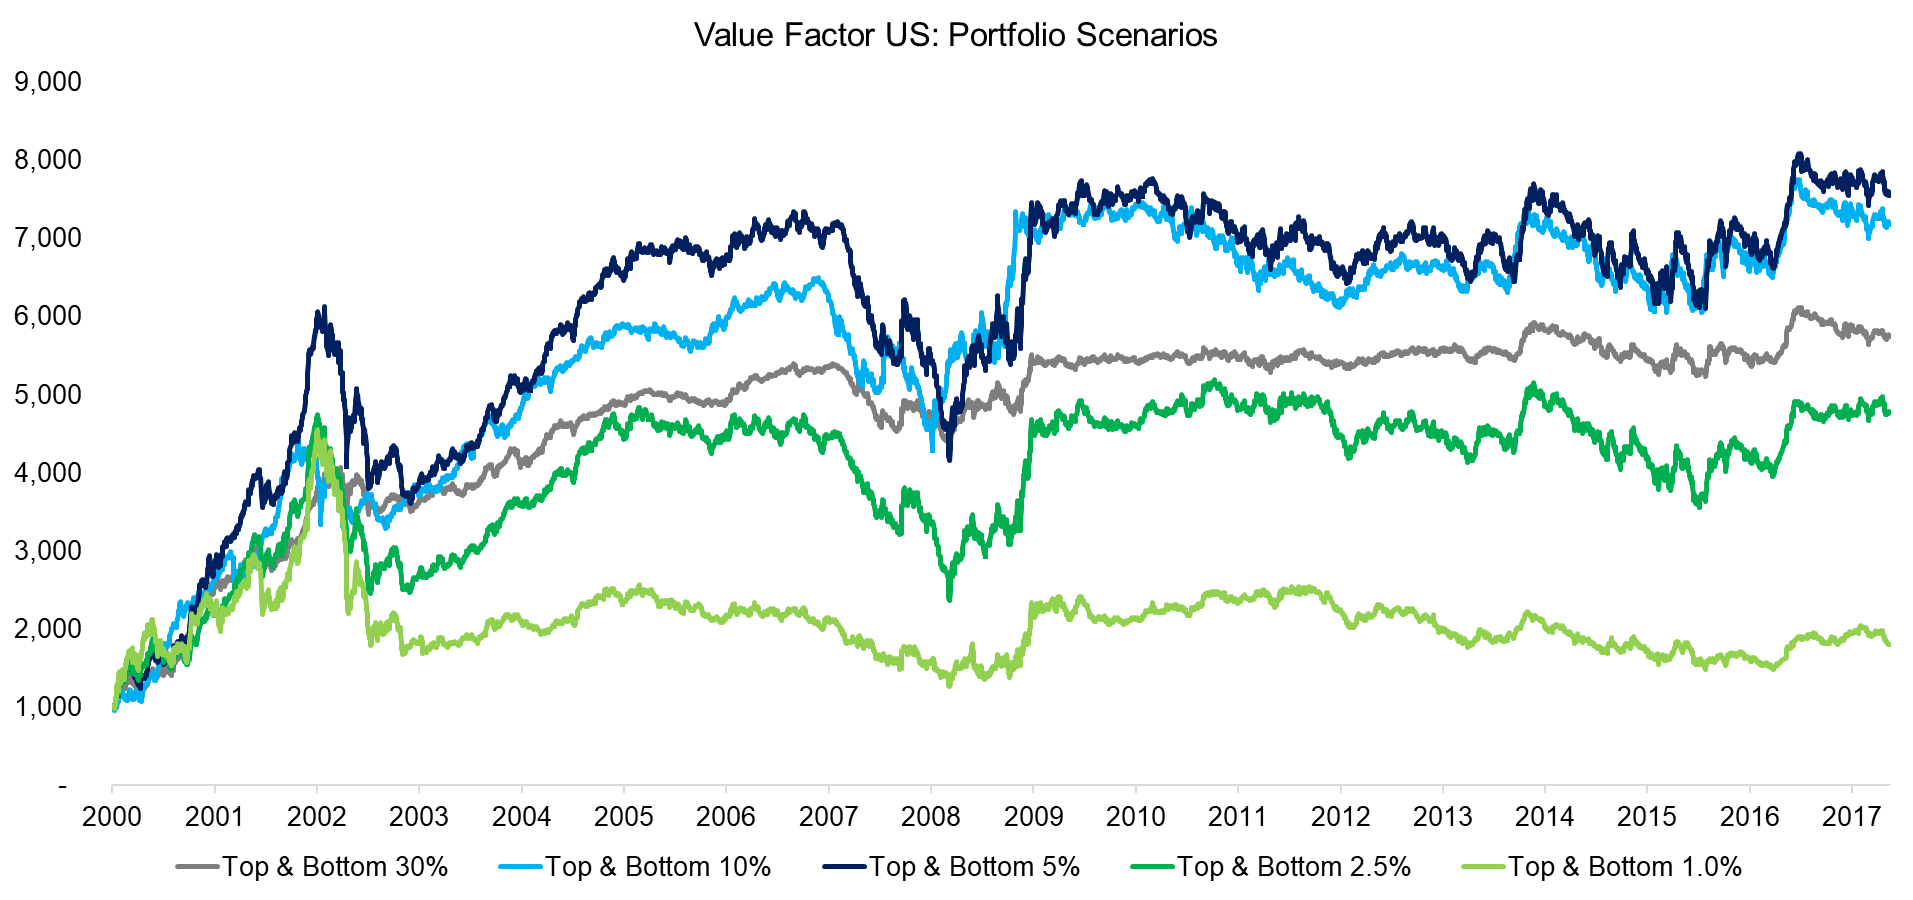
Decreasing the number of stocks in the portfolios results in general in higher volatility as the portfolio becomes more extreme in terms of factor exposure. However, at some point, there will be too few stocks for the portfolio to be diversified sufficiently and single stock risks will start dominating. The chart below shows the Value factor in the US where we can see higher factor volatility and larger drawdowns for the more extreme portfolios, i.e. 1% to 5% portfolios, than for the 30% and 10%.
Source: FactorResearch
FURTHER THOUGHTS
This short research note highlights that factor portfolios can be created with fewer stocks than typically seen in academic research, albeit with the consequence of having higher volatility and larger drawdowns. However, at some point firm risks will start influencing factor returns, which we could already observe for portfolios containing 40 stocks on the long and 40 stocks on the short side. Most investors are likely better off buying factor products, either smart beta or long-short products, than building factor portfolios themselves.
ABOUT THE AUTHOR
Nicolas Rabener is the CEO & Founder of Finominal, which empowers professional investors with data, technology, and research insights to improve their investment outcomes. Previously he created Jackdaw Capital, an award-winning quantitative hedge fund. Before that Nicolas worked at GIC and Citigroup in London and New York. Nicolas holds a Master of Finance from HHL Leipzig Graduate School of Management, is a CAIA charter holder, and enjoys endurance sports (Ironman & 100km Ultramarathon).
Connect with me on LinkedIn or X.

