Factors: Correlation Check
Watch Out for High Correlations?
September 2017. Reading Time: 10 Minutes. Author: Nicolas Rabener.
SUMMARY
- Correlations between Quality and Growth factors are currently elevated
- Value is more negatively correlated than usual to Quality, Growth and Low Volatility
- Monitoring correlations is important for maximising diversification benefits
INTRODUCTION
The rise of ETFs is often associated with higher stock correlations, which are not desirable from a fund manager’s perspective as they make alpha generation more challenging. However, despite the passive money management industry having significant inflows in 2017 and the market share reaching an all-time high, stock correlations are at multi-year lows. In factor investing correlations play a large role in the factor allocation process and it’s interesting to see if low stock correlations reflect in low factor correlations. In this short research note we will analyse current and historical factor correlations and the impact on portfolio construction (read Smart Beta vs Factors in Portfolio Construction).
METHODOLOGY
We’re going to focus on the six well-known factors: Value, Size, Momentum, Low Volatility, Quality and Growth and the global time series, which aggregates the factor performance of Asia, Europe, and the US. The factors are constructed as beta-neutral long-short portfolios by taking the top and bottom 10% of the stock universes in the US, Europe and Japan and 20% for markets with smaller stock universes. Only companies with a minimum market capitalization of $1bn are considered and 10bps of transaction costs are included.
CURRENT FACTOR CORRELATIONS
The matrix below shows the correlations for the factors over the last year. We highlighted any correlations larger than 0.5 in red and any smaller than -0.5 in green. We can observe that only the Quality and Growth factors are highly correlated and that Value shows strong negative correlations with Momentum, Quality, and Growth. High correlations are less desirable for portfolio construction as the diversification benefits are lower than with low or negative correlations.

Source: FactorResearch
HISTORICAL FACTOR CORRELATIONS
Some factor correlations may be structural, e.g. Growth and Value tend to be negatively correlated as cheap stocks usually show low or negative revenue or earnings growth while growth stocks are typically expensive, therefore it’s interesting to contrast the current to historical correlations. The matrix below shows the factor correlations over the last 15 years and we can observe similar relationships between the factors, e.g. Quality and Growth are positively correlated, as in the current snapshot, although at lower levels.

Source: FactorResearch
QUALITY PORTFOLIO SCENARIOS
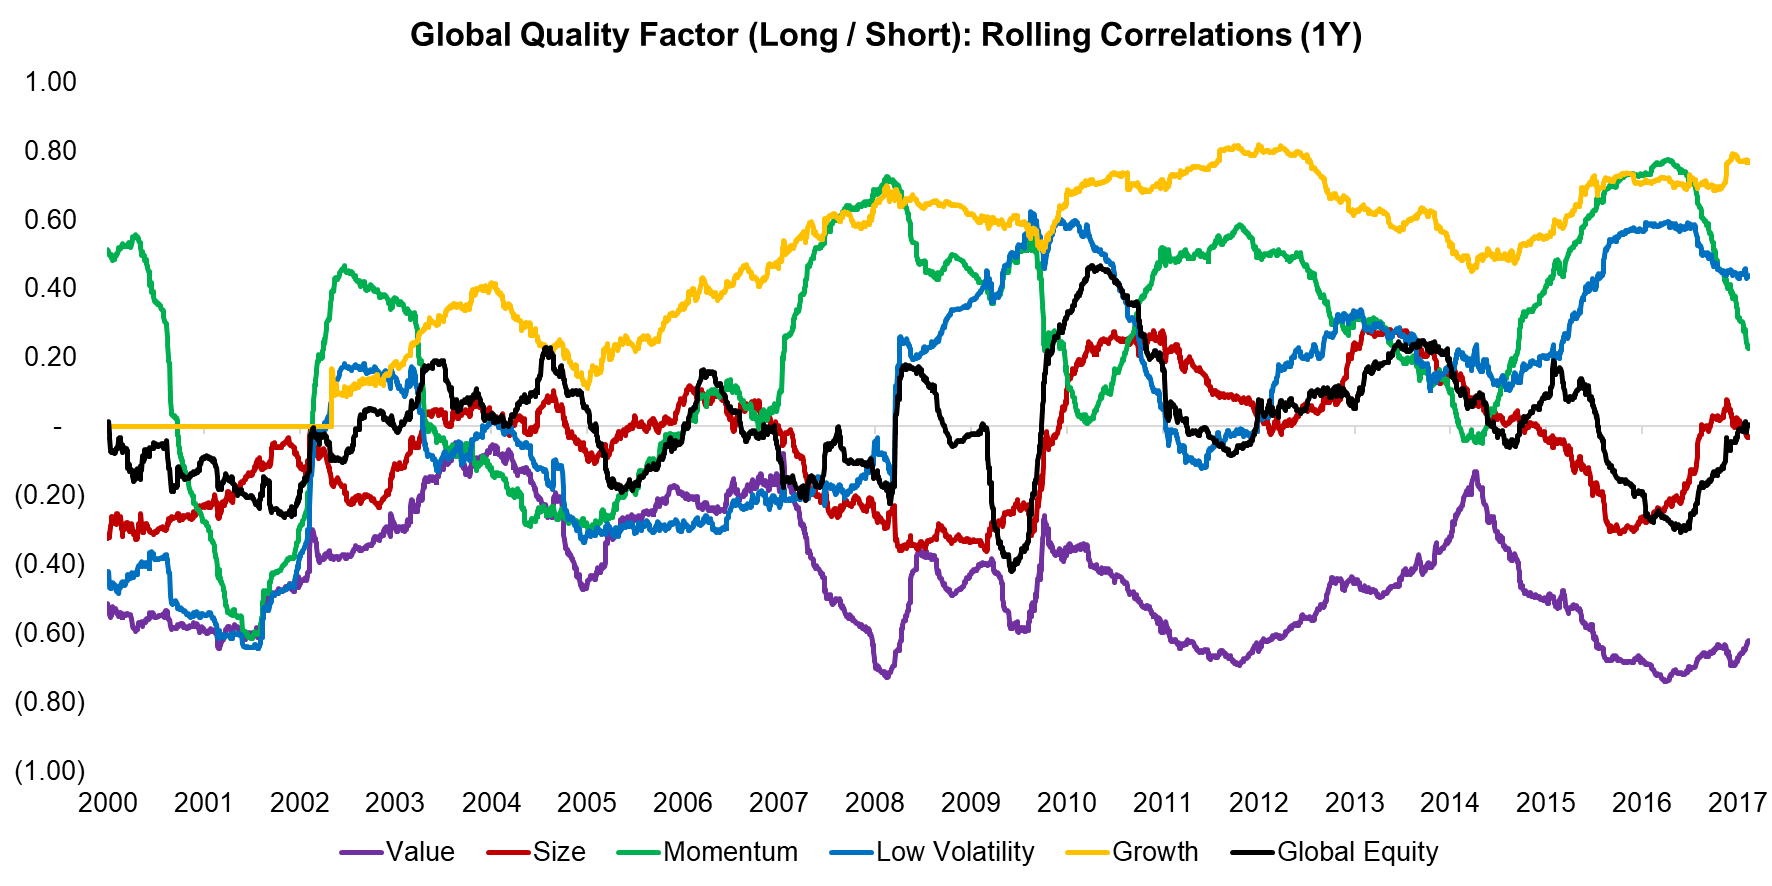
We will focus on the Quality factor with regards to portfolio scenarios as it currently exhibits high correlations with Growth, which may represent risk for a factor portfolio. It’s interesting to look at the historical correlations of all factors with Quality over time, which we can see below. The correlation with Growth has been high since 2008 and the correlations with Momentum and Low Volatility were also often elevated. Value has shown strong negative correlations over the last few years while the correlation with Size was zero on average. The correlation with Global Equity, which represents a long-only index, is zero on average and is to be expected given that the Quality factor is constructed via a long-short portfolio.

Source: FactorResearch
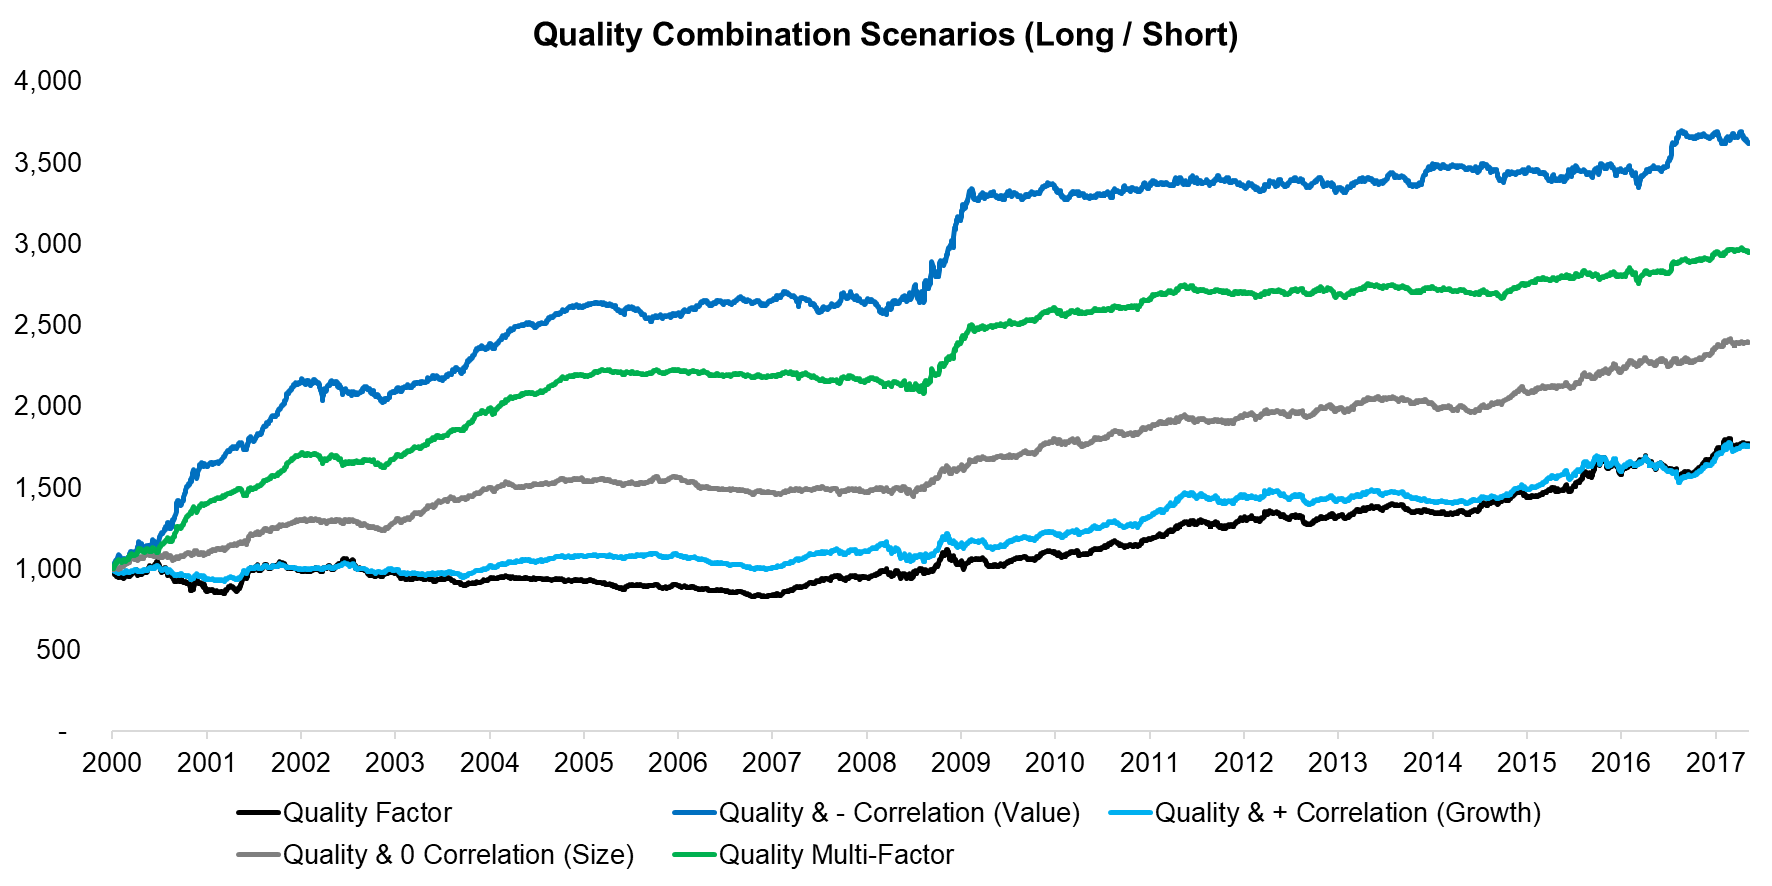
Given that we identified Quality and Growth having highly positive correlations we will investigate the impact of adding factors with positive, negative, and zero correlations to a Quality factor portfolio. In the chart below we can observe that adding Value (negative correlation) or Size (zero correlation) improves the returns more than adding Growth (positive correlation). However, it’s worth highlighting that although correlations matter, the performance of the factors naturally also play a role, e.g. Value generated higher returns since 2000 than Quality on a stand-alone basis, so the higher returns of the combination portfolios are not surprising.

Source: FactorResearch
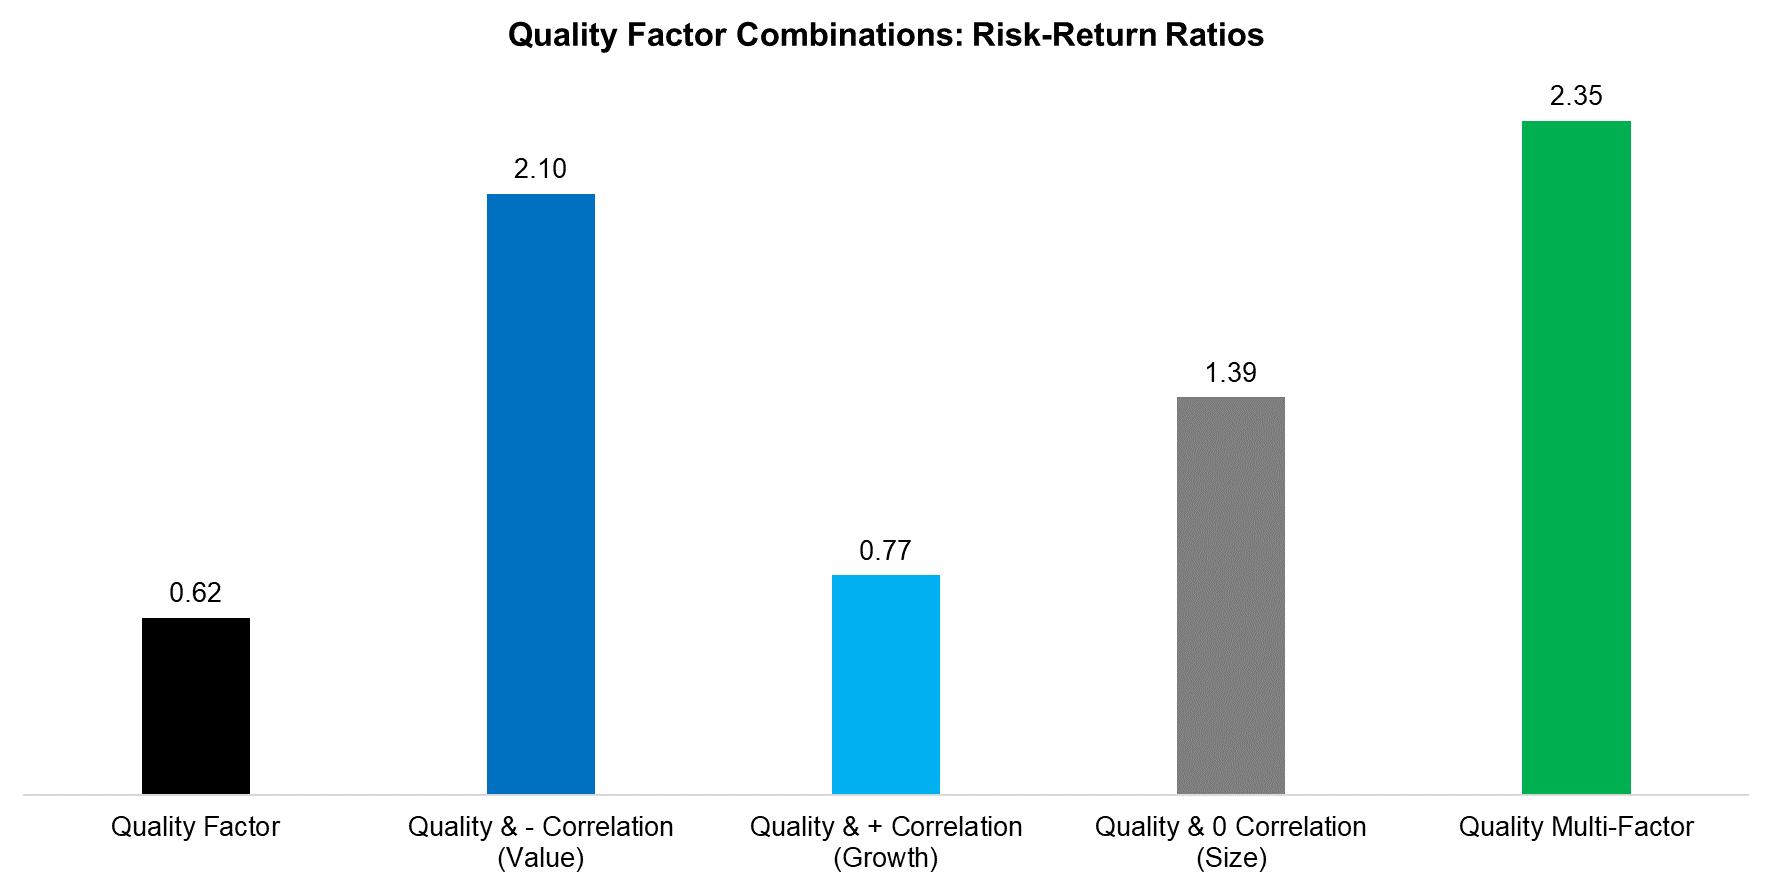
Looking at the risk-return ratios we can observe that the Quality factor portfolio improves marginally by adding Growth (positive correlation), but significantly by adding Size (zero correlation) and Value (negative correlation). The multi-factor portfolio, which is a portfolio that equally weights all four factors and rebalances annually, achieves the highest risk-return ratio.

Source: FactorResearch
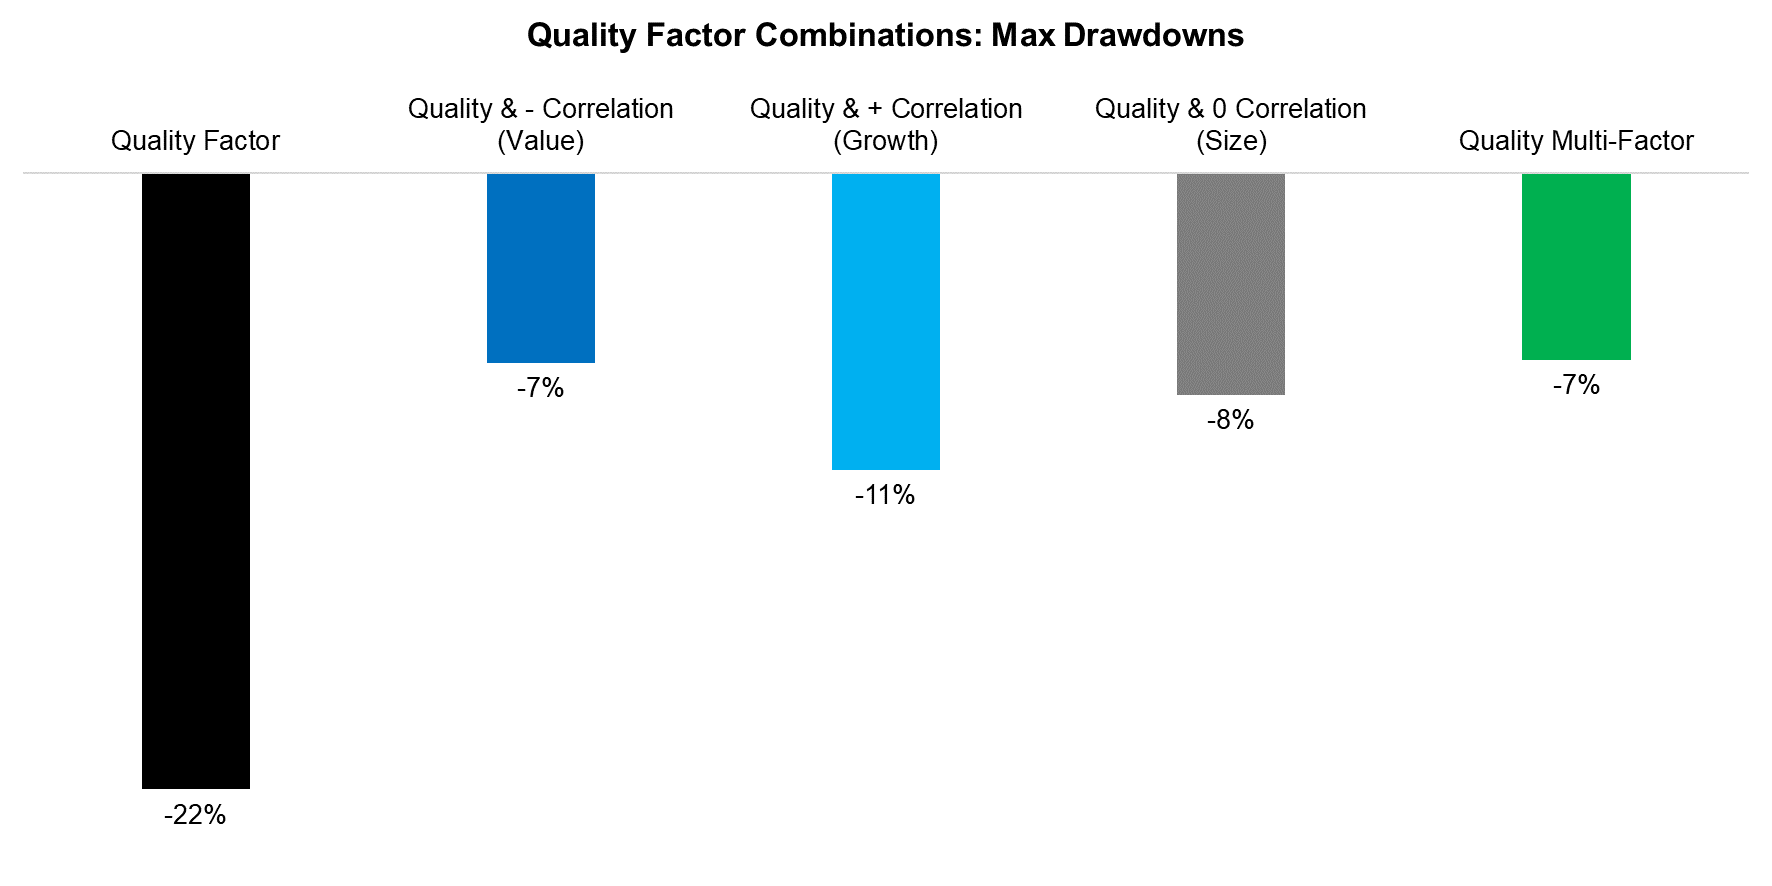
The drawdowns are reduced significantly by adding any factor, highlighting the benefits of diversifying across factors, even if they’re positively correlated. The lowest drawdowns are achieved by adding Value to Quality or via the multi-factor approach.

Source: FactorResearch
FURTHER THOUGHTS
This short research note contrasts current to historical factor correlations and highlights that Quality and Growth are currently highly correlated. However, even adding Growth stocks to a Quality portfolio improves the risk-return ratio and reduces the drawdown, highlighting diversification benefits. Naturally adding factors with zero or negative correlations will likely achieve even better results (read Smart Beta & Factor Correlations to the S&P 500).
ABOUT THE AUTHOR
Nicolas Rabener is the CEO & Founder of Finominal, which empowers professional investors with data, technology, and research insights to improve their investment outcomes. Previously he created Jackdaw Capital, an award-winning quantitative hedge fund. Before that Nicolas worked at GIC and Citigroup in London and New York. Nicolas holds a Master of Finance from HHL Leipzig Graduate School of Management, is a CAIA charter holder, and enjoys endurance sports (Ironman & 100km Ultramarathon).
Connect with me on LinkedIn or X.

