Factor Crowding Model
Mob Management Measures
July 2018. Reading Time: 15 Minutes. Author: Nicolas Rabener.
SUMMARY
- Crowded factors exhibit higher drawdowns than uncrowded factors
- A multi-metric approach can be successfully applied to measure factor crowding
- Effective in reducing factor drawdowns and volatility, but less meaningful for returns
INTRODUCTION
Architects devoted to creating large public facilities like sports stadiums are tasked with finding a good balance between aesthetics, commercialism and safety. The latter mainly focuses on crowd control management as stampedes, crushes and riots can have tragic consequences. Crowds are the lifeblood of public arenas as well as one of the key risk factors.
In investing, crowds have the same characteristics as they are required to make an investment popular and drive its performance, but also represent risk if the trade is widely owned. Given the significant inflows into smart beta ETFs and risk premia strategies in recent years, a frequent investor concern is the crowding of common equity factors like value or momentum.
There are various approaches for measuring factor crowding and these can broadly be differentiated between being based on funds flows, stock ownership, short interest or market-derived indicators. The first three data sets are only available with weeks or months delay while market-derived indicators can be measured daily or even intra-day. In this white paper we introduce a factor crowding model based on market-derived indicators (read Measuring Factor Crowding via Valuations).
Monitoring factor risks is relevant for systematic investors dedicated to factor investing as well as for discretionary portfolio managers. Factor investors are naturally interested in improving the risk-return ratios of their portfolios while discretionary portfolio managers are likely inclined to reduce any systematic risks not associated with their investment thesis.
MODEL OBJECTIVES
Crowding typically refers to periods of investments like equity factors that have received significant inflows and are held by a large part of the investment community. The risk of owning a popular factor is that a sudden change in market sentiment may result in many investors simultaneously reducing their factor exposure, which might be realised via selling smart beta ETFs or portfolios of stocks, with few natural buyers left in the market. The resulting negative short-term performance typically reflects in more selling, creating a negative feedback loop and potentially a significant drawdown. Crowded factors are therefore characterized by experiencing more frequent drawdowns in subsequent periods than uncrowded factors. The objective of the factor crowding model is to identify when factors are crowded, neutral or uncrowded.
THOUGHTS ON CROWDING
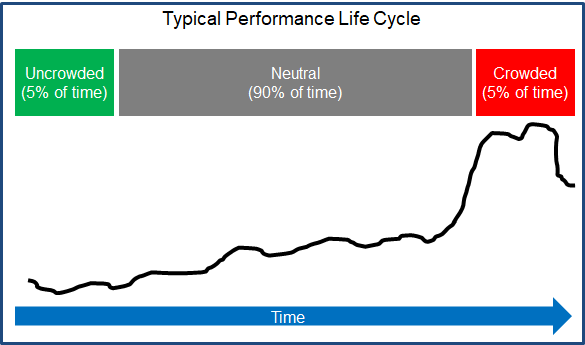
Crowding is not negative per se as every investment requires capital inflows to generate positive performance. It is only during certain periods of too much interest where factors can be considered crowded and inversely uncrowded when there has been too little interest. The graphic below highlights a typical performance life cycle of an investment.

Source: FactorResearch
It is worth highlighting that factors can experience significant drawdowns without being crowded, e.g. the long-short value factor lost more than 50% during the Tech bubble in 2000 as investors exhibited a strong preference for technology stocks at absurdly high multiples over cheaply priced companies, but the factor was not crowded prior to that.
METHODOLOGY
We focus on measuring the degree of crowding for seven factors namely value, size, momentum, low volatility, quality, growth and dividend yield in the US stock market. The factor definitions are in line with industry standards and the factors are constructed as beta-neutral long-short portfolios by taking the top and bottom 10% of the stock universe. Only stocks with market capitalisations larger than $1 billion are considered. Portfolios are rebalanced monthly and 10 basis points of costs per transaction are included. The analysis covers the period from 1992 to 2018.
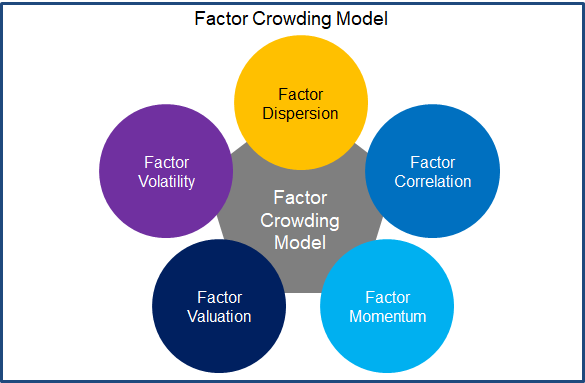
The factor crowding model is based on measuring five metrics: volatility, dispersion, correlation, momentum and valuations. Each metric is calculated for each factor on a daily basis, which are then normalised and combined in a multi-metric score by equally weighting them. The graphic below summarises the components of the factor crowding model.

Source: FactorResearch
We will demonstrate the effectiveness of each metric as well as of the multi-metric score in the remaining paper by highlighting that high factor crowding scores are associated with a higher probability of drawdowns in the subsequent period than low factor crowding scores.
It is important to note that the individual components of the factor crowding model have different characteristics and some are less effective than others on a stand-alone basis. However, the single metrics complement each other and lead to a highly effective score in the multi-metric factor crowding model.
FACTOR DISPERSION
Factor dispersion measures how similar individual stocks of factor portfolios are trading on a daily basis. We measure the dispersion of the stocks in the long and short portfolios of the factor after accounting for the market beta and then average the time series. A high degree of residual factor dispersion typically indicates a significant change in the factor portfolio, which may be caused sudden in- or outflows, and more likely indicates a crowded than an uncrowded factor.
The chart below shows the probability of experiencing a drawdown of 15% or larger over multiple time frames on a going forward basis from the date of measuring the degree of factor crowding. The results are calculated as the average frequencies of drawdowns across the seven factors covering the period from 1992 to 2018.

Source: FactorResearch
We can observe that the metric measures factor crowding effectively as drawdowns occur consistently more frequently with crowded than uncrowded factors. It is worth noting that factors are neutral approximately 90% of the time and therefore are only rarely crowded or uncrowded.
FACTOR VOLATILITY
Factor volatility can be explained by market volatility in general, but there are certain periods where these deviate. The residual factor volatility, which is defined as factor volatility in excess of market volatility, is caused by abnormal trading of the stocks in the factor portfolio. High residual factor volatility would be considered as a sign of crowding while low residual factor volatility would indicate an uncrowded factor. The chart below shows the drawdown probabilities and the metric identifies factor crowding across the different time periods (read Market & Factor Volatility).

Source: FactorResearch
FACTOR CORRELATION
Factor correlation is derived from calculating the pairwise correlations of the stocks in the long and short portfolio, after adjusting for the market beta. The correlations of the long and short portfolio are then averaged. The pairwise correlation is commonly used for measuring factor crowding as high correlations reflect that the stocks in the long and short portfolios exhibit strong relationships, which is likely caused by in- or outflows and common stock ownership.
The chart below shows that this metric is less effective for identifying factor crowding on a stand-alone basis, but is highly accretive to the multi-metric factor crowding model, which warrants its inclusion.

Source: FactorResearch
FACTOR MOMENTUM
A factor that generated strong returns will attract more inflows than a poorly performing factor given that many investors are performance chasing. Therefore, the stronger the performance, the more likely the factor will become crowded. Factor momentum is defined as the three-year performance, which is in line with the three-year track record typically required by institutional investors, and the chart below highlights the effectiveness of the metric for measuring factor crowding.

Source: FactorResearch
FACTOR VALUATION
Factors can be valued like stocks by determining their fundamental valuation multiples. The metric is calculated by measuring the ratio of the price-to-book multiple of the long portfolio divided by the price-to-book multiple of the short portfolio. The smaller the ratio, the higher the difference in multiples and the cheaper the factor is from a fundamental valuation perspective. Cheap factors are likely less crowded than expensive factors.
Similar to factor correlation this metric is less effective for identifying factor crowding on a stand-alone basis, but adds value to the multi-metric model.

Source: FactorResearch
MULTI-METRIC FACTOR CROWDING MODEL
The five metrics are standardised and combined into a multi-metric score by equally weighting them. The calculation of the standardised score utilises a 10-year lookback in order to capture a full market cycle with different market regimes.
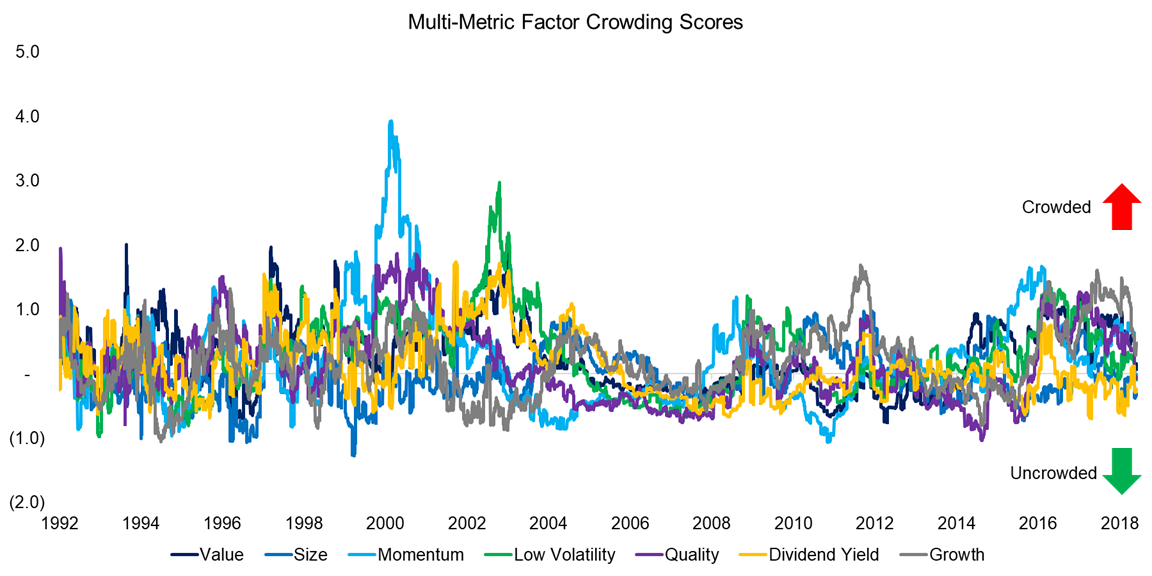
The chart below displays the multi-metric crowding scores for the seven equity factors from 1992 to 2018. Positive scores indicate crowding while negative scores suggest uncrowded factors. We can observe that in the first decade of the analysis the crowding scores exhibited significantly higher volatility, which can be explained by a different market structure, e.g. decimalisation became mandatory for US equities in 2001, which led to tighter trading spreads thereafter.

Source: FactorResearch
Combining the single metrics creates a highly effective crowding score as highlighted by the summary chart below. The probability of drawdowns increases linearly from uncrowded to crowded across all periods. It is to be expected that the crowding score is more meaningful for shorter than longer time periods given natural information decay.

Source: FactorResearch
In addition to the drawdown probabilities we can also analyse the expected factor volatility in the same framework. The chart below highlights that expected volatility is highest for crowded and lowest for uncrowded factors.

Source: FactorResearch
The analysis so far has focused on factor risks, but ignored returns. Investors applying a value-perspective might expect that uncrowded factors generate the highest returns while crowded factors yield the lowest returns.
However, our research indicates a more complicated relationship between crowding and expected returns. Crowded factors often continue to follow their long-term trend after experiencing a drawdown while uncrowded factors typically generate lower returns, albeit with low volatility, as investor interest in required for positive performance.
The chart below highlights the risk-return ratios and we can observe that crowded factors exhibit the lowest ratios over time, which is partially explained by higher volatility. After 12-months all ratios are approximately comparable.

Source: FactorResearch
The factor crowding model therefore is most useful for factor risk management as the model is highly effective in identifying factor risk, which can be expected given that three out of the five metrics measure risk directly or indirectly. Academic research supports that stock volatility exhibits short-term auto-correlation, i.e. clusters, while this does not apply to returns.
The optimal implementation period for the factor crowding scores is from zero to six months given natural information decay. Naturally the crowding scores are generated daily and therefore allow a continuous monitoring and updating of expected factor risks.
CONCLUSION
This white paper introduces a factor crowding model based on five metrics that are available on a daily or even intra-day basis. The model can be implemented by systematic investors aiming to improve the risk-return ratios of factor portfolios as well as by discretionary portfolio managers interested in avoiding systematic factor risks.
The model shows strong characteristics in assessing factor crowding as measured by the probability of drawdowns across different time periods. An investor can expect a drawdown of 15% or larger over the next six months with a 18% probability for a crowded factor compared to a 1% probability for an uncrowded factor.
The optimal implementation window based on minimal information decay is up to six months, which implies a moderate amount of turnover and further adds to the attractiveness of the model.
FURTHER THOUGHTS
The factor crowding model empowers investors to anticipate and consider reducing expected factor drawdowns, but is less relevant for future returns. Investors not concerned with volatility and drawdowns could therefore choose to ignore factor crowding; however, a buy-and-hold strategy is much more challenging to execute than to contemplate theoretically. Factors are as cyclical as equity markets and the maximum drawdowns reached between 1992 and 2018 are significantly larger than 15%. Risk management matters.
APPENDIX
The analysis covers the period from 1992 to 2018 and aggregates data over the entire period, which comprises model risk as the market structure has changed since then, e.g. stock trading is currently dominated by high frequency trading firms, which were far less prevalent before 2005.
The charts below show the drawdown probabilities for three separate decades and confirm the effectiveness of the factor crowding model in identifying crowded and uncrowded factors.


ABOUT THE AUTHOR
Nicolas Rabener is the CEO & Founder of Finominal, which empowers professional investors with data, technology, and research insights to improve their investment outcomes. Previously he created Jackdaw Capital, an award-winning quantitative hedge fund. Before that Nicolas worked at GIC and Citigroup in London and New York. Nicolas holds a Master of Finance from HHL Leipzig Graduate School of Management, is a CAIA charter holder, and enjoys endurance sports (Ironman & 100km Ultramarathon).
Connect with me on LinkedIn or X.

