Factor Exposure Analysis 101: Linear vs Lasso Regression
Testing the effectiveness and sensitivity of linear regressions
October 2020. Reading Time: 10 Minutes. Author: Nicolas Rabener.
SUMMARY
- Linear regression is widely used for factor exposure analysis
- However, a high R2 and low p-value can be misleading
- Unsurprisingly the data quality matters
INTRODUCTION
Some fields of science like math or statistics seem to be too dry to be joking about, but a quick Google search for jokes on statisticians reveals that even this area is a fertile ground for humor. Sample these for a quick laugh:
- A statistician is a person whose life-time ambition is to be wrong 5% of the time.
- I asked a statistician for her phone number… and she gave me an estimate.
- Regression is a powerful tool for forecasting. Economists using it successfully predicted ten out of the last two recessions.
Thinking about the approximately 27,000 statisticians working in the US today throws up some odd questions. At what age did they decide to pursue this career path? What is at university where the professor of statistics whispered that by choosing his subject they would never have to be right about anything ever again?
Regardless of how these people ended up in their jobs, we should be thankful for them. Especially finance would be a lot less exciting without frequent reports about GDP growth, the unemployment rate, and revisions to GDP growth and the unemployment rate.
Without statistics, it would also be challenging for investors to analyze their portfolios and determine what they are actually holding. Naturally, investors know what stocks they bought and are frequently able to explain in excruciating detail what the company is doing, but that often fails to satisfy clients and risk managers who want risk reports and factor exposure analysis.
Despite a significant increase in the use of machine learning and artificial intelligence in finance, simple regression analysis is still the most used tool for portfolio analysis. We are not the first ones to point this anachronism. For instance, Marcos Lopez de Prado has pointed repeatedly the reliance of financial analysis on techniques developed over two hundred years ago. In this short research note, we will explore the nuances and challenges of regression-based factor exposure analysis (read Quant Strategies: Theory vs Reality).
TESTING THE SENSITIVITY OF REGRESSION ANALYSIS
We are going to analyze the factor exposure of seven portfolios that consist of asset allocation funds, commodity funds, emerging market equity funds, international equity funds, smart beta value funds, US bond funds, and US stocks. Each portfolio is comprised of five equal-weighted constituents, which leads diversified baskets in all cases, except for US stocks as that represents a highly concentrated portfolio.
Each portfolio is regressed against 20 indices, which cover equities (US, international ex-US, and emerging markets), fixed income (government, corporate, and high yield for the US, international ex-US, and emerging markets), commodities, currencies, and long-short equity as well as bond factors.
A statistician with knowledge about financial markets would likely argue that some of these indices are not orthogonal (fancy word for statistical independence), e.g. US equities is moderately correlated to international ex-US (0.6) and emerging market (0.5) equities as well as to US high yield (0.6). However, there are methodologies that specifically address this issue, which we will explore in this analysis as well.
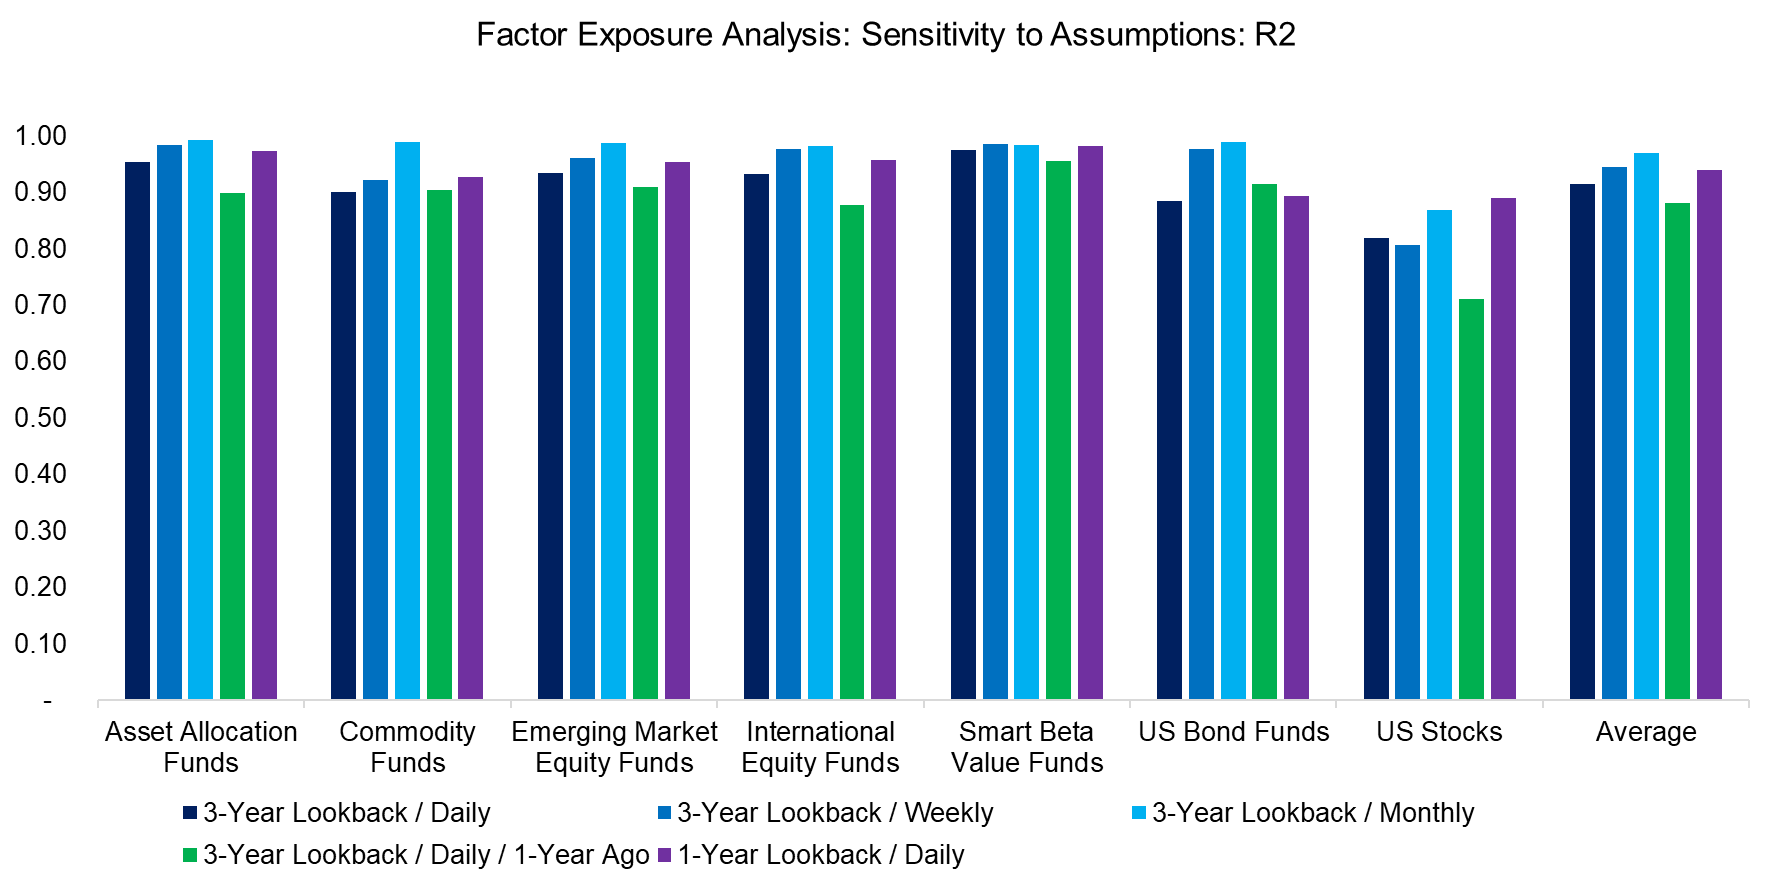
First, we investigate the sensitivity of the regression analysis by varying some key assumptions: changing the return data from daily to weekly and monthly, the lookback from three years to one year, and running the analysis a year ago. We observe that the R2 was high across almost all of the portfolios, except for US stocks. Let us remember that R2, simply put, is measures how much is the volatility in the portfolios explained by the volatility of the factors. Changing these assumptions did not influence the explanatory power of the regression to a large extent.
Source: FactorResearch
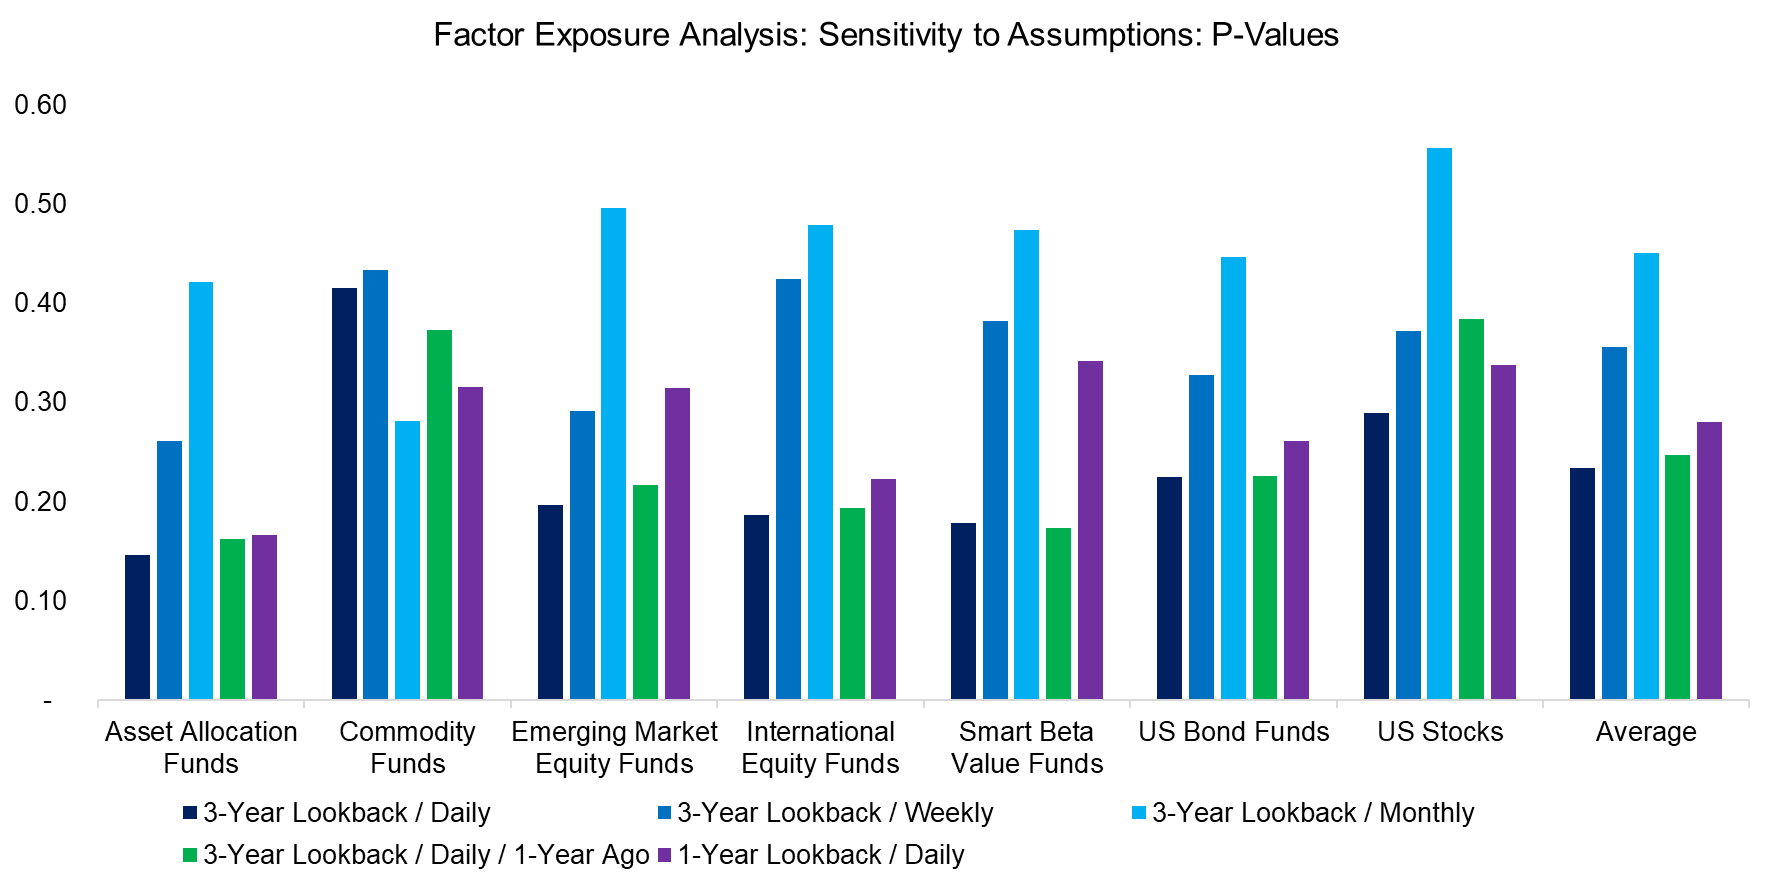
Regression analysis generates many output variables that can help an investor to decide whether the analysis was statistically meaningful. A high R2 is not particularly informative on its own, so we need to look at t-values and p-values, where these are designed to measure the probability that the observed results are due to chance and not due to a relation between the explanatory and independent variables. We focus on p-values for the seven portfolios, which shows that daily returns yielded more relevant results than weekly or monthly returns.
For the non-statisticians, the lower the p-values the better, and only values below 0.05 imply that the model is statistically meaningful, specifically that the null hypothesis can be rejected, which implies that the results are not random. Given that all p-values were above 0.05, the regression analysis of these seven portfolios was not statistically significant and should then be discarded.
Source: FactorResearch
MAXIMIZING ORTHOGONALITY
One explanation for the lack of significance might be that independent variables are not truly independent of each other. As a next step, we will explore various methodologies that partially address this issue. Most of these focus on minimizing Akaike’s information criterion (AIC), which tests how well a model fits the data without overfitting it.
Specifically, we are going to contrast the following approaches:
- 3-Year Lookback / Daily (Base Case): This represents the base case with all 20 indices as independent variables using daily return data and a three-year lookback.
- Backward: All 20 variables are used initially and then one by one is excluded to achieve a lower AIC than the base case.
- Forward: Initially there are 0 variables and one by one is added to find a lower AIC than the base case.
- Mixed: The variable selection process is initiated with the forward approach and then complemented with the backward approach, which runs in a step-wise process.
- Lasso: Focuses on the variable selection process and the regularization parameter, where alpha was set as 1e-6, in order to reduce model complexity and overfitting.
- AIC Lasso: Same as Lasso, but the regularization parameter is determined by minimizing the AIC.
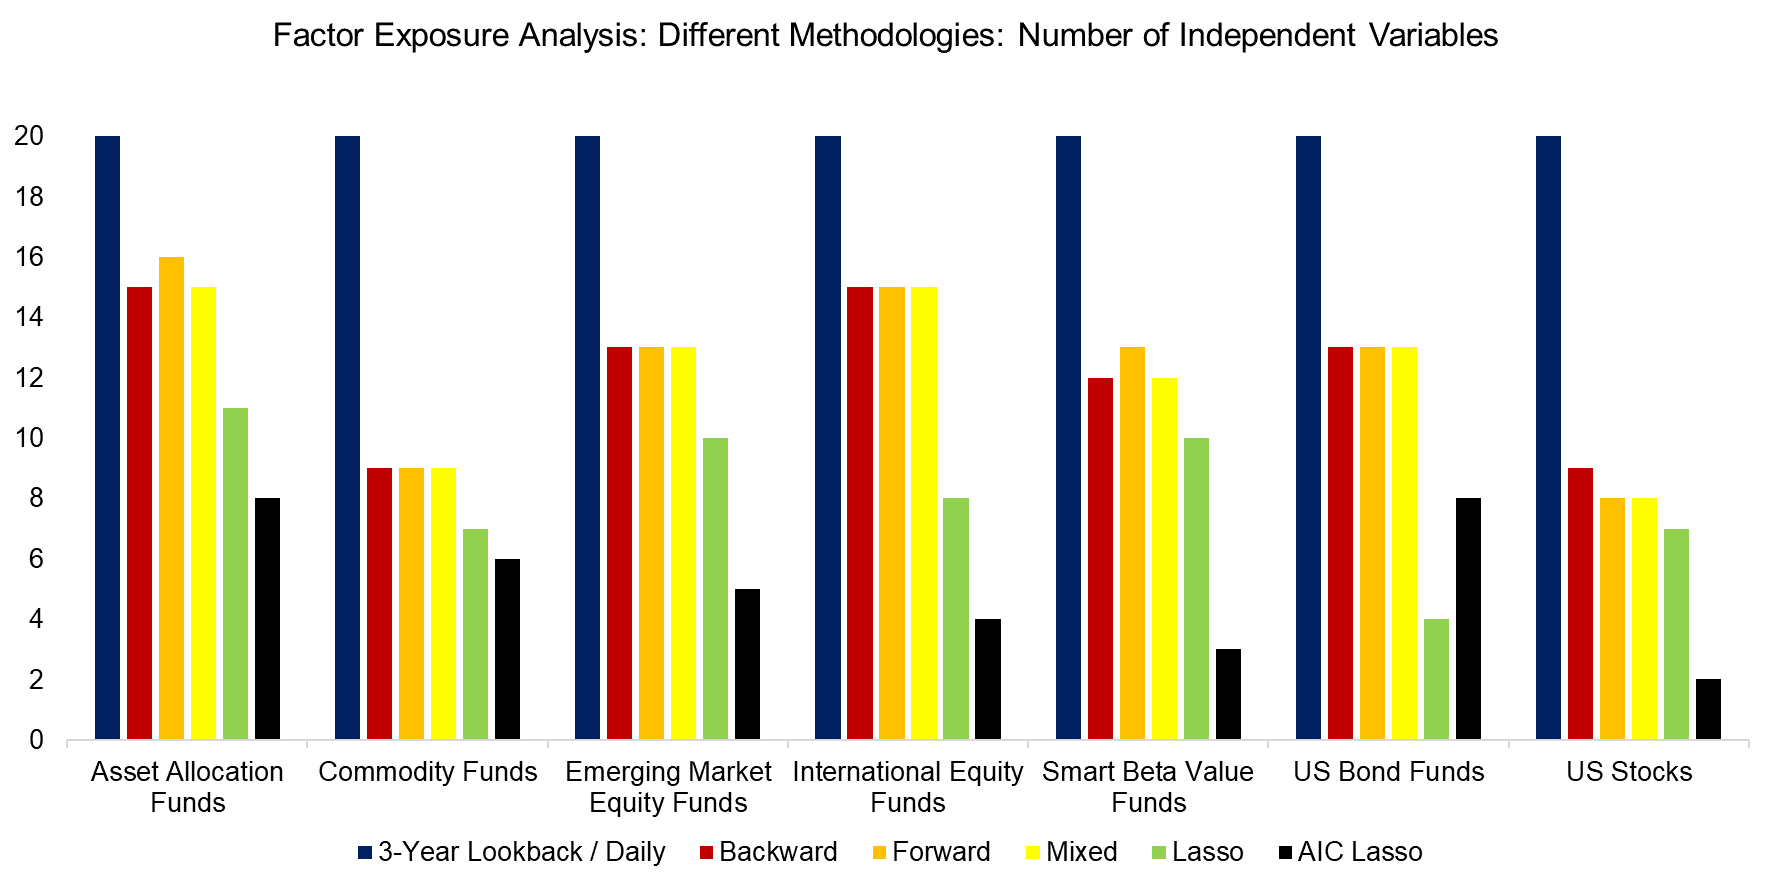
Given the focus on variable selection, it is not surprising that all of these methodologies ended up selecting far fewer than the 20 indices used in the base case. The most extreme case is using AIC Lasso for the US stock portfolio, where only two independent variables, namely US equities and the long-short equity value factor, are selected for the regression analysis. This is consistent with previous work showing that although the factor zoo is extensive, there are very few truly independent, orthogonal factors.
Source: FactorResearch
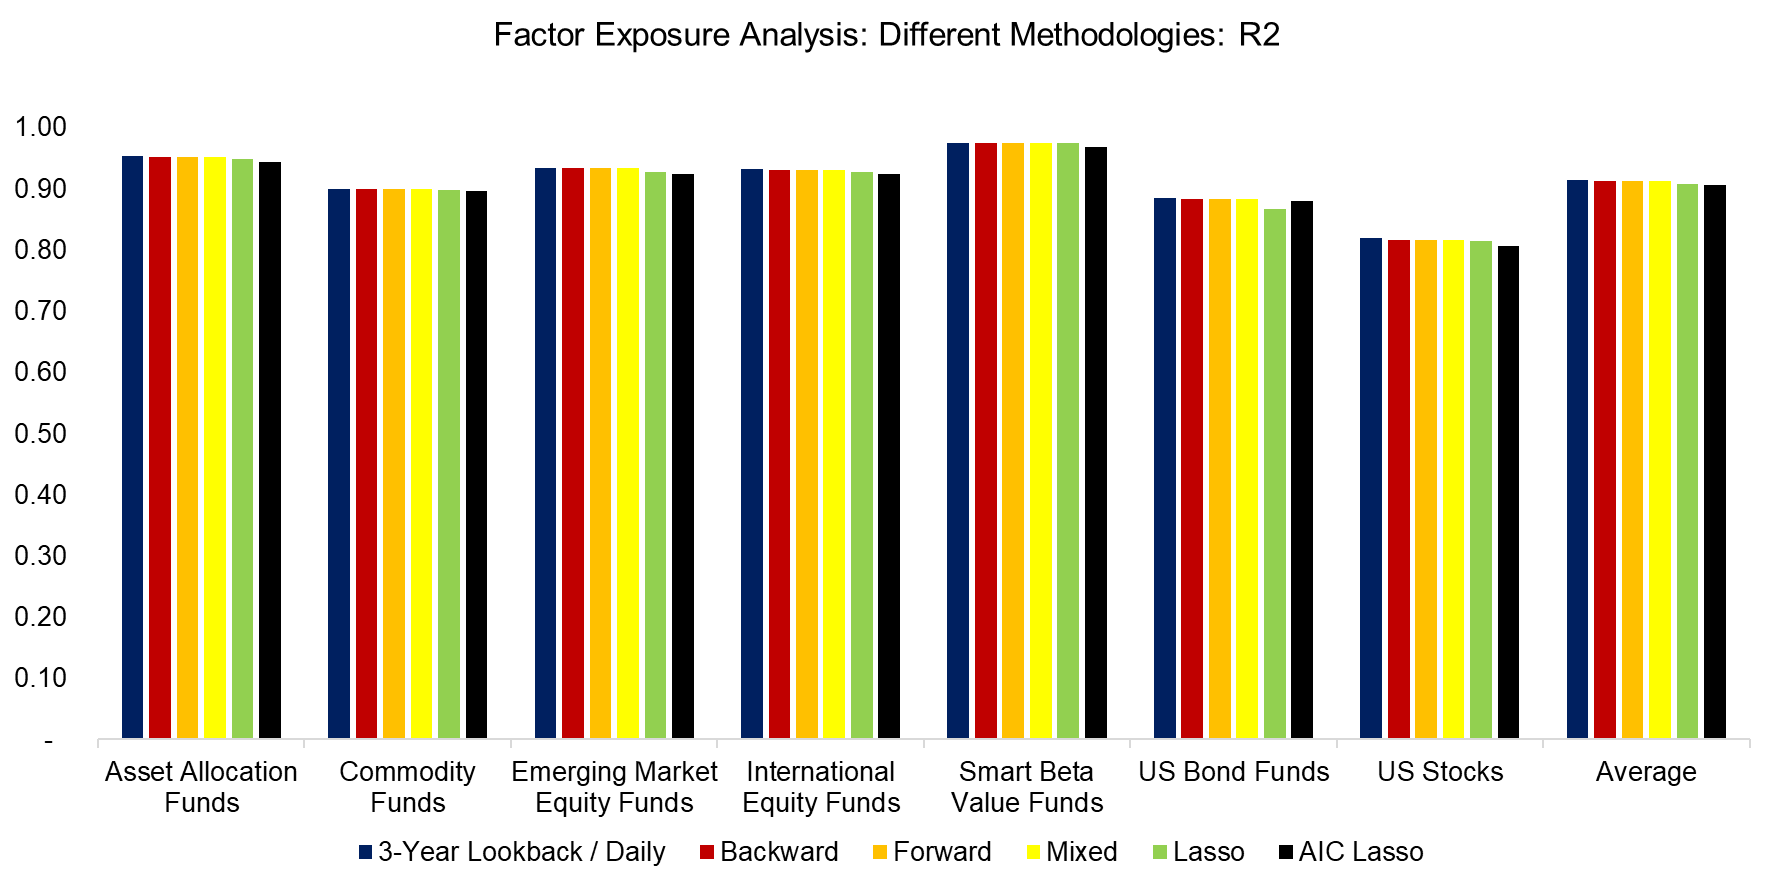
Despite the differences in the methodologies, the R2 for the seven portfolios were almost identical. Given more sophistication, investors might have expected an increase in explanatory power. Based on these results, it would be difficult to make the case for either of these methodologies.
Source: FactorResearch
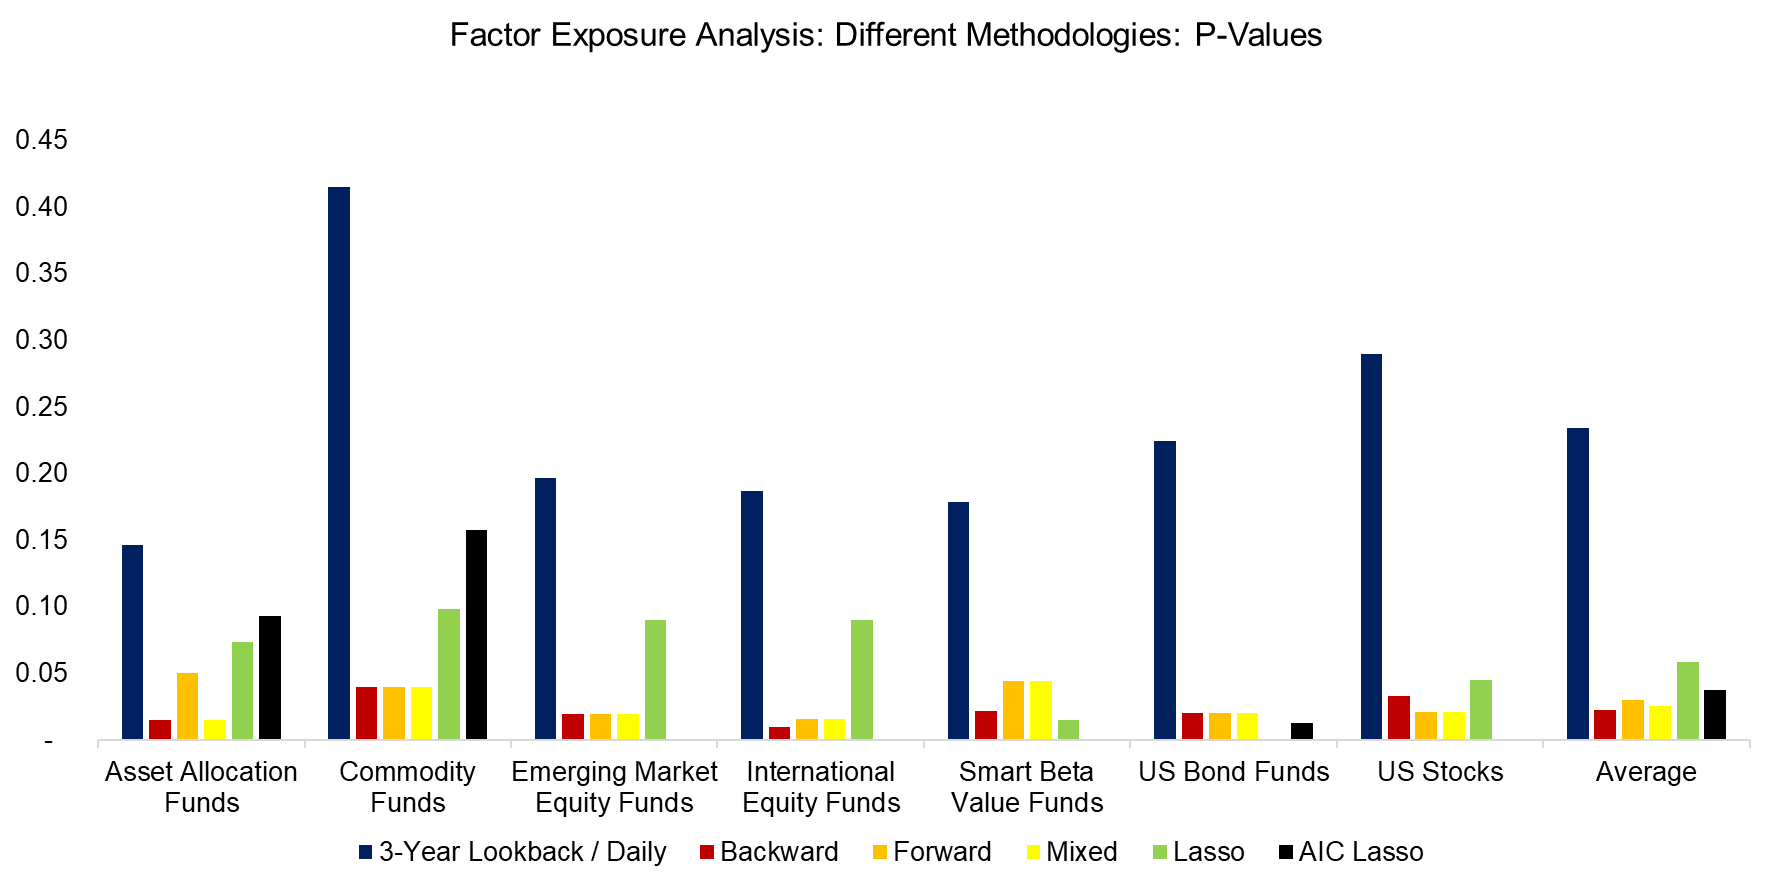
However, although the R2 were largely the same for the different approaches, there was a significant (no pun intended) improvement in the p-values. Compared to the base case, all other methodologies generated statistically meaningful results on average. Although the backward, forward, and mixed approaches featured the lowest p-values on average, the AIC Lasso regression was superior, if not for relatively high p-values in the asset allocation and commodity portfolios.
Source: FactorResearch
BENCHMARKING THEORY TO REALITY
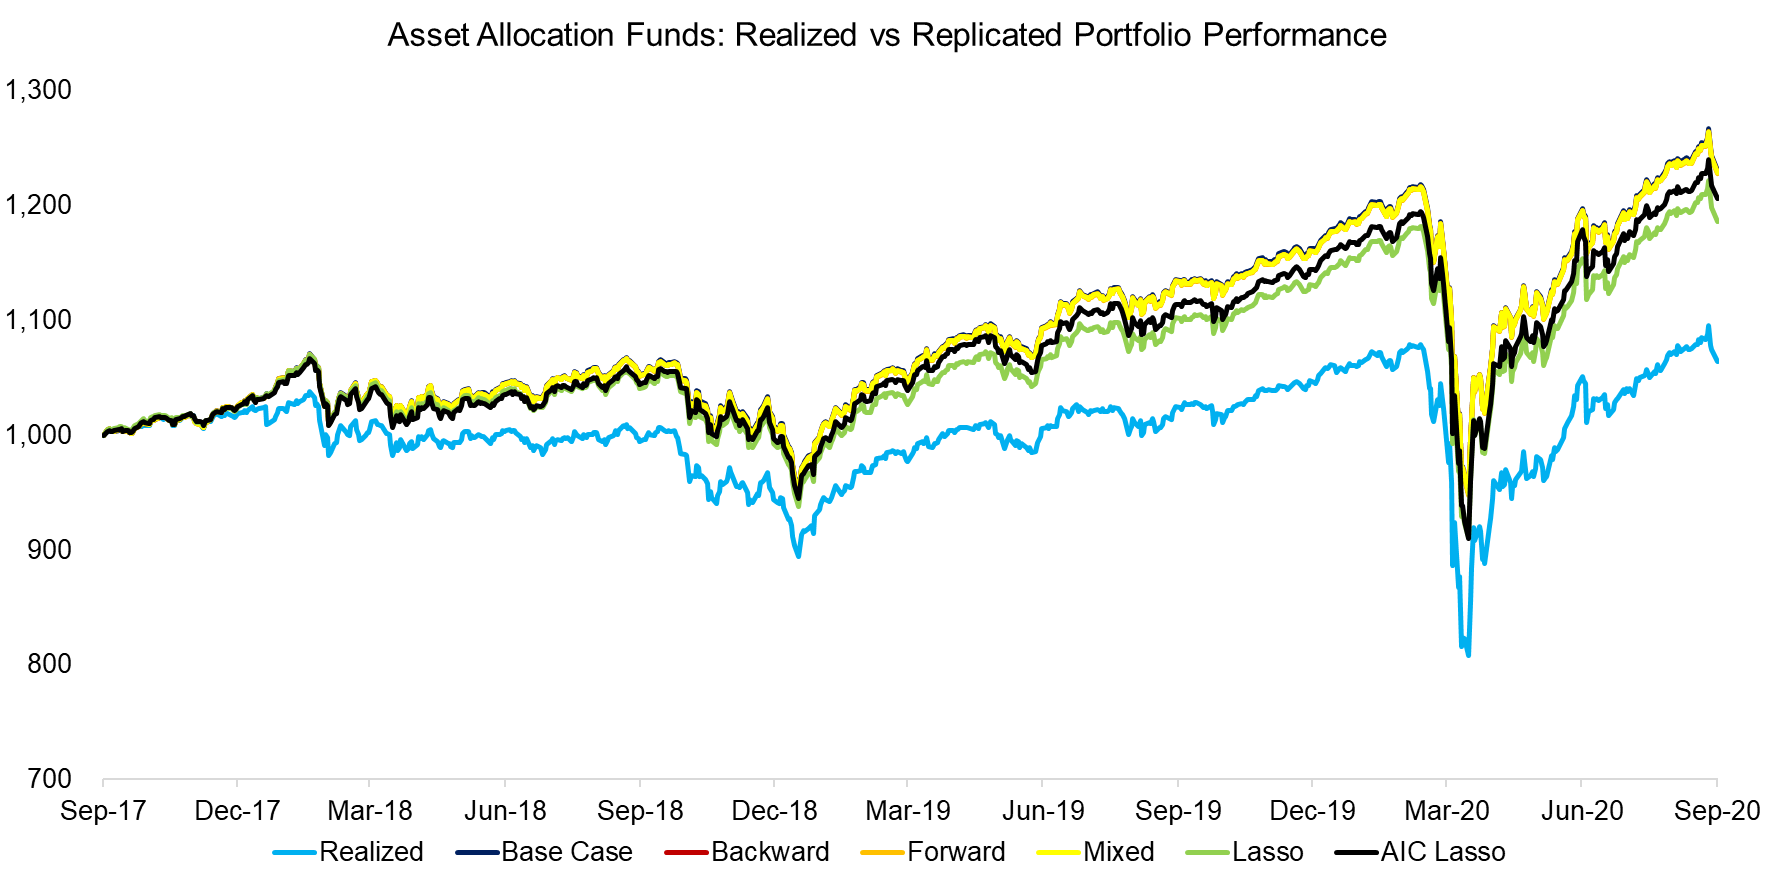
A high R2 and p-value below 0.05 indicate that the model has high explanatory power and is statistically significant. However, this does not necessarily mean that the model is able to replicate the historical performance particularly well. We can test this by comparing the realized returns of a portfolio to the returns from the theoretical portfolios, which are created as factor-mimicking replication portfolios based on the regression data.
We observe a large discrepancy between the real and theoretical portfolios, although the trends in performance were identical. Furthermore, there wasn’t any meaningful differentiation between the theoretical portfolios, which is interesting given that the base case had a high p-value that made it statistically insignificant. These two facts (discrepancy in performance and high p-value) point to a potential omitted variable problem that would take more space than we have here to discuss.
Source: FactorResearch
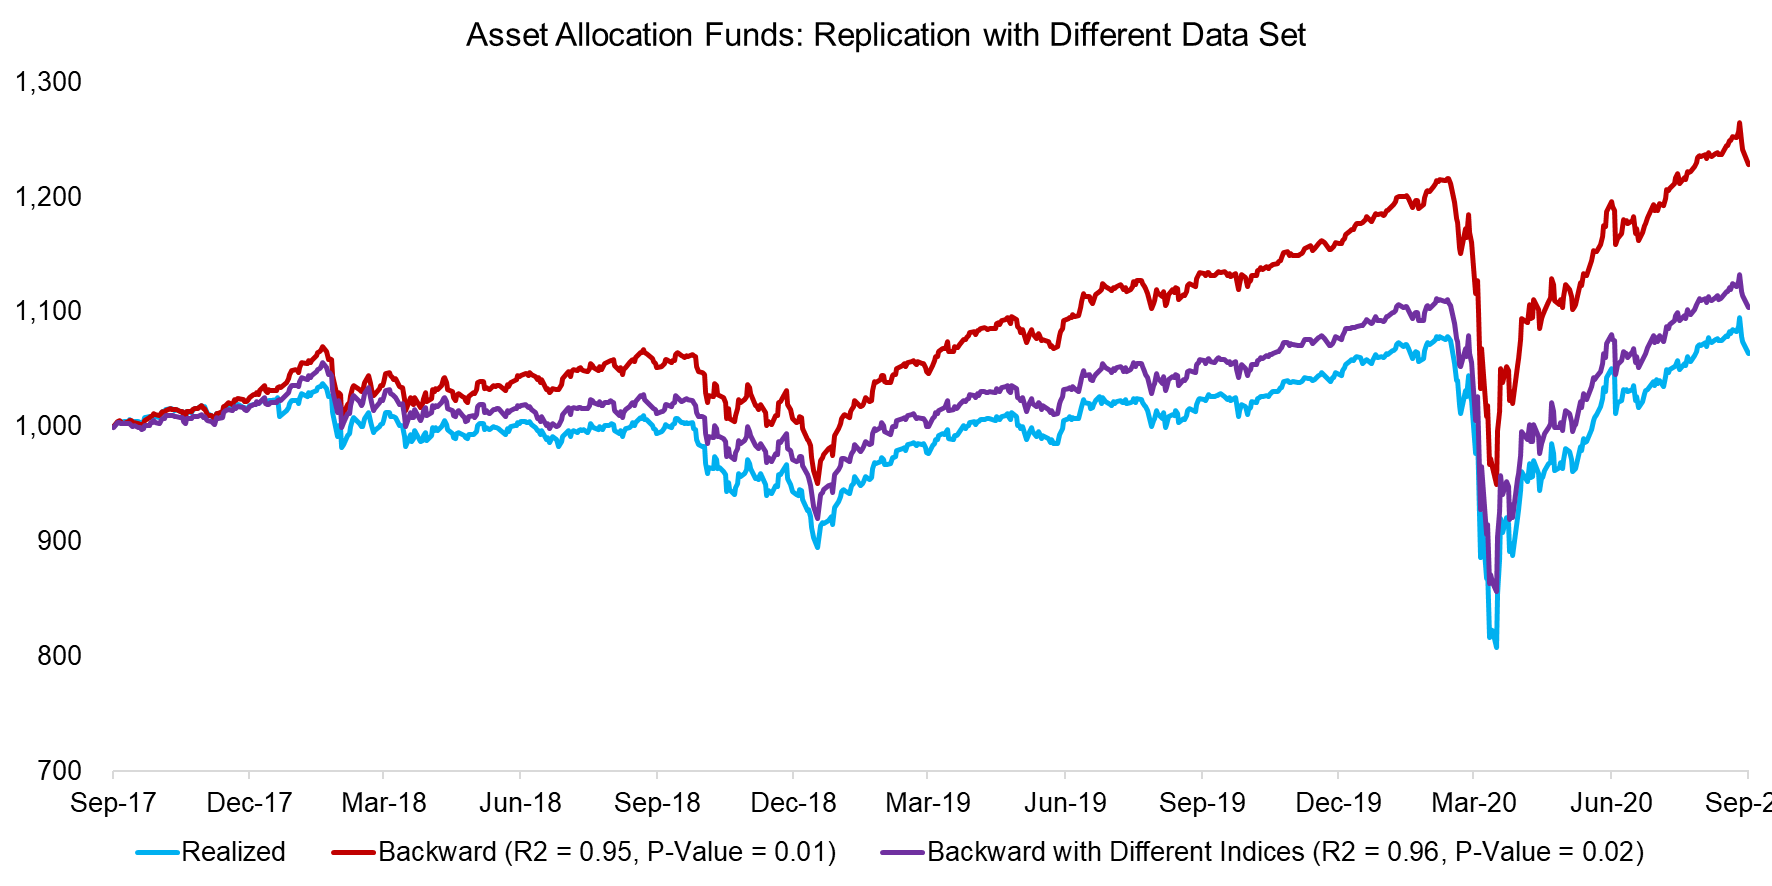
It is worth highlighting that data quality plays a significant (again, no pun intended) role in regression analysis. We can swap the majority of the 20 indices, which are mostly from one large investment bank, with indices from another provider to evaluate the sensitivity to the data sources. This is another way to highlight that design choices in the construction of data are very important, even if they might seem minor decisions.
We use the asset allocation funds portfolio and backward regression analysis as a case study, which resulted in a high R2 and low p-value for both data sets. However, the replication using the second data set of indices results in a portfolio that replicated the performance of the real portfolio more closely.
Source: FactorResearch
FURTHER THOUGHTS
Regression-based factor exposure analysis can be a blunt instrument and not as precise as a bottom-up analysis that assigns factor rankings to each security. On the other side, regression analysis requires far less data and is far easier to run for complex multi-asset portfolios, which is advantageous (read Multi-Factor Models 101).
One of the more underrated aspects of regression-based factor exposure analysis is that the output can be used to create replication portfolios, which empower investors to walk back in time more effectively than using only stock prices. Few listed companies remain the same over time and many change dramatically. For example, Apple has been trading since 1980, but is a completely different company today than 10, 20, 30, and 40 years ago. Using Apple’s actual decade-long stock price history for risk analysis is far less useful than using Apple’s current factor exposures.
RELATED RESEARCH
Factor Exposure Analysis 100: Holdings vs Regression-Based
Factor Exposure: Smart Beta vs Mutual Funds
Replicating Famous Hedge Funds
ABOUT THE AUTHOR
Nicolas Rabener is the CEO & Founder of Finominal, which empowers professional investors with data, technology, and research insights to improve their investment outcomes. Previously he created Jackdaw Capital, an award-winning quantitative hedge fund. Before that Nicolas worked at GIC and Citigroup in London and New York. Nicolas holds a Master of Finance from HHL Leipzig Graduate School of Management, is a CAIA charter holder, and enjoys endurance sports (Ironman & 100km Ultramarathon).
Connect with me on LinkedIn or X.

