Factor Exposure Analysis 112: Quality vs Growth Factors
What equity factors should be used in a factor exposure analysis?
SUMMARY
- The number of independent factors in a factor exposure analysis is subjective
- Typical quality metrics often are unrelated, so should not be combined
- There is also merit in including the growth factor, even if it does not offer positive excess returns
INTRODUCTION
The Fama-French 3-Factor Model was introduced in 1993 in the paper “Common Risk Factors in the Returns on Stocks and Bonds” by Eugene F. Fama and Kenneth R. French, published in the Journal of Financial Economics. This model incorporated three factors: the market, size, and value factors. In 2015, Fama and French expanded their model by adding the profitability and investment factors.
Despite these models being widely used as standards for evaluating fund and portfolio performance, challenges remain. For instance, Jegadeesh and Titman (1993) introduced the momentum factor, while Zhang (2021) proposed the q-factor model, highlighting the ongoing evolution of asset pricing research.
Given this complexity, portfolio analysis firms like MSCI, Bloomberg, or Finominal utilize different factor sets for exposure analysis. Our approach focuses on keeping equity factor selection simple and practical, incorporating value, size, momentum, low volatility, and quality. However, analyzing quality funds has been particularly challenging when applying a multi-metric approach. Additionally, we include a growth factor for evaluating growth-oriented funds (read Factor Exposure Analysis 102: More or Less Independent Variables?).
In this research article, we will examine the quality and growth factors within the context of factor exposure analysis.
QUALITY FACTOR
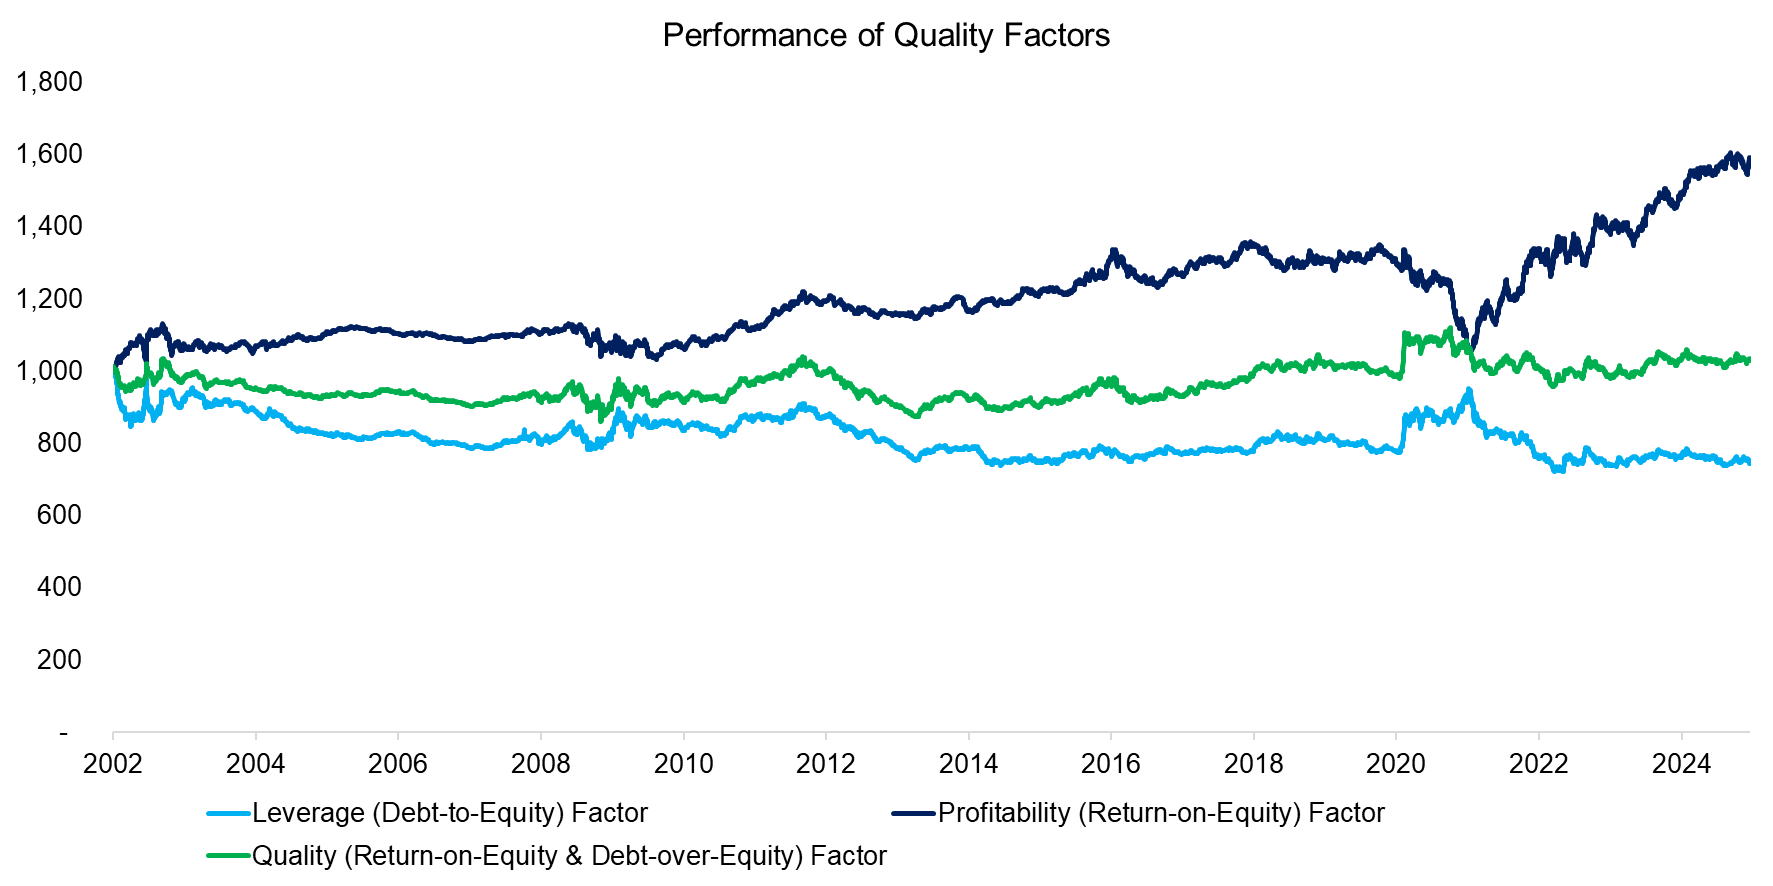
We define the quality factor based on two metrics: leverage (debt-to-equity) and profitability (return-on-equity). Constructing a beta-neutral portfolio using the top and bottom 30% of U.S. stocks ranked by these metrics yields no excess returns over the past 20 years. However, when analyzed separately, profitability demonstrates positive excess returns, whereas leverage does not.
Intuitively there should be no risk premia associated with quality metrics as low leverage and high profitability are desirable characteristics of any stock, which makes it difficult to explain why investors are getting compensated for holding highly profitable stocks.

Source: Finominal
Switching to the sector perspective reveals a bias towards technology stocks for both metrics, albeit leverage includes plenty of unleveraged and unprofitable technology companies.
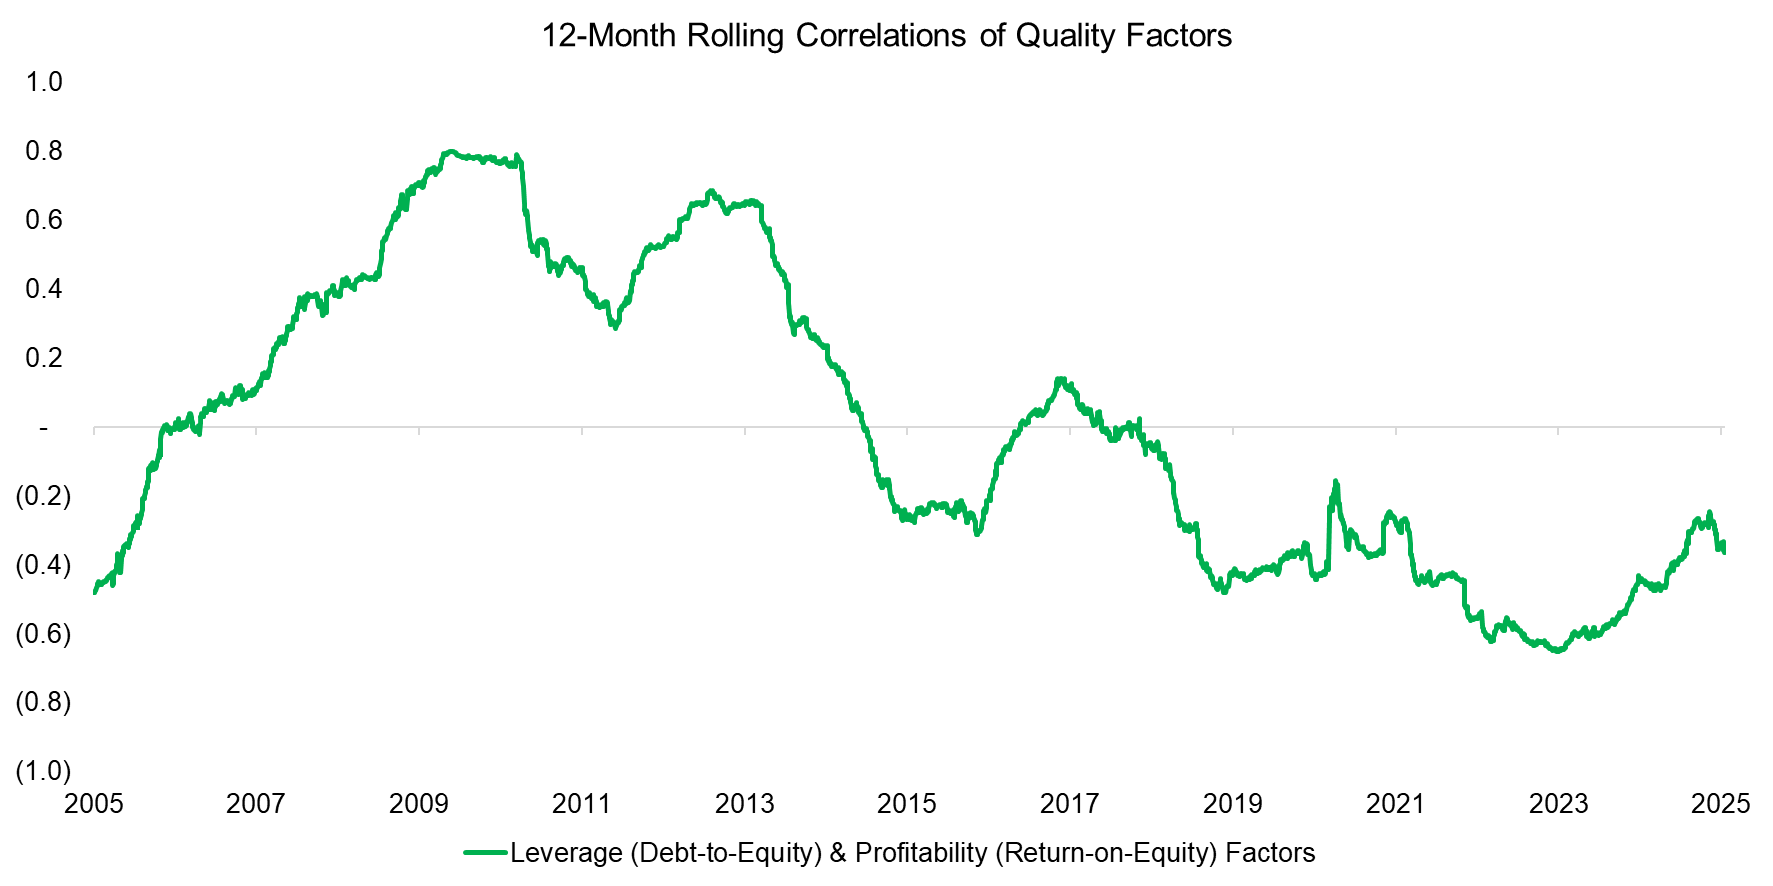
Given this, the average correlation was zero between 2005 and 2025, suggesting they can be treated as separate factors rather than combined. However, we need to acknowledge that the correlation fluctuated significantly, ranging from -0.6 to +0.8.

Source: Finominal
GROWTH FACTOR
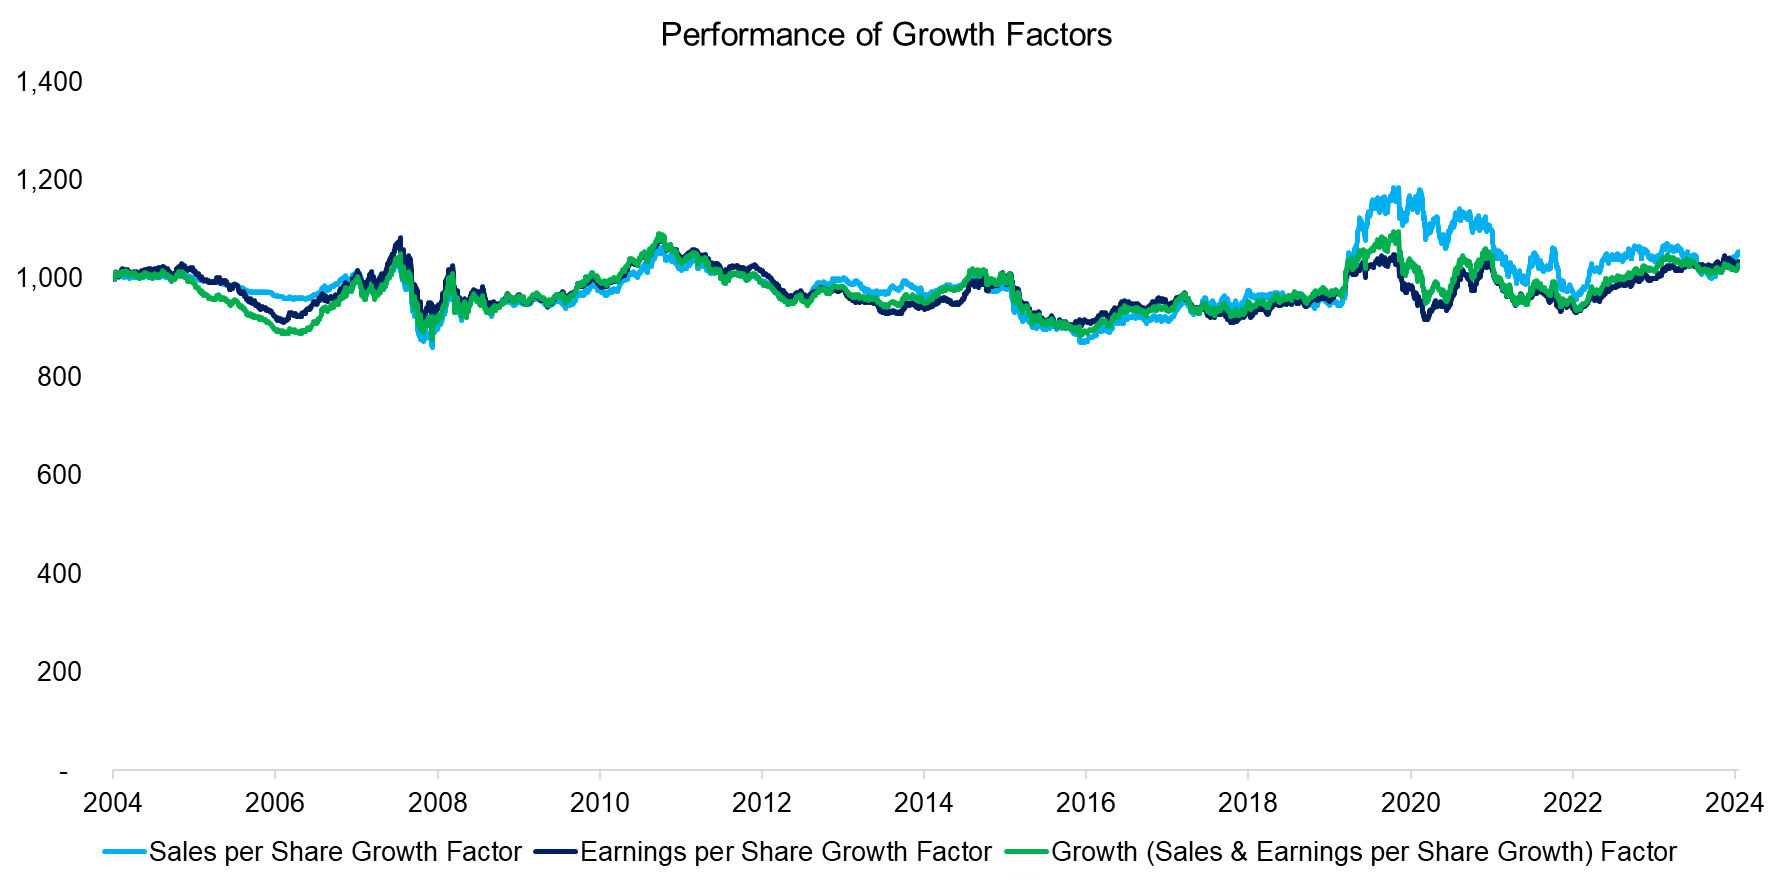
Like the quality factor, the growth factor has failed to generate positive excess returns over the past 20 years. This suggests that investing based on historical growth patterns is not a sound investing strategy.
However, unlike quality, breaking growth into the three-year sales-per-share and earnings-per-share portfolios does not reveal meaningful differences in performance. These portfolios are highly correlated with an average correlation of 0.71.

Source: Finominal
CORRELATION ANALYSIS
Furthermore, the correlations between long-short and long-only factors (excess returns, beta-adjusted) are not stable across time. For example, the correlation for the quality factor ranged between -0.4 to 0.7 over the last 20 years, which implies that the short portfolio had a large impact on returns in some and little impact in other periods.
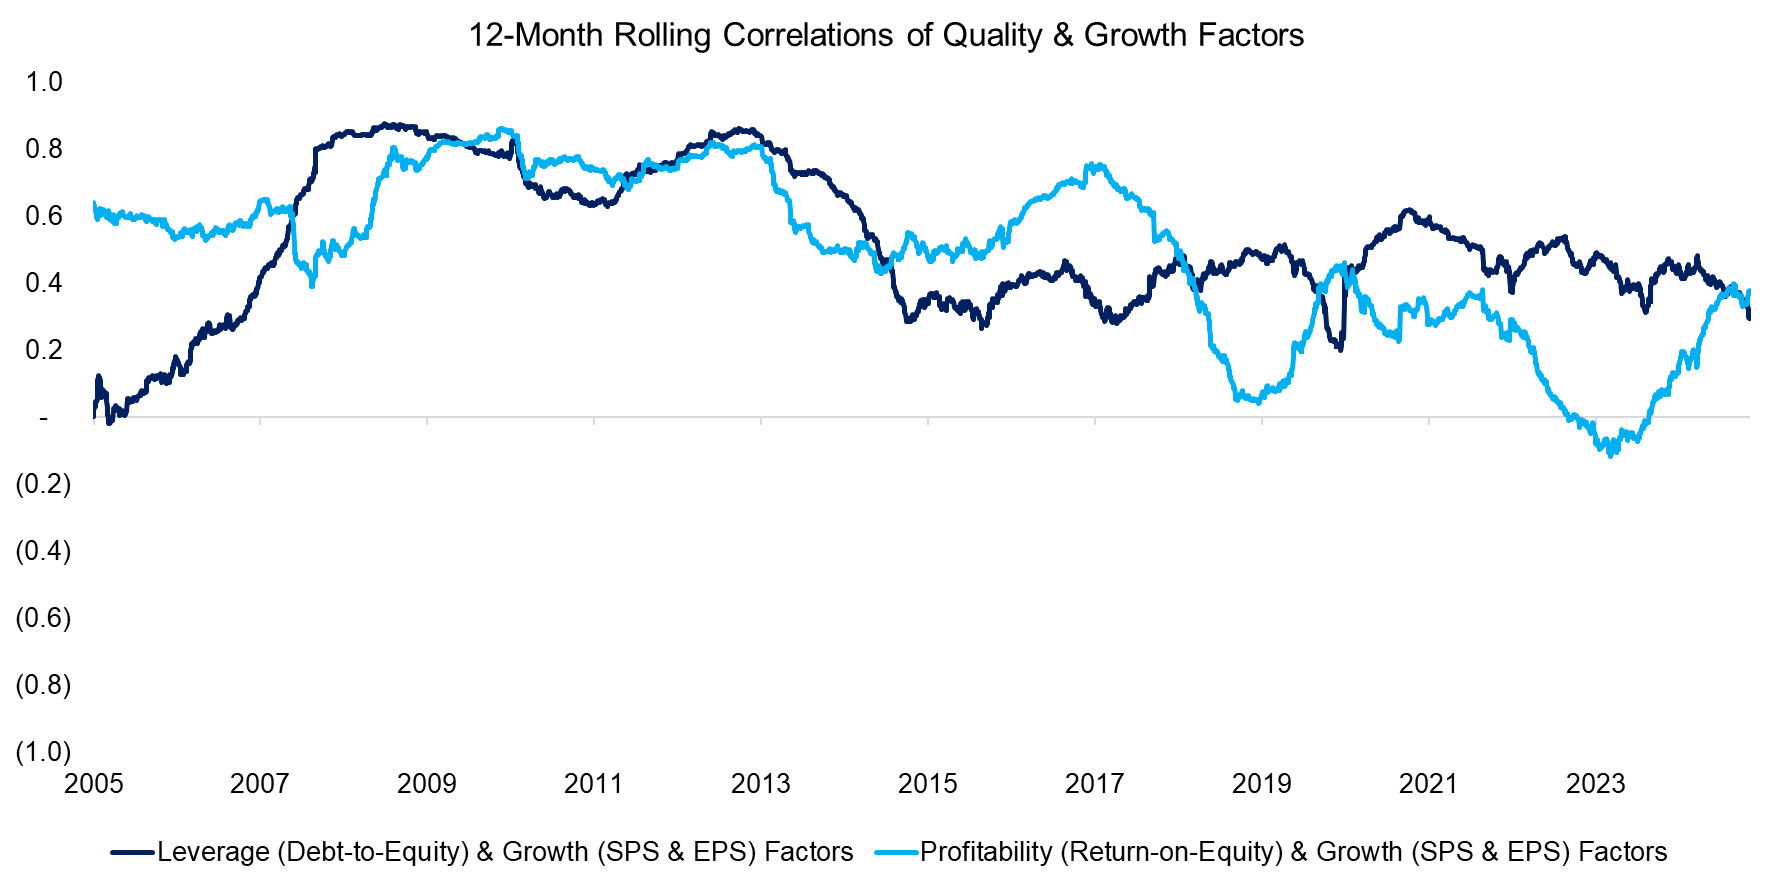
Next, we analyse if profitability and leverage are correlated to growth. Over the last 20 years the correlations were 0.4 and 0.6, but this can be mainly attributed to the five years post the global financial crisis in 2009. Thereafter, the correlations have decreased steadily, although they remain slightly positive.

Source: Finominal
Based on these findings, it makes sense to treat profitability and leverage as separate factors while also incorporating growth into our factor exposure analysis. However, certain strong relationships exist, including value and leverage (average correlation of -0.6), leverage and growth (+0.6), and profitability and low volatility (+0.6).

Source: Finominal
FURTHER THOUGHTS
While expanding our set of equity factors can enhance performance analysis, it also increases complexity. For example, investors may have varying definitions of growth, making it essential to offer a clear definition.
Additionally, why stop at equity factors? One could incorporate fixed income and global macro variables as well. In theory, hundreds of factors could be included in factor exposure analysis, with Lasso regression helping to narrow them down to the most relevant ones. However, this approach would suggest that nearly every fund has unique drivers of risk and return, complicating direct comparisons (read Factor Exposure Analysis 106: Macro Variables and Factor Exposure Analysis 107: Fixed Income Factors).
Striking the right balance between simplicity and complexity is as much an art as it is a science.
RELATED RESEARCH
Growth ETFs: Performance & Factor Exposures
What Are Growth Stocks?
Quality Factor: Zero Alpha for Most Investors?
Quality in Small versus Large-Cap Stocks
Factor Exposure Analysis 111: What is Alpha?
Factor Exposure Analysis 110: Long-Short vs Long-Only Factors
Factor Exposure Analysis 109: Linear vs Lasso vs Elastic Net
Factor Exposure Analysis 108: Fixed Income Factors II
Factor Exposure Analysis 107: Fixed Income Factors
Factor Exposure Analysis 106: Macro Variables
Factor Exposure Analysis 105: Sectors versus Factors
Factor Exposure Analysis 104: Fixed Income ETFs
Factor Exposure Analysis 103: Exploring Residualization
Factor Exposure Analysis 102: More or Less Independent Variables?
Factor Exposure Analysis 101: Linear vs Lasso Regression
Factor Exposure Analysis 100: Holdings vs Regression-Based
ABOUT THE AUTHOR
Nicolas Rabener is the CEO & Founder of Finominal, which empowers professional investors with data, technology, and research insights to improve their investment outcomes. Previously he created Jackdaw Capital, an award-winning quantitative hedge fund. Before that Nicolas worked at GIC and Citigroup in London and New York. Nicolas holds a Master of Finance from HHL Leipzig Graduate School of Management, is a CAIA charter holder, and enjoys endurance sports (Ironman & 100km Ultramarathon).
Connect with me on LinkedIn or X.

