Factor Exposure Analysis: Dow Jones
Dissecting the Dow
March 2018. Reading Time: 10 Minutes. Author: Nicolas Rabener.
SUMMARY
- Factor exposure should be considered a source of returns as well as of risk
- Factor biases can be measured top-down or bottom-up
- The results of the two approaches do not necessarily reconcile
INTRODUCTION
Factor investing has become immensely popular in recent years and assets in smart beta products surpassed $1 trillion in 2017. However, factor exposure should be regarded as much as a source of returns as of risks because factor performance is highly cyclical with some factors exhibiting significant multi-year drawdowns. Some investors prefer to avoid large factor biases in their portfolios, which requires an assessment of the factor exposure. In this short research note we will highlight the two primary approaches for measuring factor exposure, which are regression and ranking-based methodologies, and will take the Dow Jones Industrial Average as a proxy for a simple stock portfolio (read Smart Beta & Factor Correlations to the S&P 500).
METHODOLOGY
We focus on analysing the exposure to seven factors namely Value, Size, Momentum, Low Volatility, Quality, Growth and Dividend Yield. These are created via long-short beta-neutral portfolios based on the top and bottom 10% of the US stock market. Only stocks with a market capitalisation of larger than $1 billion are included. Portfolios are rebalanced monthly and each transaction occurs costs of 10 basis points.
We apply two methodologies for measuring the factor exposure of a stock portfolio:
- Regression-based (top-down): The returns of the portfolio are regressed against the factor performance with a one-year lookback period
- Ranking-based (bottom-up): Each stock is ranked on each factor relative to all other stocks and then assigned a ranking score, which is then aggregated on portfolio level for each factor
DOW JONES CHARACTERISATION
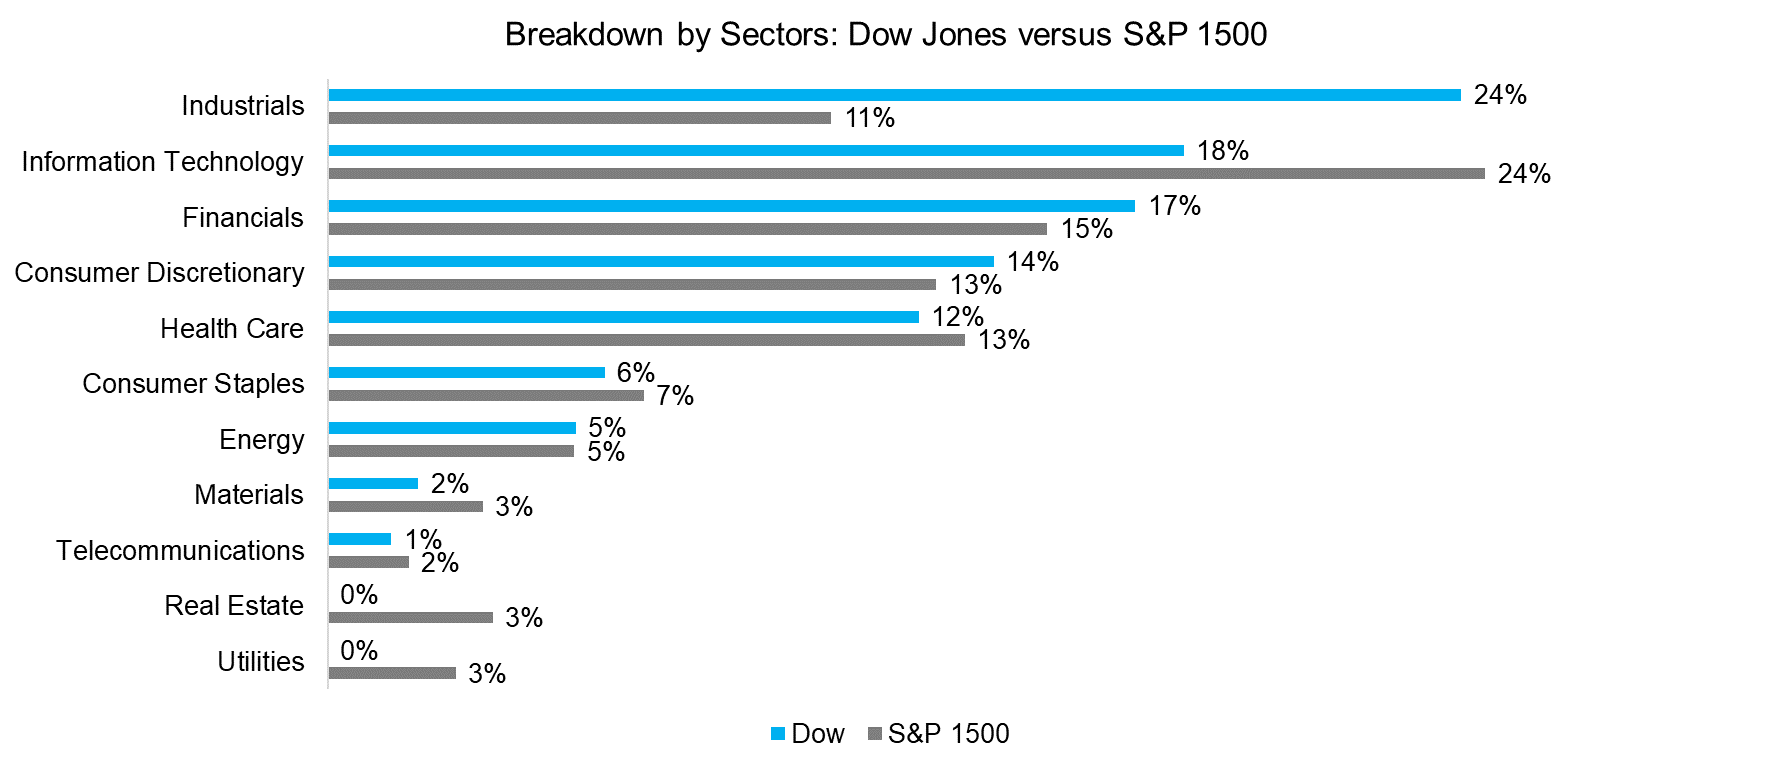
In advance of the analysis it is worth highlighting that the Dow Jones is a reasonable example of a common stock portfolio given 30 well-known constituents; however, not a well-designed index. The index weights are based on stock prices as compared to the more accepted methodology of calculating weights based on free-float market capitalisations. Due to this arcane index rule a company like Goldman Sachs, which has a high absolute share price, currently receives a weight of 7.3% compared to 0.4% for General Electric, despite having a smaller market capitalisation. The index’s full name of Dow Jones Industrial Average is appropriate given that the Industrials sector has a much larger weight in the Dow Jones than in other common indices. The chart below shows the breakdown by sectors of the Dow Jones and the S&P 1500, which covers approximately the stock universe used in the construction of the factor portfolios.
Source: S&P, FactorResearch
FACTOR EXPOSURE ANALYSIS: REGRESSION-BASED
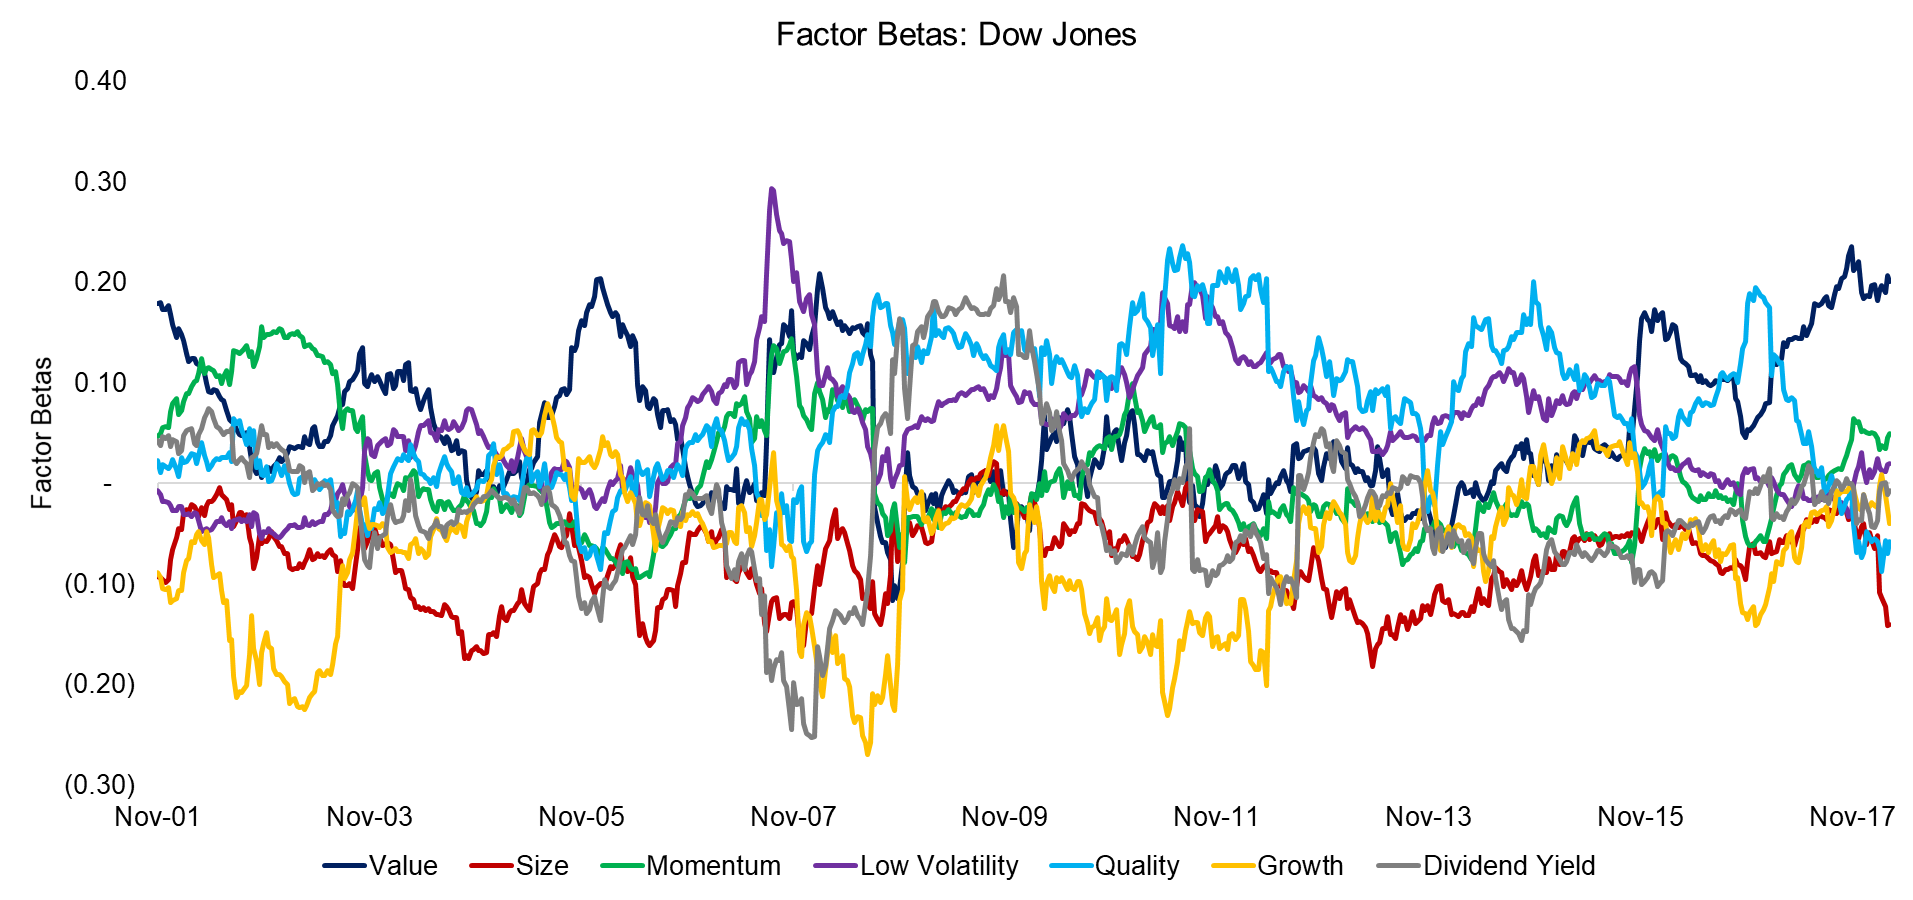
The chart below shows the factor betas for seven factors and the Dow Jones based on a regression analysis using a one-year lookback for the period from 2001 to 2017. The analysis highlights how much of the returns of the Dow Jones can be explained by exposure to certain factors. We can observe that the factor exposure varies over time, but that it is difficult clearly identifying any structural factor exposure.
Source: FactorResearch
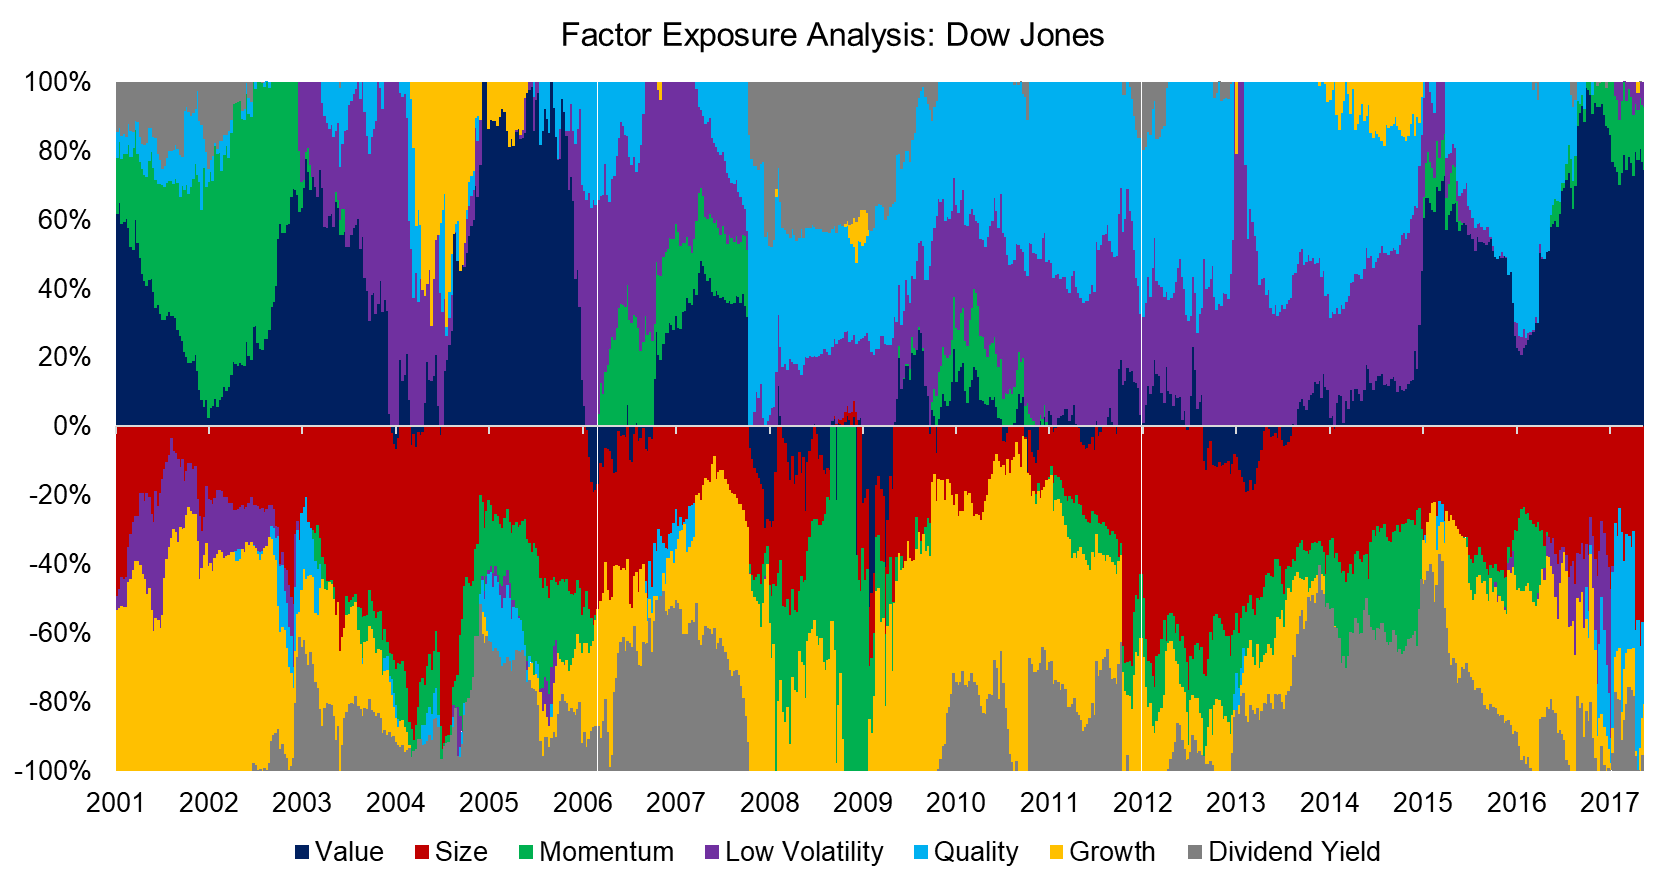
We can normalise the factor betas by differentiating between positive and negative factor exposure, which is shown below. This analysis highlights structural factor exposure of the Dow Jones, mainly a positive bias to the Value, Low Volatility and Quality factors and negative exposure to Size and Growth. The biggest discrepancy compared to larger indices like the S&P 1500 is the significant overweight in the Industrial and underweight in the Technology sectors, which likely explains the factor biases, e.g. Industrial stocks are likely to be cheaper and less volatile than Technology stocks. Given that the Dow Jones contains 30 companies with relatively large market capitalisations, the negative bias to the Size factor is to be expected.
Source: FactorResearch
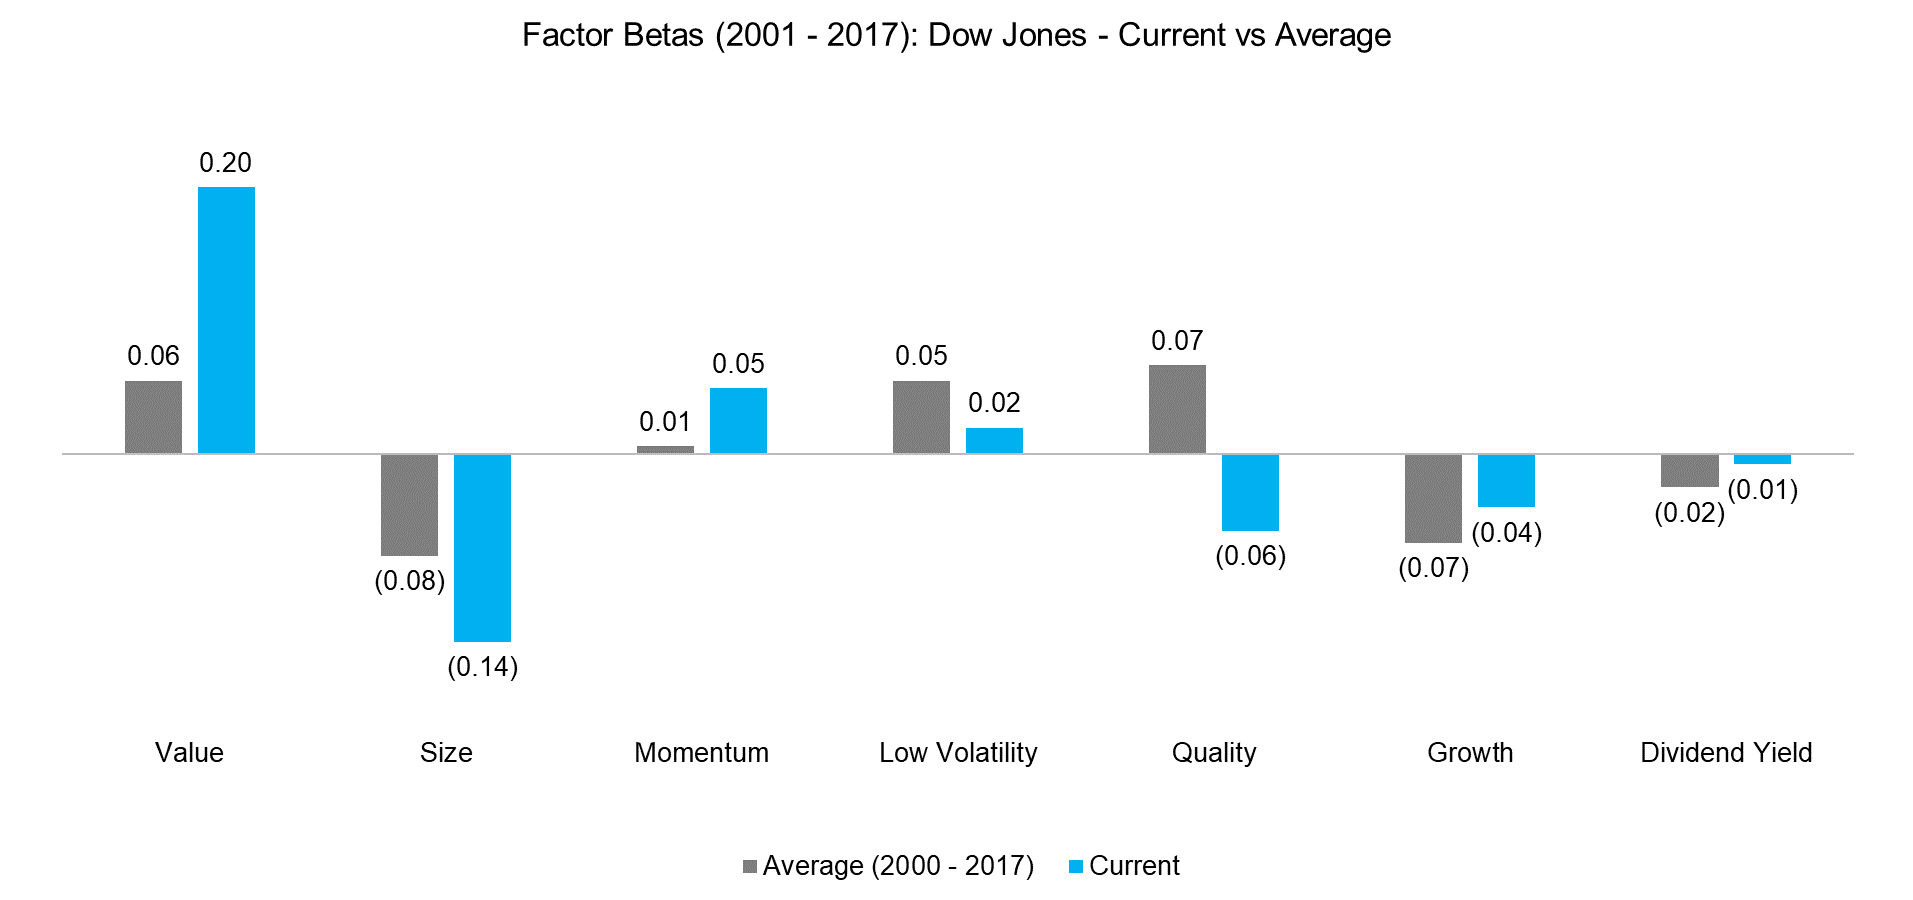
In addition we can contrast the average versus current factor exposure of the Dow Jones. We can observe that the factor betas are significantly different currently compared to historical averages and especially pronounced for the Value factor, which is defined by a combination of price-to-earnings and price-to-book multiples. Currently the Value factor beta is highest of all betas, highlighting that the Dow Jones contains cheap stocks on relative basis, which can likely be explained the low amount of Technology stocks compared to the S&P 1500 (read There is Value in the Value Factor).
Source: FactorResearch
FACTOR EXPOSURE ANALYSIS: RANKING-BASED
The bottom-up ranking-based methodology for measuring factor exposure is an alternative to the top-down regression analysis. Instead of analysing historical returns, this approach ranks every stock for each factor on a daily basis, which is then aggregated for each factor on portfolio level. Therefore this methodology is much more data-intensive and requires more computations than the regression analysis.
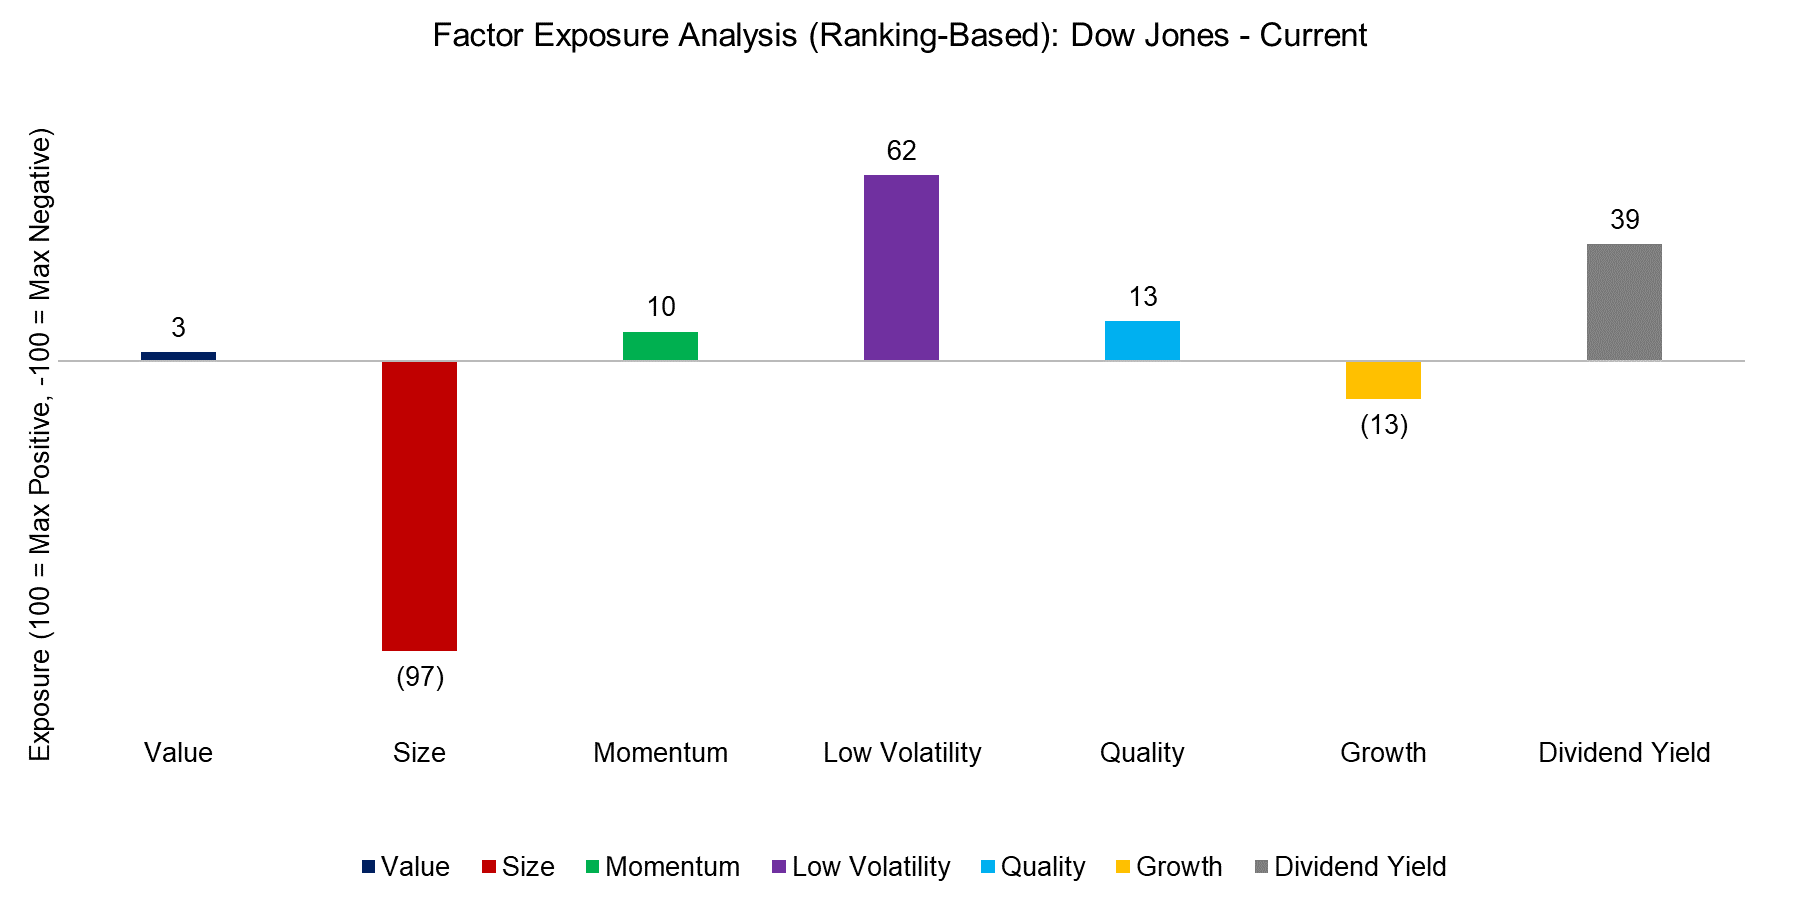
The chart below shows the current factor exposure of the Dow Jones, which can be contrasted with the results above. This analysis results in a somewhat different assessment of current factor exposure, mainly a large negative Size and positive Low Volatility and Dividend Yield exposure, which is somewhat intuitive as the Dow Jones contains large, mature companies, which exhibit relatively low stock volatility and pay high dividends. Although it would be convenient to reconcile both analysis, the two approaches have different methodologies. The statistical regression analysis is backward-looking and aims at explaining what has been driving portfolio returns while the fundamental ranking-based approach is more spot-focused, therefore likely has more significance for the current factor exposure.
Source: FactorResearch
FURTHER THOUGHTS
This short research note highlights the factor exposure of the Dow Jones derived from two different methodologies. Investors who view factor exposure as a source of risk and desire to hedge this, have several options available. Naturally they change their existing portfolio, but that is often viewed as undesirable. An alternative would be to actively hedge the portfolio by adding or subtracting factor exposure, which can be achieved with exchange-traded factor futures or custom portfolios with tailored factor exposure.
ABOUT THE AUTHOR
Nicolas Rabener is the CEO & Founder of Finominal, which empowers professional investors with data, technology, and research insights to improve their investment outcomes. Previously he created Jackdaw Capital, an award-winning quantitative hedge fund. Before that Nicolas worked at GIC and Citigroup in London and New York. Nicolas holds a Master of Finance from HHL Leipzig Graduate School of Management, is a CAIA charter holder, and enjoys endurance sports (Ironman & 100km Ultramarathon).
Connect with me on LinkedIn or X.

