Factor Investing in Singapore
Exploring the factor exposure of stocks in the Lion City
August 2020. Reading Time: 15 Minutes. Author: Nicolas Rabener.
This research note was a collaboration with Singapore Exchange (SGX). We appreciate the joint effort and their support.
SUMMARY
- Singapore’s stock market has unique features given its strong sector biases
- However, despite these, there were no structural factor exposures over time
- Like in other markets, investors can pursue factor investing to generate outperformance
INTRODUCTION
One of the stories of how Singapore received its name is about a Sumatran prince who came across a mythical beast called Janggi while hunting. Janggi acts as a guardian of gold mines and supposedly has lion-like features. From there to the name Singapore it is straight-forward: Singa is derived from the Sanskrit word for lion and Pura means city, given birth to Singapura, or the “Lion City”.
The story is as mythical as the beast as there are no lions in South East Asia, only tigers, and Singapore is not known for gold mines. In fact, the city-state has so few natural resources that even water needs to be imported from nearby Malaysia.
Historically an abundance of natural resources was perceived as a blessing, however, economists’ thinking has changed as it became clear that most countries rich in oil and minerals squander their wealth away. Nations with few natural riches had to work with the only resource at their hands: their people, and in the case of Singapore, also its favorable geographical position for trading.
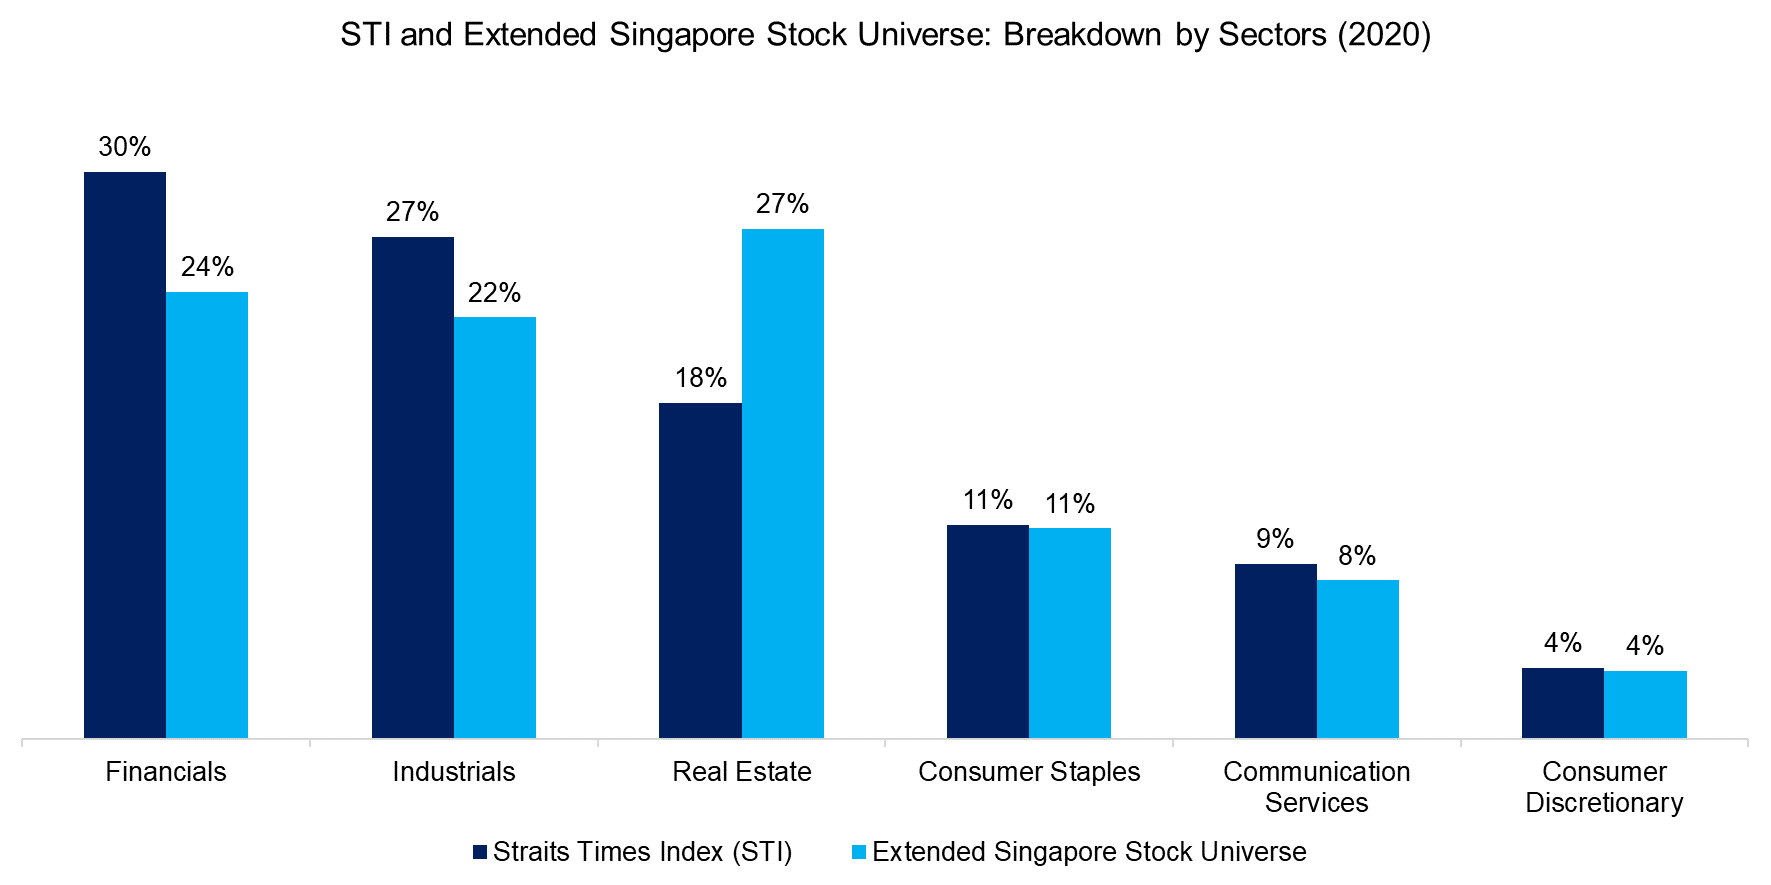
The composition of Singapore’s stock market reflects an industrious and trading-oriented country as it is dominated by financial, industrial, and real estate companies. These three sectors contribute more than 75% of the stocks of the FTSE Straits Times Index (STI), the benchmark index.
It is surprising that the real estate sector plays an outsized role in such a small country, but these are mostly companies that are listed in Singapore and manage assets elsewhere, highlighting a sophisticated financial market that is attractive for global companies seeking capital.
However, corporates that have revenues from diverse geographies and relatively small local footprints are complex animals. Analyzing stocks in the Singapore market is therefore frequently challenging. It is questionable if popular investment strategies like selecting cheap or quality stocks work as well as in other equity markets.
In this research note, we will analyze the performance of classic equity factors and explore the factor exposure of the most liquid stocks in the Singapore stock market (read Factor Investing Made in China).
SNAPSHOT OF THE SINGAPORE MARKET
On a first glance, global investors might overlook Singapore given a population of less than 6 million, compared to more than a billion people in China and India as well as close to 300 million in Indonesia. However, more than 40% of the total market capitalization of companies listed in Singapore are foreign stocks, which provides investors with exposure to the country as well as to the region. Given the status of a developed nation, it offers an attractive way of accessing the emerging Asia growth story.
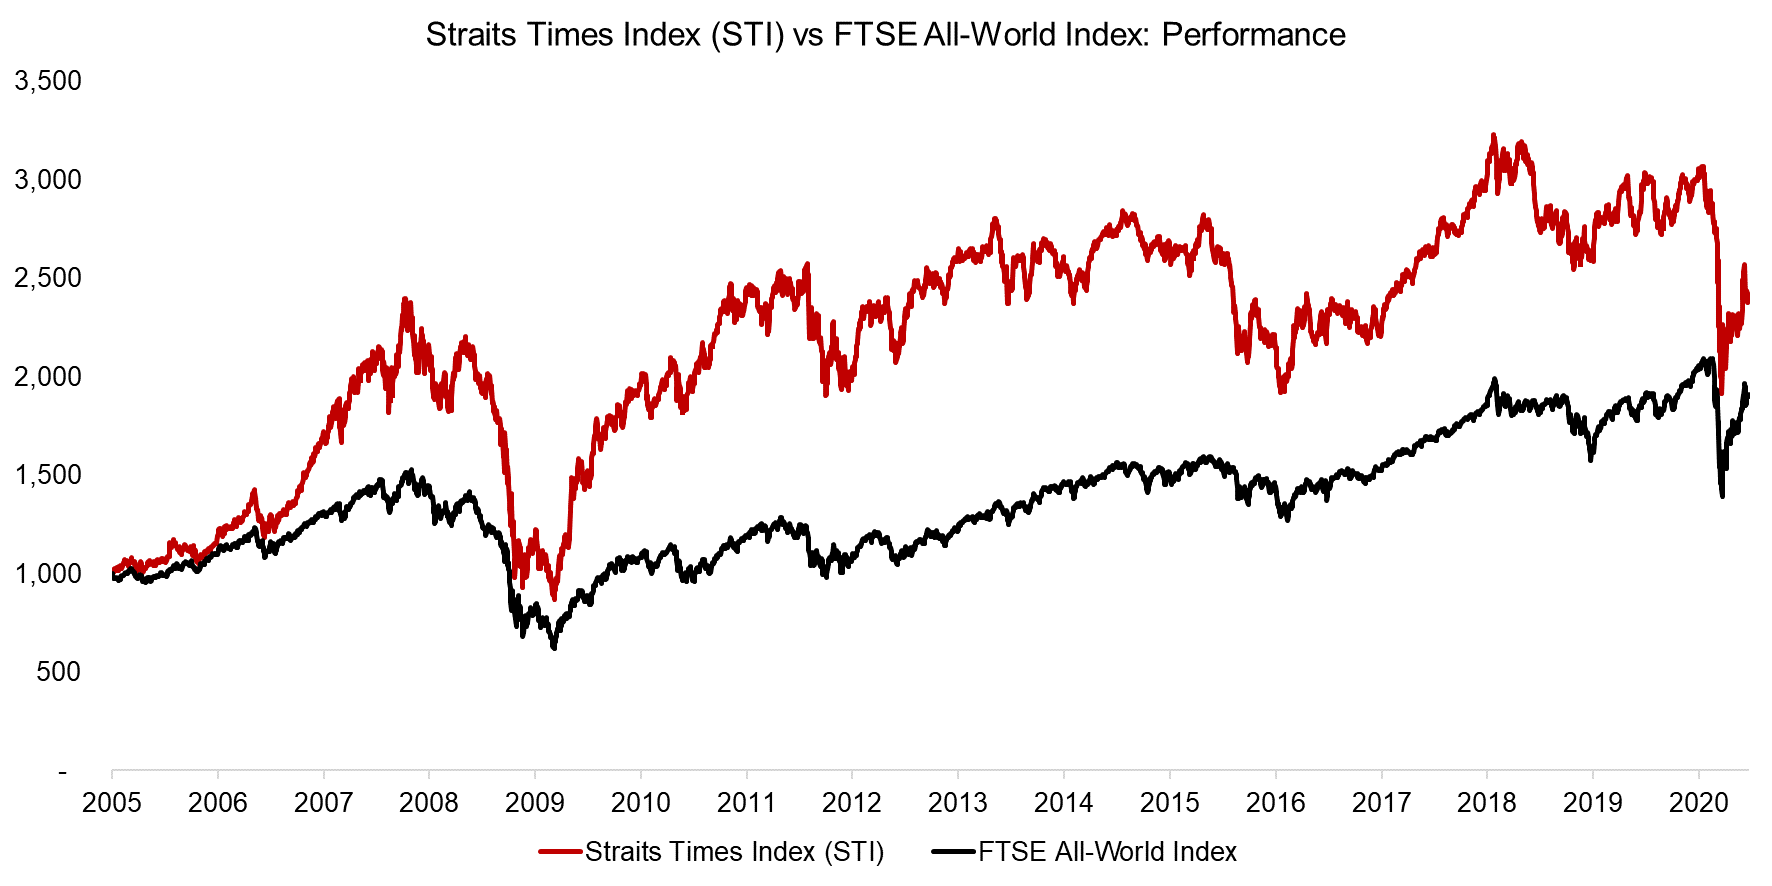
Singapore is deeply integrated into the global economy given its position as one of the largest trading hubs in Asia. It is therefore not surprising that the performance of STI has been comparable to that of the FTSE All-World index in the 15 years from 2005 to 2020.
Source: FactorResearch
The STI has been more volatile than the FTSE All-World index, which is explained by the STI being comprised of only 30 stocks, essentially representing a highly concentrated portfolio. Furthermore, the index exhibits significant sector biases that reflect the unique nature of Singapore’s economy.
However, in order to analyze the performance of equity factors in Singapore, we need to create diversified portfolios. Factor investing represents a systematic approach to generating outperformance, where minimizing individual firm-risk is critical.
We, therefore, define our universe of stocks in the Singapore market as the approximately 120 most liquid stocks traded on the Singapore Exchange, which increases the cumulative market capitalization from S$456 billion to S$578 billion compared to the STI. The exposure to the financial sector is reduced, although real estate stocks gain in prominence.
Source: FactorResearch. Only sectors with >4% contribution.
The breakdown highlights that these seven sectors dominate the stock market in Singapore in terms of liquidity over sectors like technology, utilities, health care, energy, or materials.
PERFORMANCE OF CLASSIC EQUITY FACTORS IN SINGAPORE
Defining Factors
Next, we analyze the performance of classic equity factors in Singapore, which is derived from beta-neutral long-short portfolios comprised of stocks from the extended stock universe.
We focus on seven factors, but it is worth highlighting that only five of those, namely Value, Size, Momentum, Low Volatility, and Quality, enjoy broad support from the research community. There is little empirical evidence that the Growth factor generates excess returns and Dividend Yield can be viewed as a subset of Value. However, both factors are widely followed investment styles, which warrants their inclusion in this analysis.
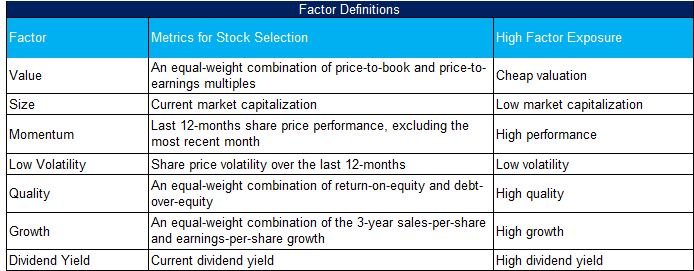
We utilize factor definitions that are in line with academic and industry standards when ranking stocks. Specifically, these are as follows:
Source: FactorResearch
All factor portfolios are created by selecting the top and bottom 30% of stocks in the Singapore market and 20% in other markets ranked by each factor definition. Beta-neutrality is achieved by maintaining a beta of one in the long and short portfolios of each factor. The performance is therefore uncorrelated to the market and represents excess returns. We assume costs of 10 basis points per transaction and portfolios are rebalanced each month.
The analysis period covers 15 years from 2005 to 2020, which includes a multi-year bull market and two major stock market crashes, i.e. the global financial crisis in 2008 and the COVID-19 crisis in 2020. As benchmarks, we selected similarly constructed global long-short beta-neutral factors, which is use stocks from the US, Europe, and developed Asian markets. The factor portfolios are created in each market and then aggregated by weighting them according to the market capitalizations.
Factor Performance
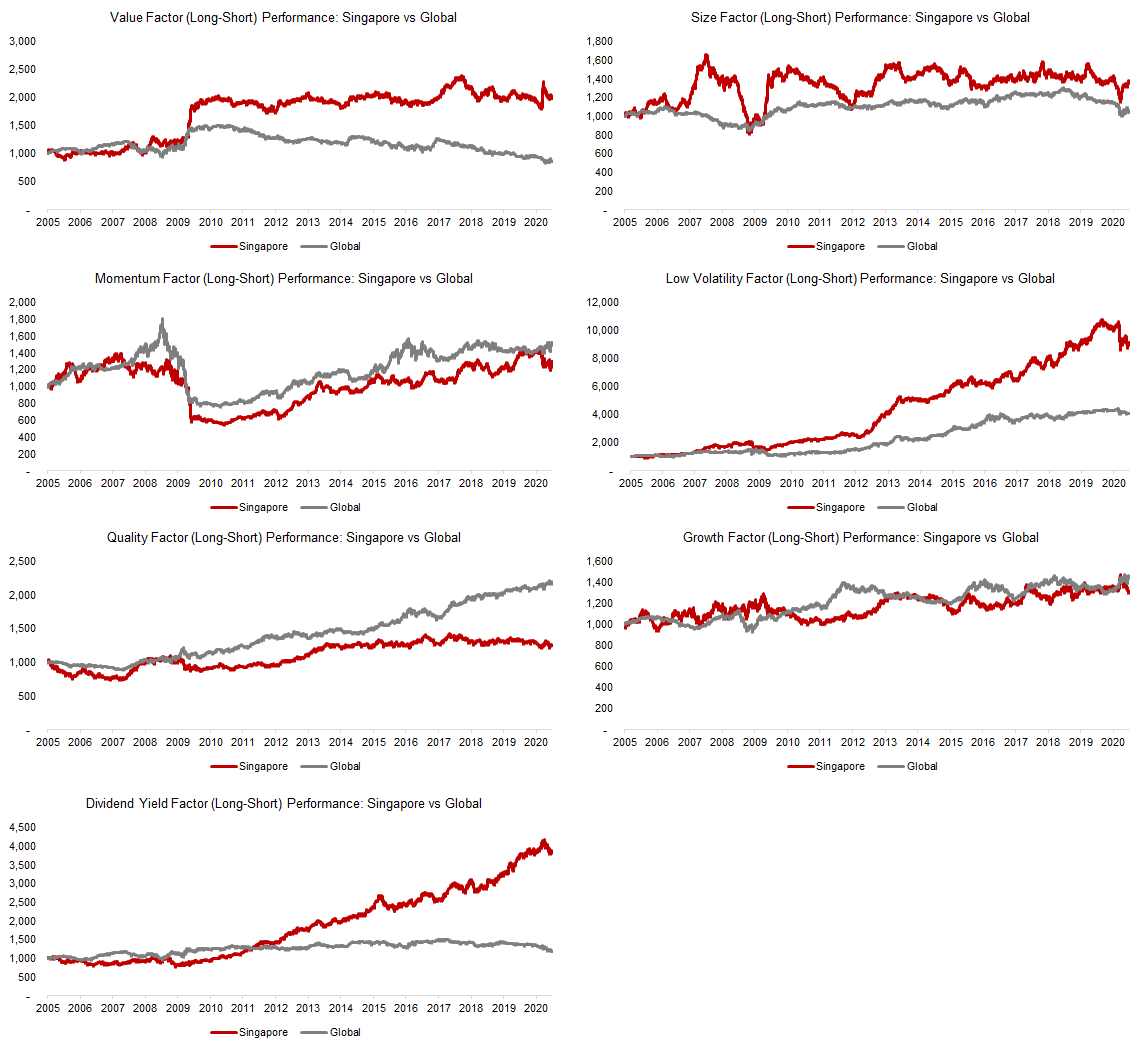
The analysis highlights that broadly speaking the performance of the long-short equity factors in Singapore mirrored the performance of global factors, which indicates common returns drivers. These results are not particularly surprising given that other researchers have found that factor investing does not only generate positive excess returns across various stock markets, but also in asset classes like fixed income, currencies, and commodities.
The returns of factors in Singapore were more volatile and more extreme in magnitude, which is explained by more concentrated portfolios with fewer stocks.
Source: FactorResearch
Multi-Factor Investing
These results highlight that factors behave quite differently across time and are as cyclical as equity markets. They experience long as well as aggressive up- and downward trends.
Intuitively investors are likely to be intrigued by the best-performing factors, which were Low Volatility and Dividend Yield in Singapore in the period from 2005 to 2015. However, performance chasing is risky and single factors can have extensive drawdowns. For example, the Momentum factor experienced a drawdown of more than 50% in 2009 when stock markets recovered and previously underperforming stocks like banks significantly outperformed winners such as healthcare stocks.
Given this, it is intuitive to combine factors into a multi-factor portfolio. Naturally, the question is which factors should be selected and how should these be weighted. A simplistic approached would be to equal weight the factors supported by academic research, which are Value, Size, Momentum, Low Volatility, and Quality.
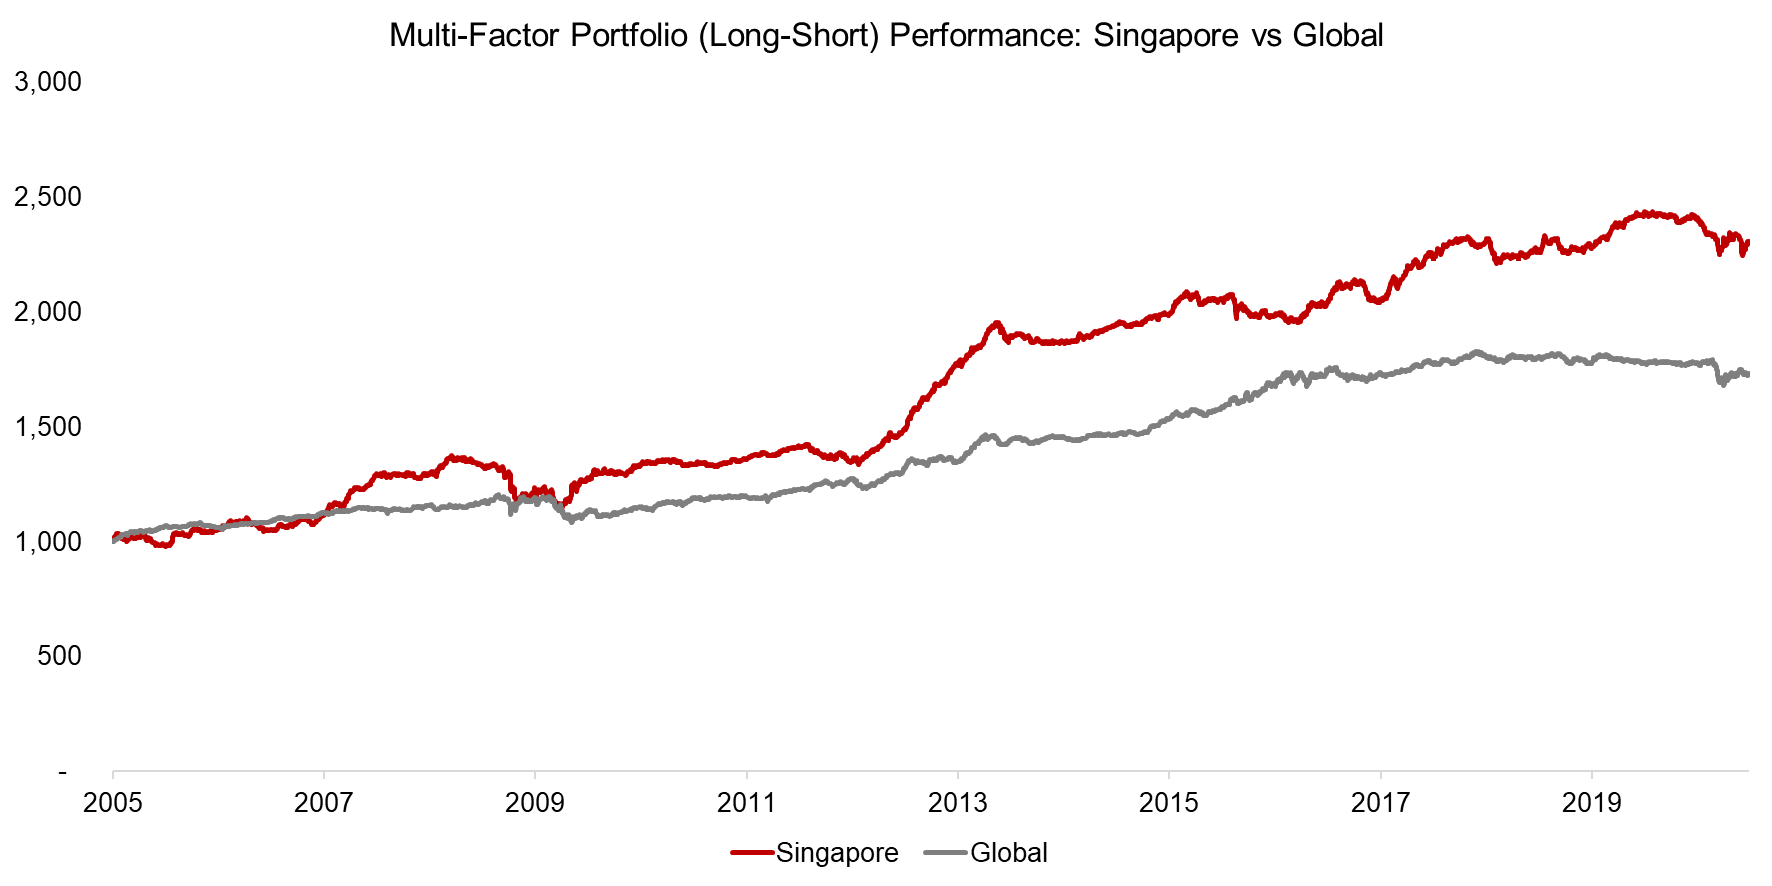
We simulate the performance of such a multi-factor portfolio in Singapore and globally, which highlights relatively consistent excess returns with limited drawdowns over the last 15 years. The key difference is that factor investing in Singapore continued to generate positive excess returns since 2016 while a global multi-factor portfolio was essentially flat.
Source: FactorResearch
The mediocre performance of global multi-factor investing in recent years has been discussed intensely by market participants and researchers, but there is no consensus on the cause. Investors frequently question if the flows into risk premia and smart beta have caused certain factors to be crowded, but the data does not support it.
For example, the Value factor has performed poorly since 2010, but is more likely uncrowded than crowded based on fundamental valuation metrics as cheap stocks are trading at the widest spreads compared to expensive stocks since the tech bubble in 2000.
Factor Allocation Models
Factor investing can be pursued strategically or tactically. The former comprises allocating capital to a single or multi-factor portfolio with regular, but infrequent rebalancing. Allocations to factors within a multi-factor portfolio are typically equal- or risk-weighted.
Allocating tactically represents a more dynamic approach to factor investing, where allocations change frequently based on discretionary or systematic signals. Academic research indicates that factors perform differently across the various economic regime and investors can adjust their allocations based on their perception of the outlook for the local or global economy, as highlighted by the following framework.

Source: FactorResearch
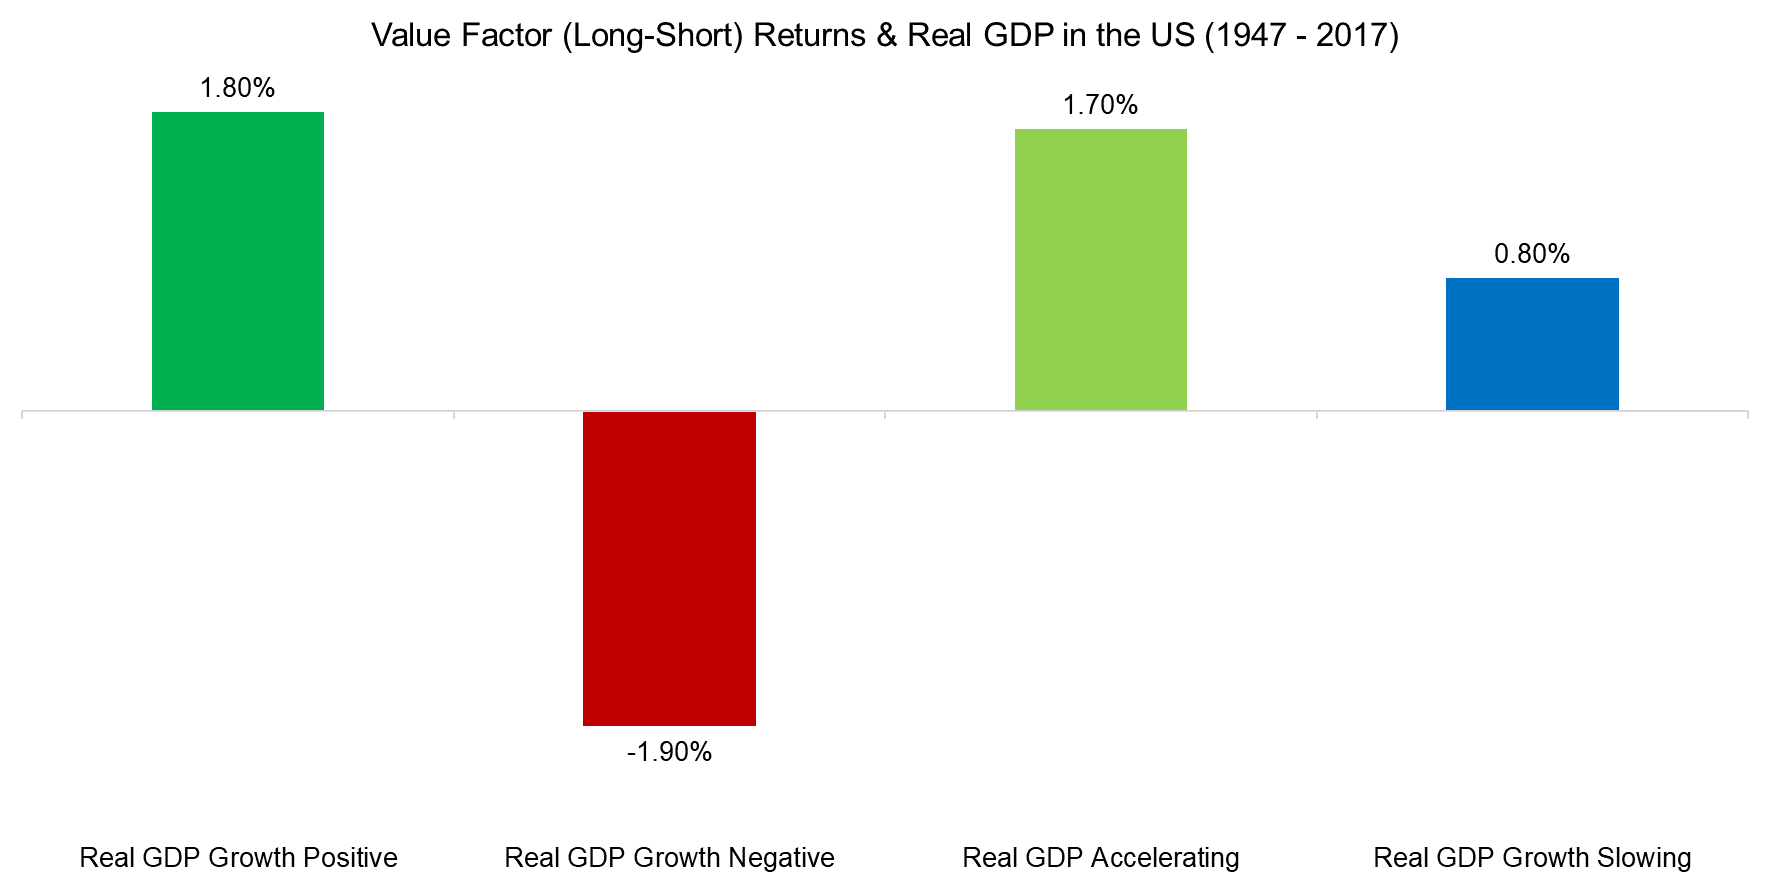
We can highlight the factor performance during the economic cycle by studying the Value factor in the US, where long-term data is available. We distinguish between positive and negative GDP growth as well as between accelerating and decelerating growth, which is defined as the last quarter divided by the average growth of the previous four quarters (read Equity Factors & GDP Growth).
The analysis highlights that the returns of the Value factor were highly dependent on the economic regime. Specifically, the performance was positive when real GDP was positive and negative when the economy was in a recession. Furthermore, the return was significantly higher when economic growth was accelerating compared to slowing down. Given this, some investors may seek rather tactical than strategic exposure to factors.
Source: Federal Reserve Bank of St. Louis, Kenneth R. French data library, FactorResearch
Stocks in the Singapore Market with Most Positive & Negative Factor Exposure
Investors that want to express their views on the economy, can accordingly select portfolios of stocks that offer high exposure to a certain factor and potentially allows investors to generate substantial outperformance.
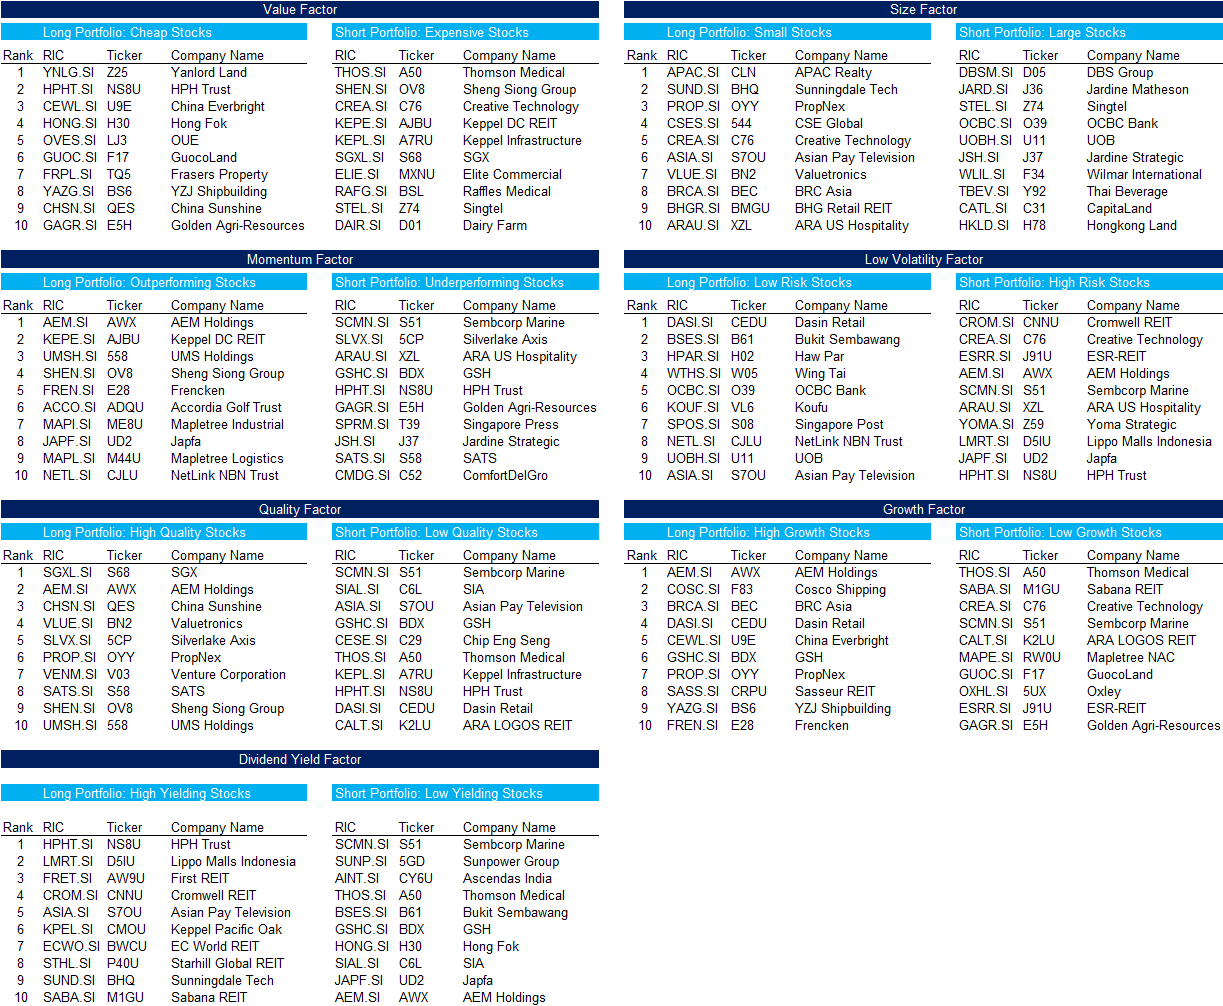
The two methodologies for determining the factor exposure of a stock are top-down or bottom-up analysis. The top-down approach measures the factor exposure via a regression using factor returns, which results in the betas to each factor. In contrast, the bottom-up analysis measures the rank of each stock using the factor definition relative to all other stocks in the universe.
Naturally, both methodologies are related as the bottom-up factor rankings are used to create the factor portfolios and returns. However, both have advantages and disadvantages that determine their application.
The bottom-up analysis is arguably more precise and useful when determining the current factor exposure of a portfolio. The tables below show the factor exposure of the approximately 120 most liquid stocks in the Singapore market. For each factor, the top and bottom 10 stocks are listed.
Source: FactorResearch
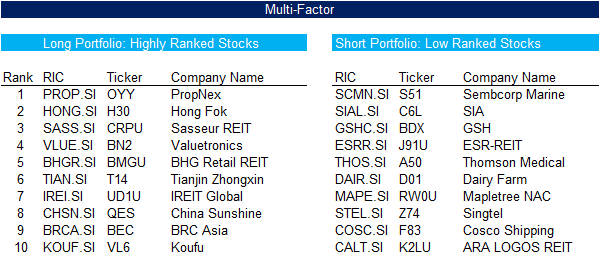
In addition to the single factor portfolios, we also highlight the top and bottom stocks of a multi-factor portfolio that was created using the five factors most supported by academic research, i.e. Value, Size, Momentum, Low Volatility, and Quality.
Source: FactorResearch
Factor Exposure of the Singapore Stock Market
In addition to analyzing the factor exposure of each stock, we can also explore if the Singapore stock market exhibits structural factor exposure given sector biases towards financials, real estate, and industrial companies.
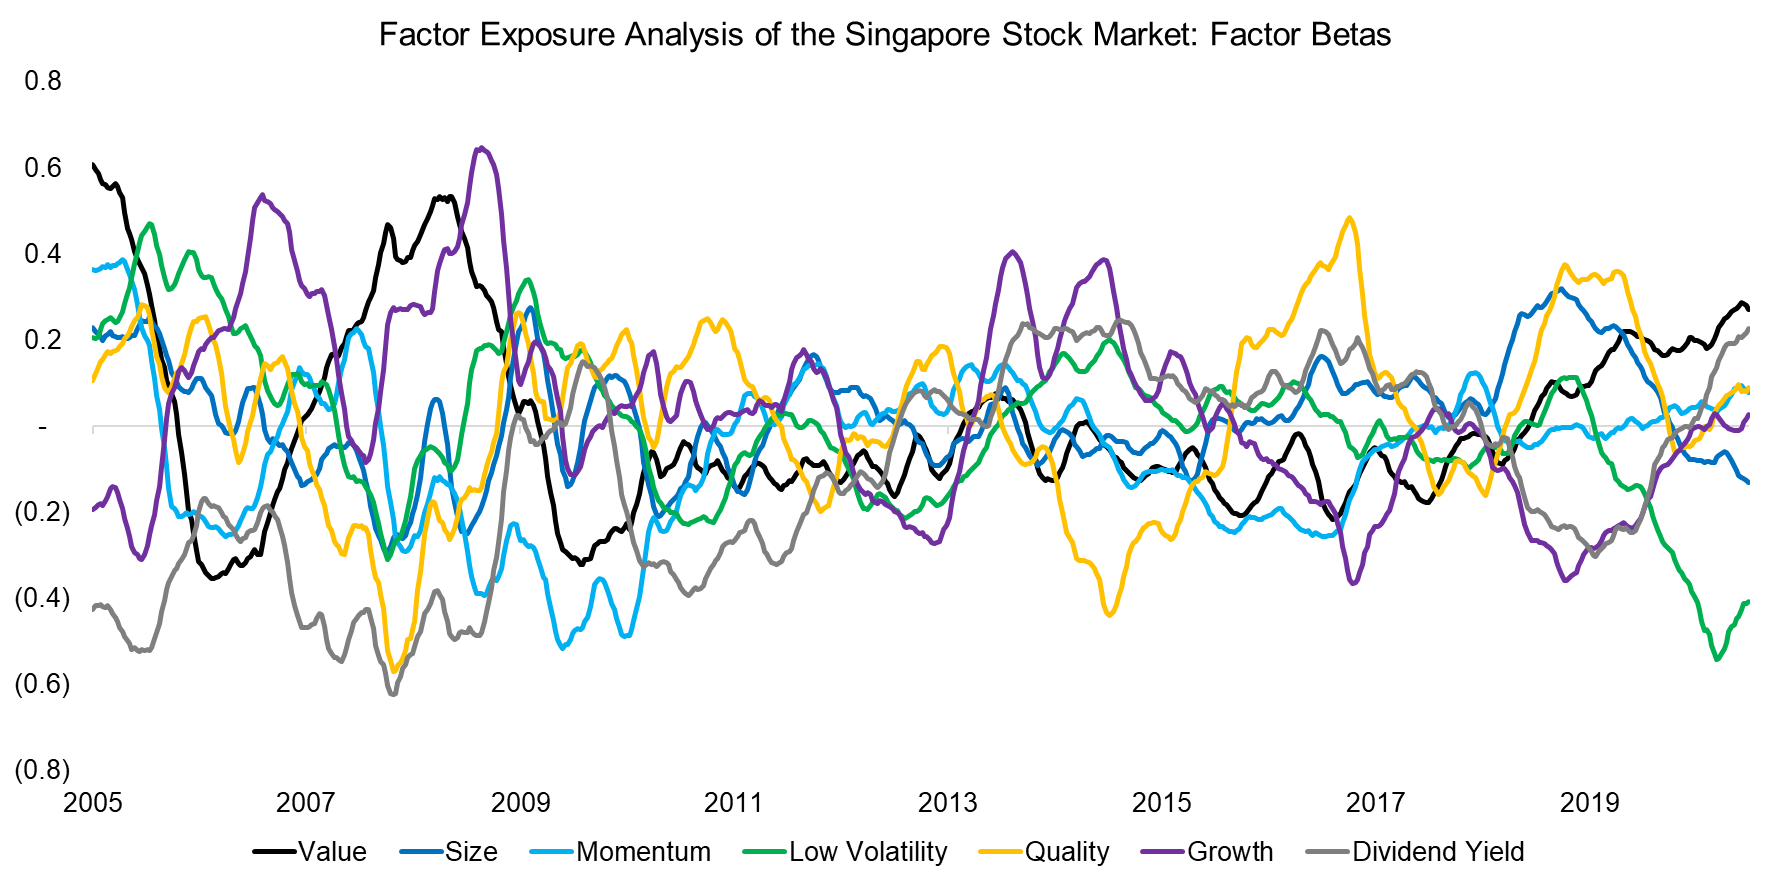
We conduct a regression-based factor exposure analysis of the Singaporean stock market by using global long-short, beta-neutral factors. The analysis highlights that stocks in the Singapore market had significant exposure to classic equity factors over time, but it was time-varying and zero on average for all seven factors over time.
Source: FactorResearch
The factor exposure analysis highlights that although the Singapore stock market has structural sector biases, this did not translate into equivalent consistent factor exposures.
If investors believe an economic recovery is ahead, then factors like Value, Size, and Dividend Yield are expected to generate attractive excess returns based on historical data. The factor exposure of the Singapore stock market currently offers high exposure to Value and Dividend Yield, so could be used as a proxy for betting on a global economic recovery from a factor perspective. In contrast, the S&P 500 has currently negative exposure to Value given high valuation multiples and would be less attractive from this perspective.
Factor Exposure by Sectors, Market Capitalization, and Geographies
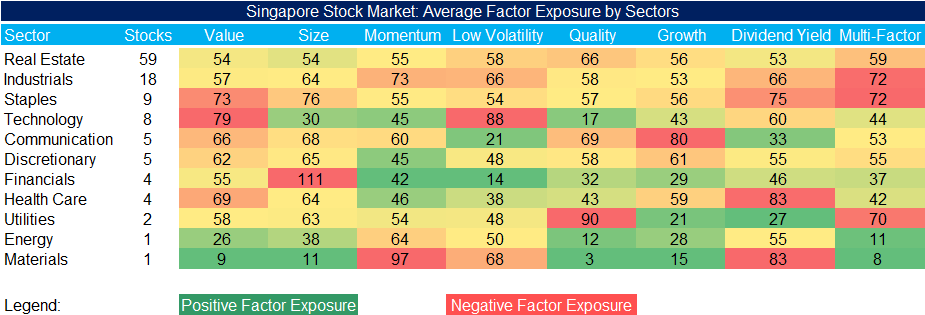
In addition, we can analyze the factor exposure by sectors, although we need to be careful when interpreting the results given that some sectors like energy are comprised of one single stock.
The factor exposure for each stock is calculated using the bottom-up approach that ranks each stock by the different factor definitions relative to all other stocks in the universe. We then create an average factor rank by equal weighting the ranks of all stocks per sector.
Some of the insights are not unexpected, e.g. stocks from the technology sector have negative exposure to the Value and Low Volatility factors, i.e. are expensive and volatile compared to the other stocks.
Source: FactorResearch
Next, we analyze the factor exposure of stocks in the Singapore market by market capitalization, where the universe of available stocks is divided equally by using the median market capitalization of S$1.7 billion.

Source: FactorResearch
The results indicate that small and large caps exhibit significant differences in exposure to factors, which are rather intuitive, e.g. small caps are cheaper, more volatile, and lower in quality than large caps.
In contrast, there is no large difference in exposure to the Momentum and Growth factors. Smaller companies have more potential for growth in earnings and sales than large caps, but there are also stocks that have fallen from grace as they represent declining businesses. Naturally, both types of stocks can outperform, which often is driven by a few select names.
The only exposure that is somewhat surprising is the one to the Dividend Yield factor as small caps typically feature higher yields than large caps. However, this can be explained by the large number of real estate stocks in the Singapore stock market, which feature high dividend yields and are represented in both market capitalization segments.
Finally, we review the factor exposure of the stocks in the Singapore market by the location of their headquarters. The analysis highlights that the factor exposure of geographies varies and there is not one that offers strongly positive or negative exposure for all factors. It is worth noting that many of the companies headquartered in Singapore, do generate revenues in other countries.

Source: FactorResearch
FURTHER THOUGHTS
We set out to explore if popular investment strategies like Value and Momentum are as effective in Singapore’s stock market as in other stock markets, which this analysis confirms. Investors can create single or multi-factor portfolios to harvest excess returns using stocks in Singapore, despite their unique characteristics.
However, factor investing does not represent a free lunch as factors, even if combined in a multi-factor portfolio, are as cyclical as equity markets and go through periods of underperformance like in recent years. As typically in finance, no pain, no premium.
APPENDIX
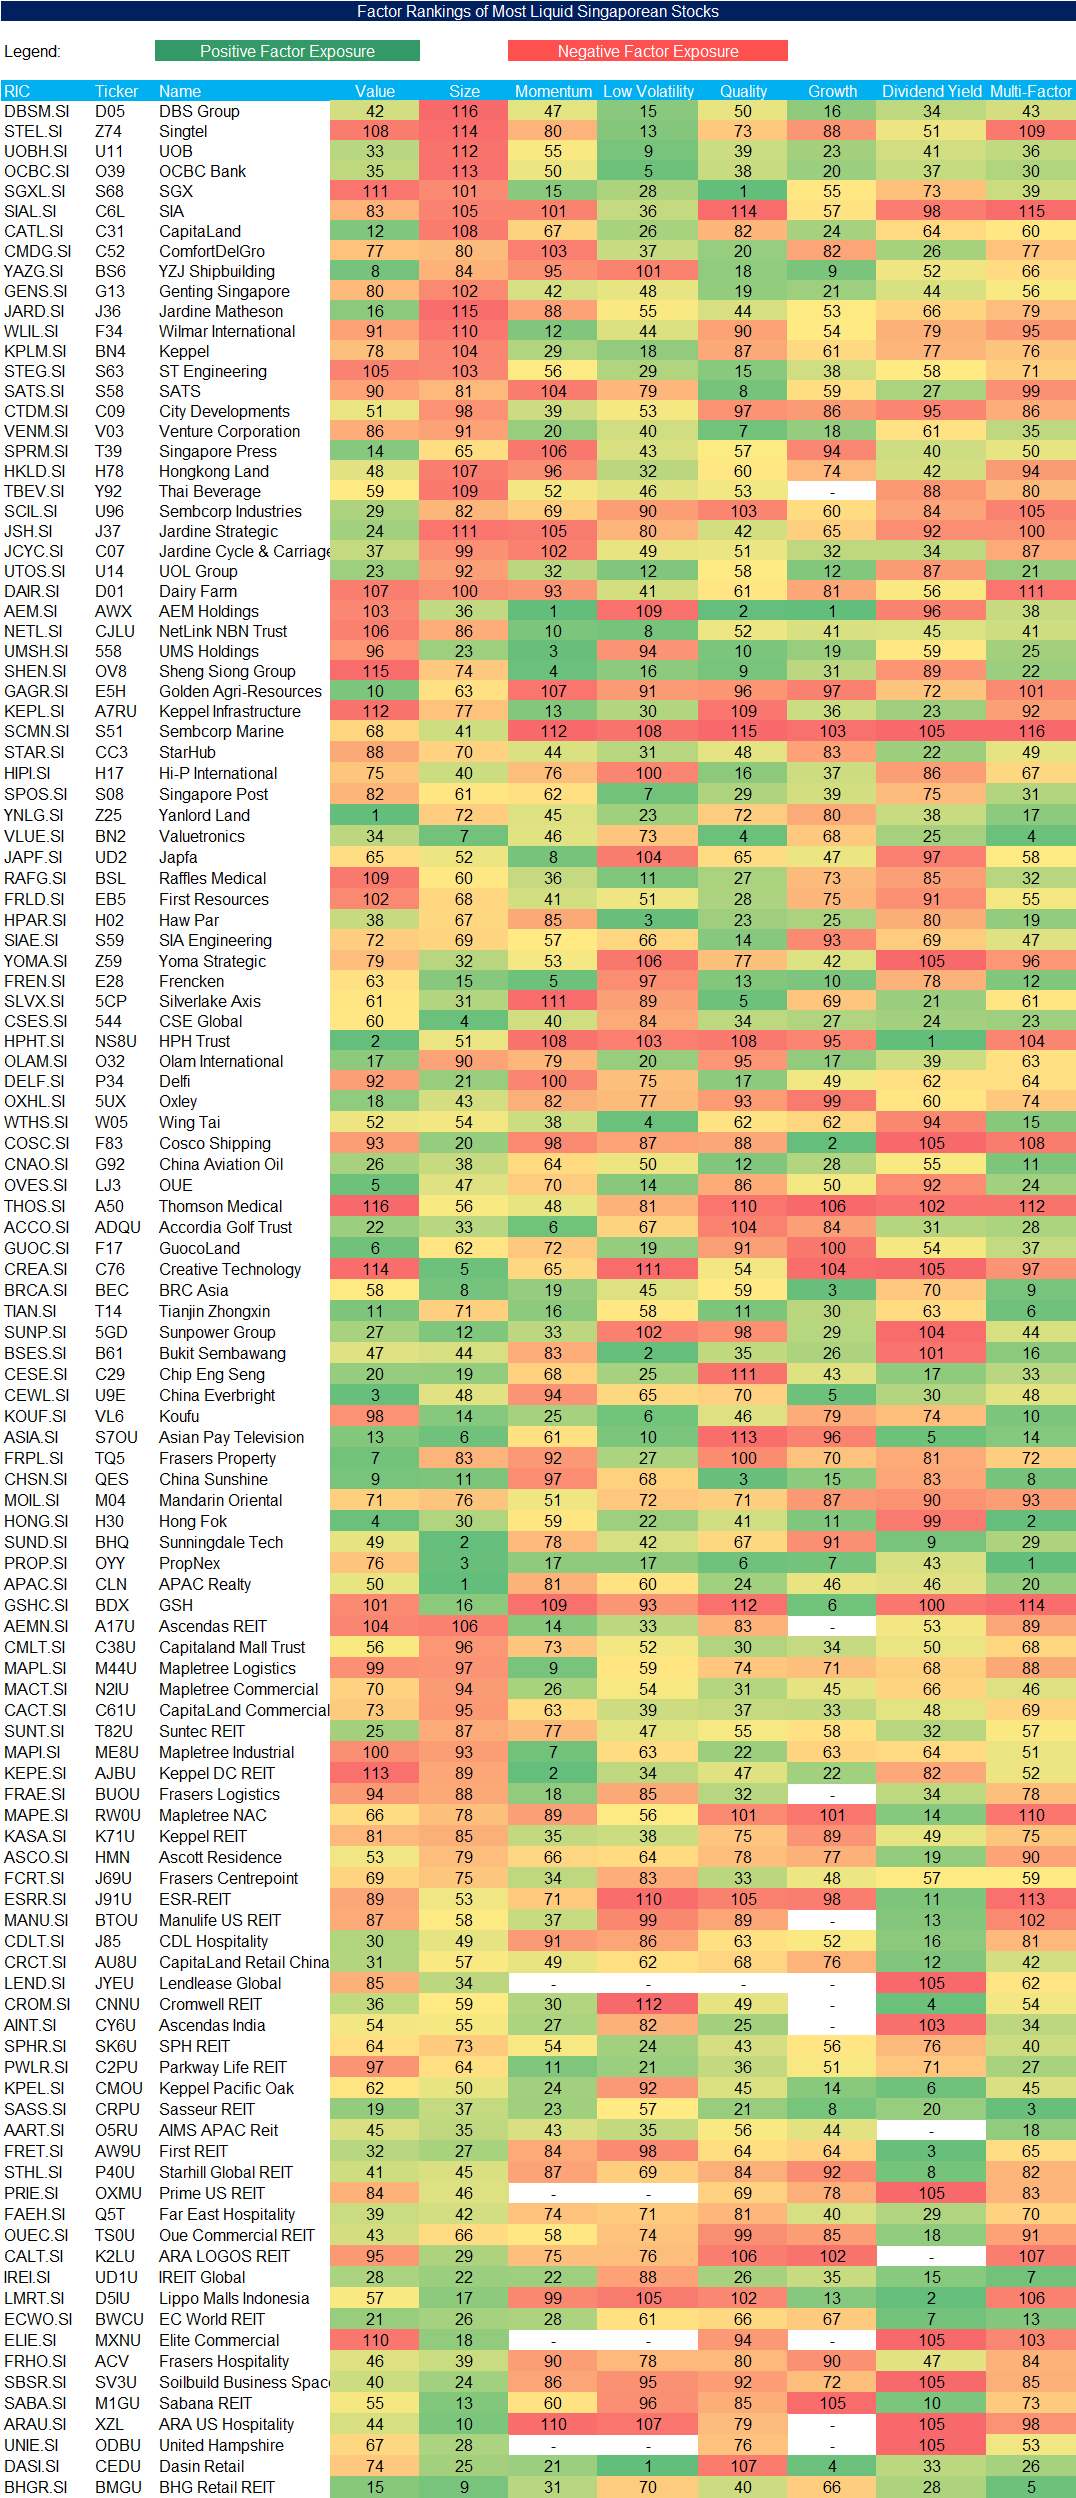
The table below provides the current factor exposure of the approximately 120 most liquid stocks on the Singapore stock market, which means each stock is ranked between 1 and 120. The stock with the most positive factor exposure is ranked 1.
ABOUT THE AUTHOR
Nicolas Rabener is the CEO & Founder of Finominal, which empowers professional investors with data, technology, and research insights to improve their investment outcomes. Previously he created Jackdaw Capital, an award-winning quantitative hedge fund. Before that Nicolas worked at GIC and Citigroup in London and New York. Nicolas holds a Master of Finance from HHL Leipzig Graduate School of Management, is a CAIA charter holder, and enjoys endurance sports (Ironman & 100km Ultramarathon).
Connect with me on LinkedIn or X.

