
Factor Momentum II
Does chasing factor performance work?
August 2026. Reading Time: 10 Minutes. Author: Nicolas Rabener.
SUMMARY
- Chasing factor performance is a viable strategy
- Provides diversification benefits given a low correlation with equities
- Some skepticism is warranted given a lack of successful funds
INTRODUCTION
In August 2018, we explored whether chasing factors like value or quality in the stock market was a profitable investing strategy. After all, most investors only allocate to factors once returns have started to look attractive. Our analysis focused on 25 equity factors, where we constructed a long-short portfolio by selecting the top and bottom 5 factors based on their performance over the last 12 months. We explored this across markets, and while returns were positive from 2002 to 2018, performance was inconsistent. However, there is no reason investors should limit themselves to equity factors: trend-following funds, also known as CTAs, pursue the same strategy using futures across asset classes.
In their 2023 paper “The Co-Pricing Factor Zoo“, Alexander Dickerson, Christian Julliard, and Philippe Mueller analyzed 18 quadrillion models for the joint pricing of bonds and stocks but identified only around 50 factors as robust sources of risk. The authors made this factor dataset publicly available, which we will use to further explore factor momentum.
FACTOR MOMENTUM
The dataset from Dickerson et al. covers 54 factors, categorized into equity factors, fixed income factors, and non-tradable factors. This includes well-known factors such as stock-based momentum and bond carry, as well as more esoteric ones like behavioral and inflation volatility. Returns are available from 1987 to 2022.
The excess return from the U.S. stock market is included as a factor, but we don’t want to trade equities, since there is already ample research on this. We therefore exclude all factors with a correlation greater than 0.75 with the stock market, reducing the universe to 47 factors.
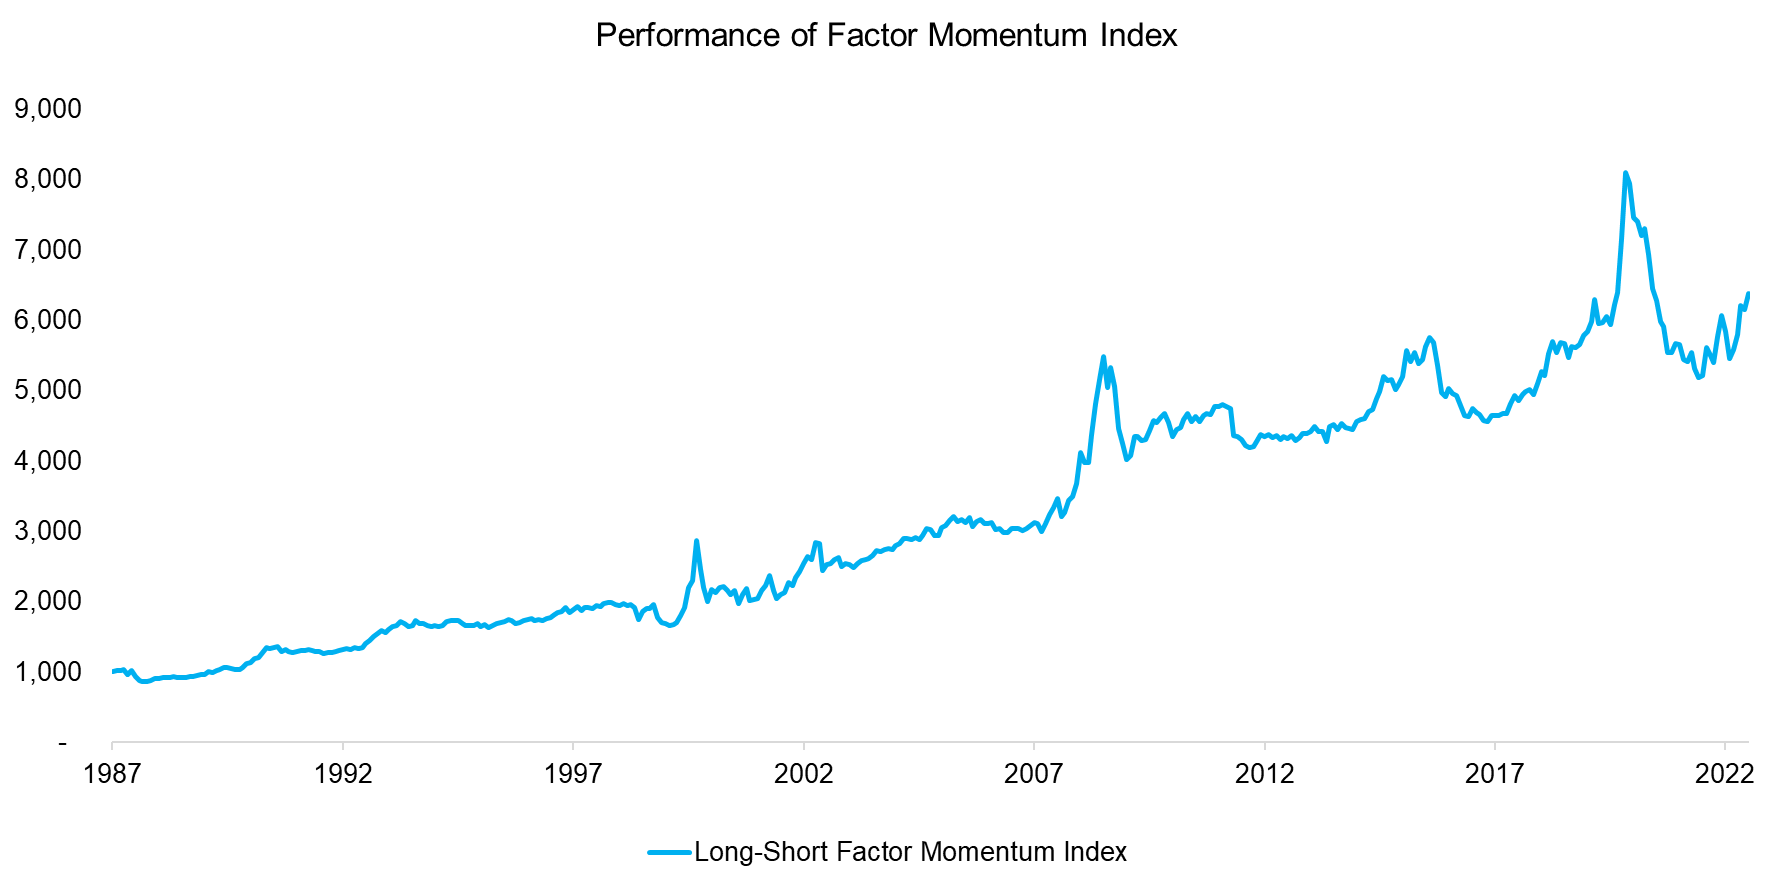
We create an index by selecting the top 5 performing factors based on the trailing 12-month performance for the long portfolio, while simultaneously shorting the five worst-performing factors. The portfolio is rebalanced monthly, and we assume 10 basis points of transaction costs.
The factor momentum index generated an excess return of 5.4% and relatively consistent returns between 1987 and 2008, with returns slightly less consistent thereafter. We observe strongly positive returns during the Global Financial Crisis in 2008 and the COVID-19 crisis in 2020, which suggests diversification potential.
Source: Finominal
BACKTEST STRESS TESTING
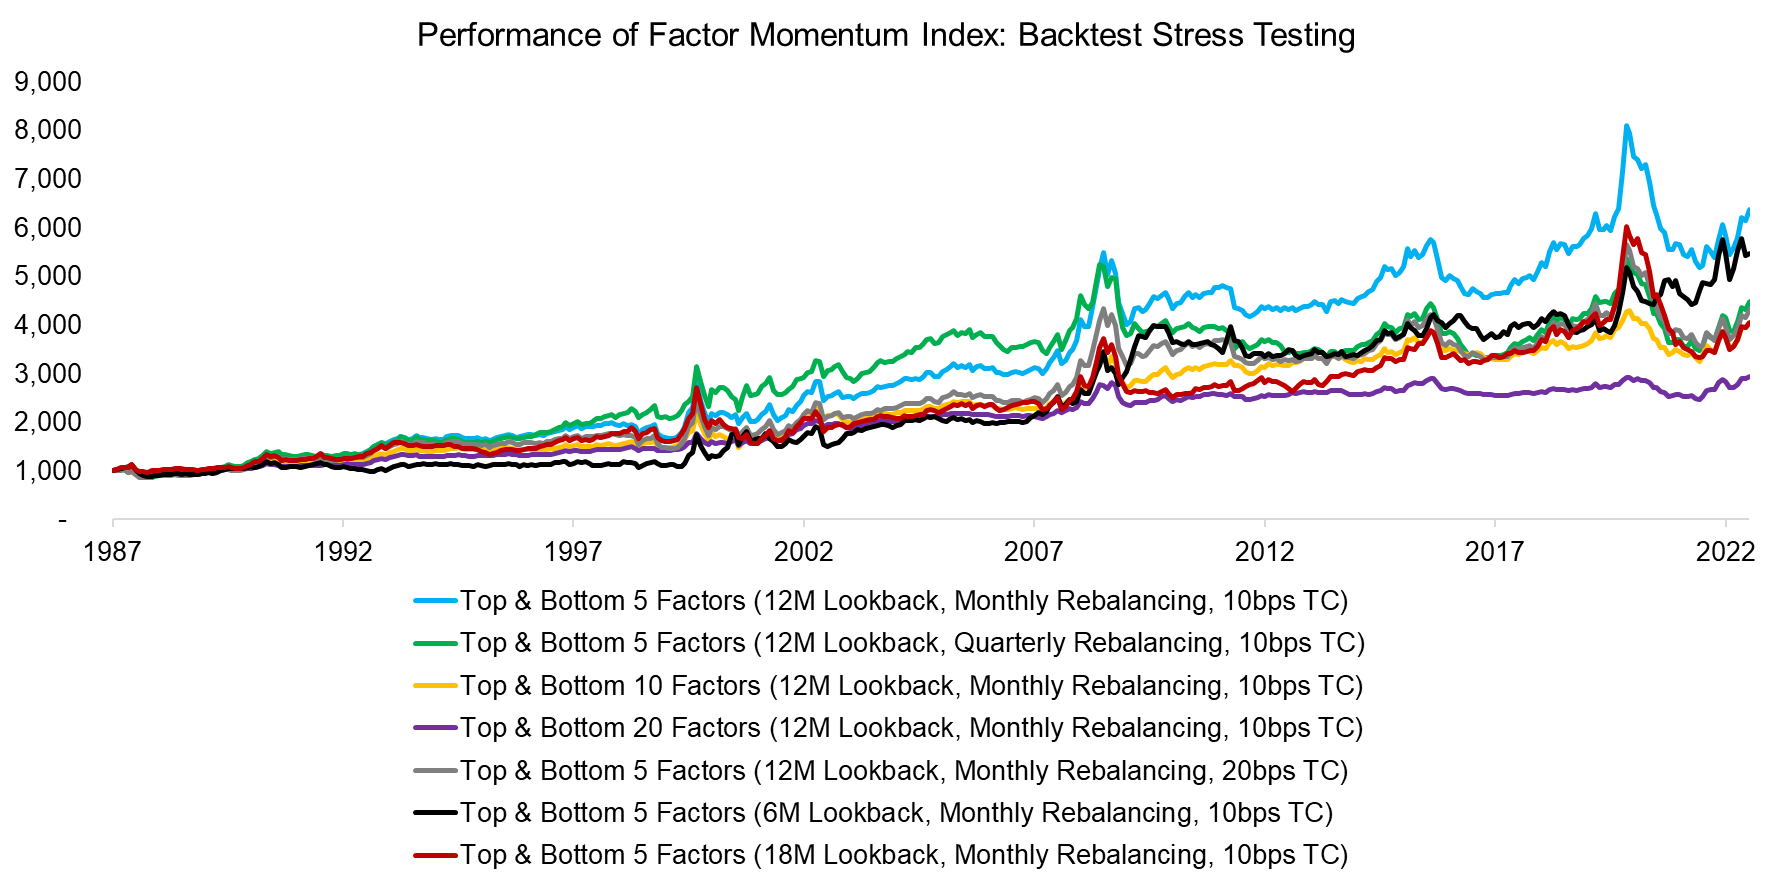
We stress-test the backtest by varying several parameters: transaction costs from 10 to 20 basis points, the number of factors from 5 to 20, the rebalancing frequency from monthly to quarterly, and the lookback period from 12 to 6 and 18 months. Overall, we find that performance trends remain consistent across these index variations, though CAGRs range from 3.1% to 5.4% between 1987 and 2022. For the remainder of this analysis, we continue with the original index, while acknowledging that it exhibits the highest returns.
Source: Finominal
BREAKDOWN BY ASSET CLASSES
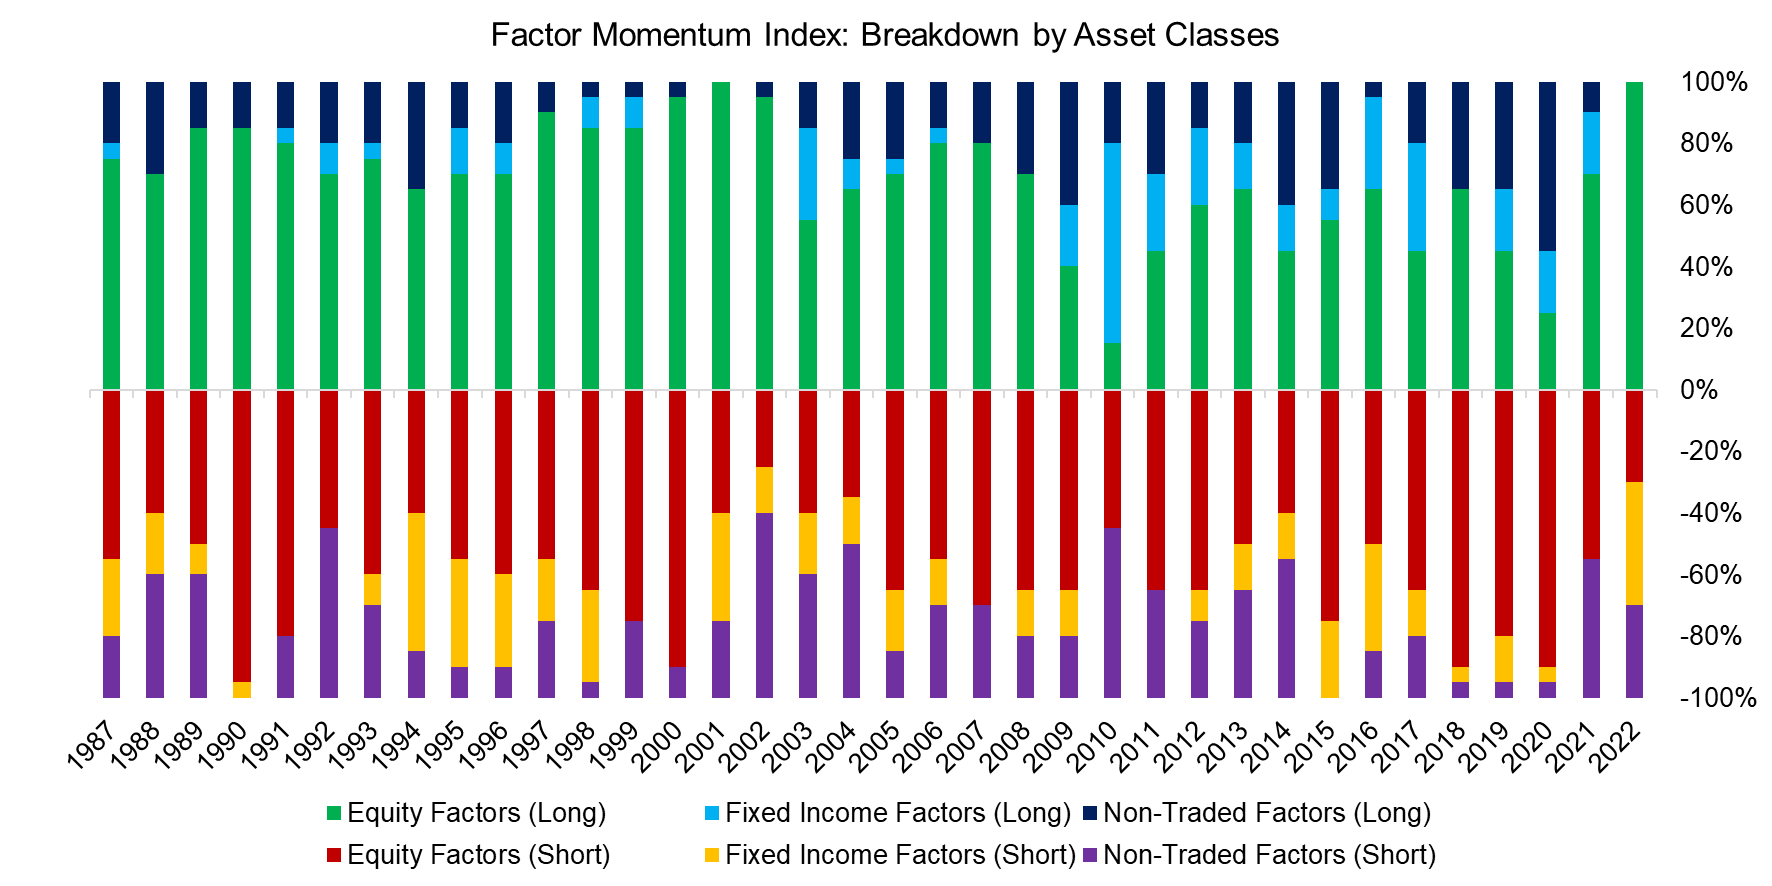
Next, we analyze the long and short portfolios over time to better understand the underlying strategies. We observe that equity factors consistently dominate both the long and short portfolios. Had non-tradable factors instead dominated the portfolios, we would have had to disregard the entire strategy, as implementation would have ranged from difficult to impossible.
Source: Finominal
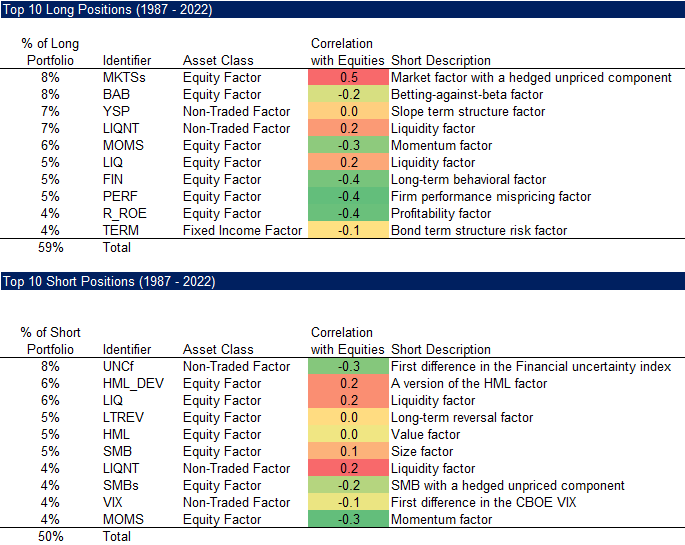
We drill further into the portfolios and highlight the top 10 long and short positions over time. We find that the top 10% of long positions accounted for 59% of the long portfolio over time, compared with 50% for the short portfolio. It is also worth highlighting that some factors, such as momentum (MOMS) and liquidity (LIQNT), appeared as both long and short positions.
Source: Finominal
QUANTIFYING DIVERSIFICATION BENEFITS
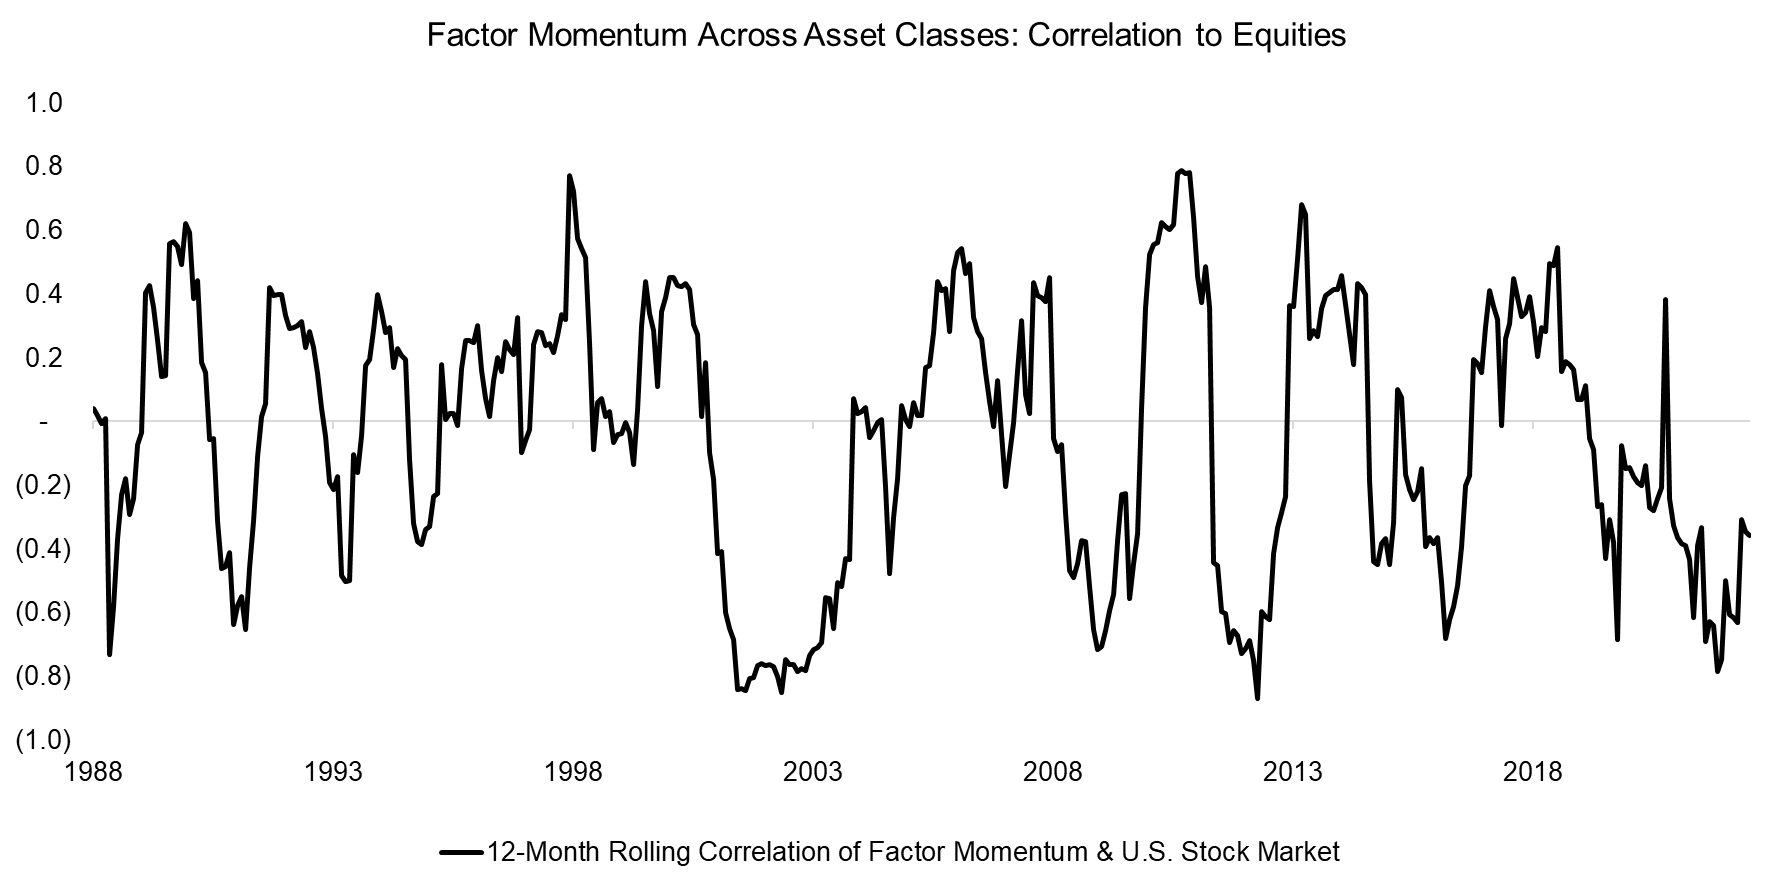
Finally, we compute the rolling 12-month correlation with the U.S. stock market, which ranged between -0.9 and 0.8. The strong returns during crisis periods are likely explained by the strategy’s shorting factors, which were strongly positively correlated with equities, and this also explains the drawdowns the index experienced when markets recovered, such as post-GFC in 2009.
Source: Finominal
FURTHER THOUGHTS
This analysis, like our previous research, confirms that momentum generates excess returns within equities, across asset classes, and across factors. Stated differently, trend following works.
Given that this strategy was lowly correlated with the stock market, it should be an attractive diversifier. However, there is a graveyard of funds that have tried to trade such quantitative strategies successfully. For example, the Simplify Multi-QIS Alternative ETF (QIS), which offers exposure to such strategies, has lost approximately 60% over the past 3 years since its July 2023 launch. The more complex a quant strategy, the larger the gap between theoretical and realized returns tends to be.
REFERENCED RESEARCH
The Co-Pricing Factor Zoo, Alexander Dickerson, Christian Julliard, and Philippe Mueller, 2023
RELATED RESEARCH
Factor Momentum
Momentum Investing on Country Level
Sector versus Country Momentum
Value, Momentum & Carry Across Asset Classes
Absolute versus Relative Momentum Across Asset Classes
Risk versus Momentum-based Equity Allocation
Trend Following in Equities II
Trend Following in Equities
Trend Following in Bear Markets
CTAs: With or Without Trend Following in Equities?
Managed Futures vs Factor Investing: A 100-Year Perspective
Bonds vs. Managed Futures: A 100-Year Perspective
Trend Following & Factor Investing – Unexpected Cousins?
Managed Futures versus Market-Neutral Multi-Factor Investing
How Much Should You Allocate to Managed Futures?
Combining Risk-Managed Equities and Managed Futures – II
Combining Risk-Managed Equities and Managed Futures
Carry versus Trend Following
Replicating a CTA via Factor Exposures
Creating a CTA from Scratch – II
CTAs vs Global Macro Hedge Funds
Managed Futures: The Empire Strikes Back
Managed Futures: Fast & Furious vs Slow & Steady
Hedging via Managed Futures Liquid Alts
ABOUT THE AUTHOR
Nicolas Rabener is the CEO & Founder of Finominal, which empowers professional investors with data, technology, and research insights to improve their investment outcomes. Previously he created Jackdaw Capital, an award-winning quantitative hedge fund. Before that Nicolas worked at GIC and Citigroup in London and New York. Nicolas holds a Master of Finance from HHL Leipzig Graduate School of Management, is a CAIA charter holder, and enjoys endurance sports (Ironman & 100km Ultramarathon).
Connect with me on LinkedIn or X.