Factor Olympics 1H 2020
And the winner Is…
July 2020. Reading Time: 10 Minutes. Author: Nicolas Rabener.
SUMMARY
- Momentum & Quality are leading the performance scoreboard in 1H 2020
- Value & Size generated negative returns, like in recent years
- Low Volatility failed to preserve capital during the COVID-19 crisis
INTRODUCTION
We present the performance of five well-known factors on an annual basis for the last 10 years. We only present factors where academic research supports the existence of positive excess returns across market cycles and asset classes. Strategies like Growth might be widely-followed investment styles, but lack academic support to be considered a factor and are therefore excluded (read Factor Olympics Q1 2020).
METHODOLOGY
Our factors are created by constructing long-short beta-neutral portfolios of the top and bottom 10% of stocks in the US, Europe and Japan, and 20% in smaller markets. Only stocks with a minimum market capitalization of $1 billion are included. Portfolios rebalance monthly and transactions incur 10 basis points of costs.
FACTOR OLYMPICS: GLOBAL
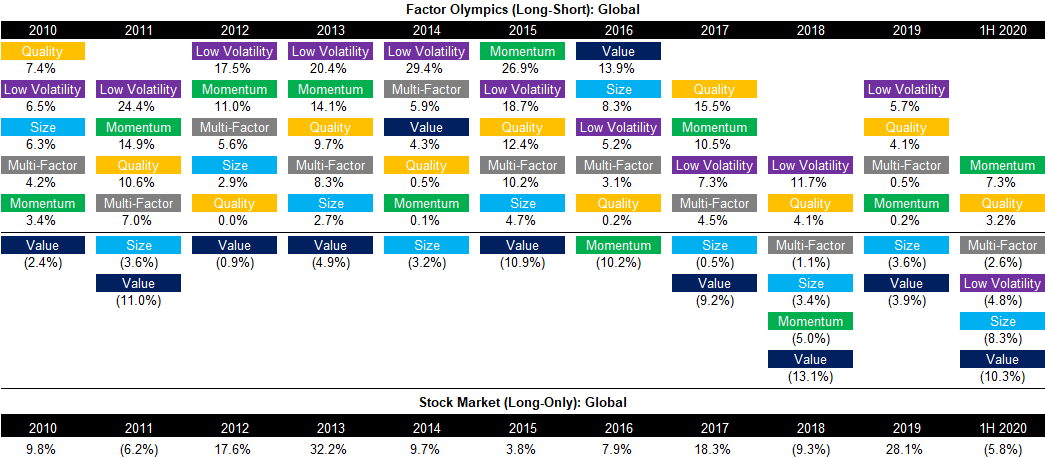
The table below shows the long-short factor performance for the last 10 years ranked top to bottom. The global series is comprised of all developed markets in Asia, Europe, and the US. Aside from displaying the factor performance, the analysis highlights the significant factor rotation in terms of profitability from one year to the next, highlighting the benefits of diversified exposure.
2018 and 2019 were considered challenging years for factor investing as diversified multi-factor portfolios generated low to negative returns. To complicate things further, the first half of 2020 was even more difficult. Value, Size, and Low Volatility yielded negative performance, which was not compensated by the positive returns of the Momentum and Quality factors, resulting in negative performance for a classic multi-factor portfolio.
Source: FactorResearch
FACTOR PERFORMANCE 1H 2020: GLOBAL
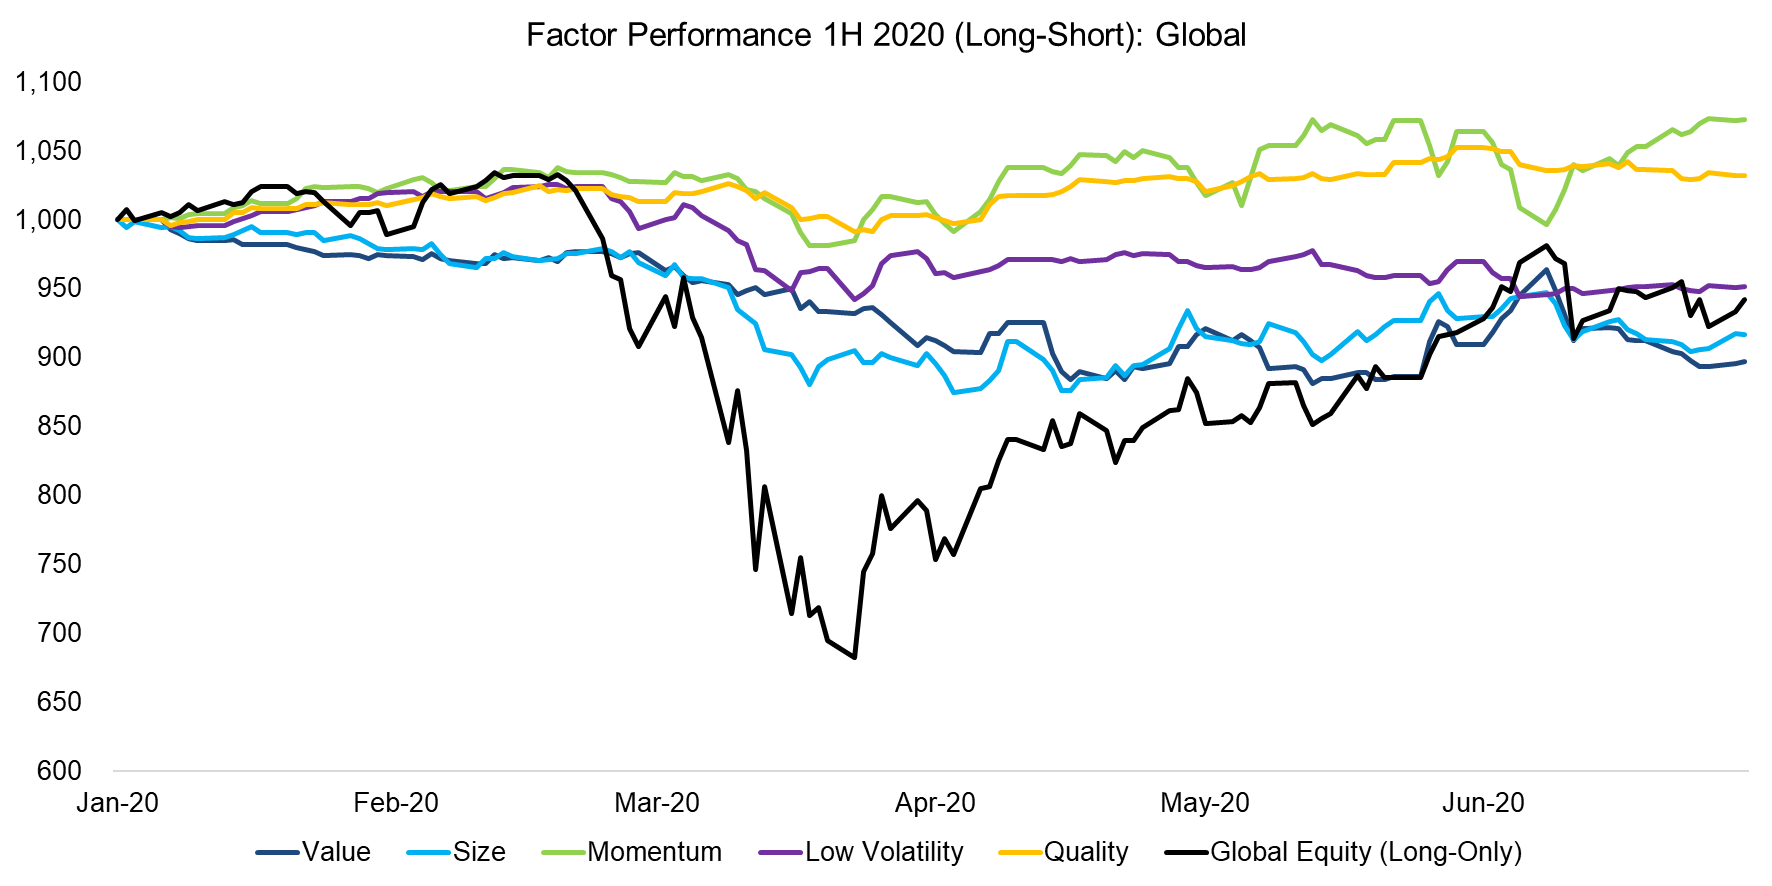
Markets are fascinating as they consistently surprise investors with unexpected and often seeming illogical behavior. Very few, if any investors, expected a global pandemic in 2020, and even fewer would have expected stock markets to be only slightly down when the pandemic is nowhere near under control. Even more, the tech-heavy Nasdaq is up almost 20% year-to-date, which seems somewhat surreal given the circumstances.
Equally surprisingly is that most factors, even those associated with capital protection like Quality or Low Volatility, declined when stock markets crashed in the first quarter of 2020, although both factors recovered thereafter. Value and Size have been consistently generating negative returns since the beginning of the year and the COVID-19 crisis simply accelerated the decline.
Source: FactorResearch
FACTOR PERFORMANCE 1H 2020: US
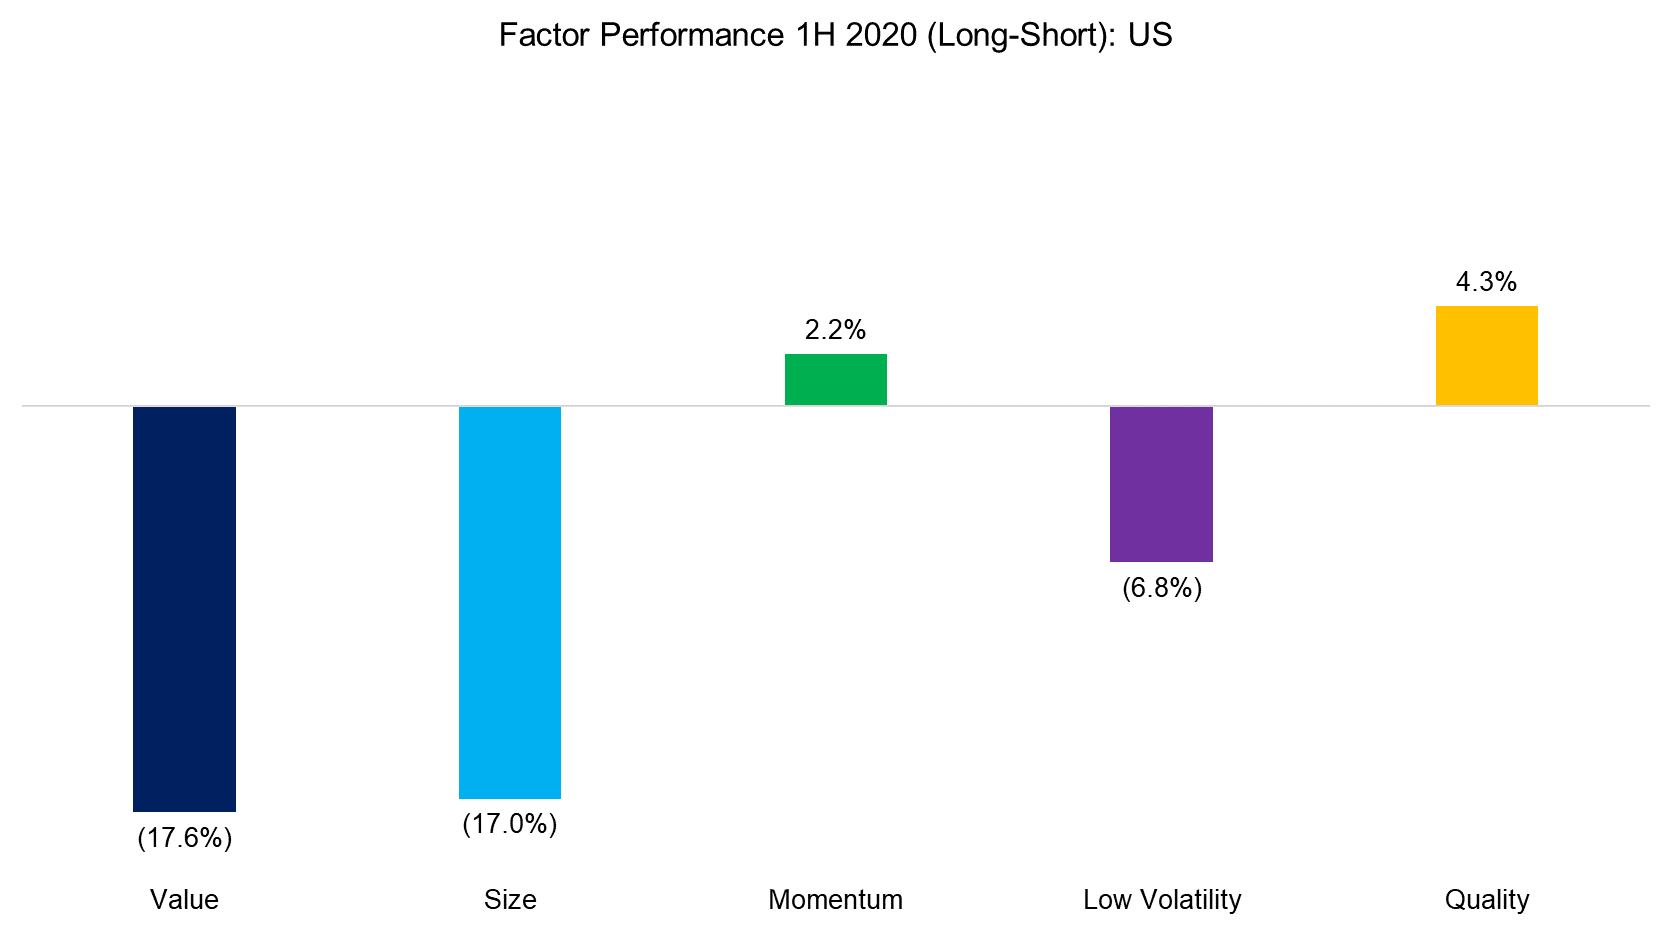
Global portfolios are significantly weighted towards the US, so it is not surprising that factor performance in the US is alike to the global returns.
Cheap and small-cap stocks significantly underperformed expensive and large-cap stocks in the US, which is expected as they represent riskier stocks that investors tend to sell off first when concerned about the economic outlook. With this backdrop, investors also sought refuge in companies with solid fundamentals, so it was not surprising to see Quality do better than Value or Size.
However, cheap and small stocks typically also recover with markets, which has not happened yet. This disappointing performance can be partially attributed to the short side of Value and Size portfolios since companies these factors usually dislike or short (e.g. large and expensive technology stocks like Amazon) continued to perform strongly. The lack of recovery in these two factors can, therefore, be attributed to the short side of their portfolios.
Source: FactorResearch
FACTOR PERFORMANCE 1H 2020: EUROPE
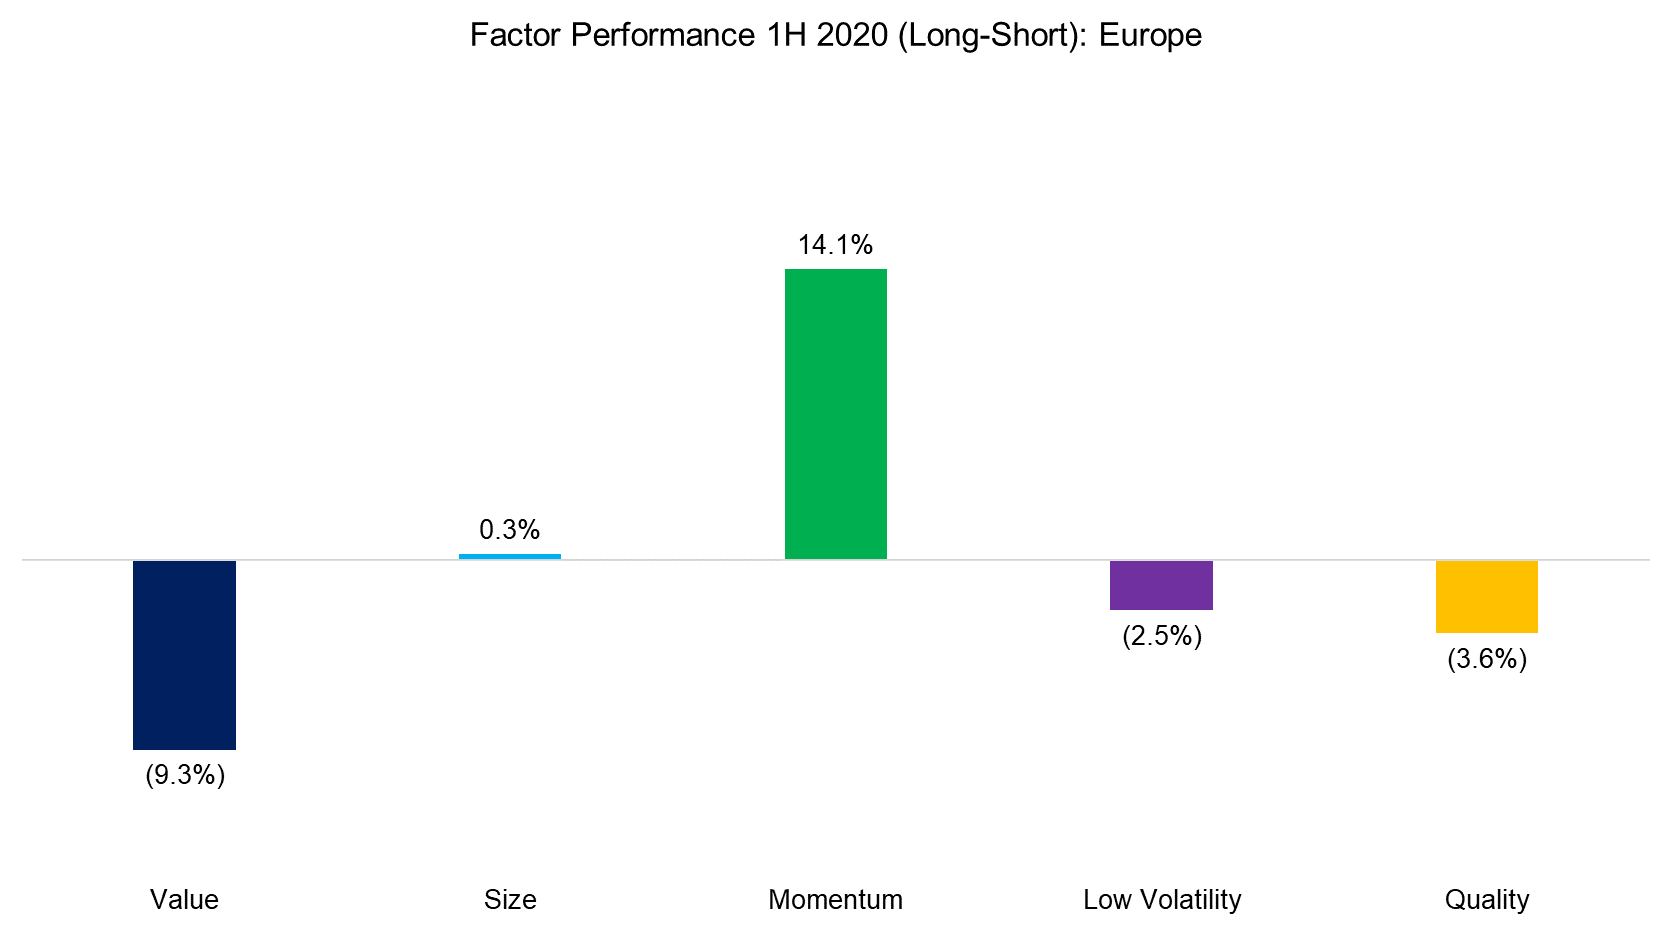
Factor performance in Europe is typically similar to the US in the direction of returns, which highlights that factors have the same performance drivers across markets.
However, in the first half of 2020, we observe some meaningful divergences. Small-caps outperformed large-caps in Europe, which likely reflects that European large caps tend to be exported-oriented firms that are severely impacted by reduced global demand for industrial goods, in contrast with the US, where large caps are dominated by tech stocks like Amazon that benefited more from the crisis than small-cap stocks.
Momentum performed strongly in Europe, and some of that performance can be attributed to the companies Momentum tends to dislike. For instance, European banks, almost perennial positions in the short portfolio, performed very poorly during the COVID-19 crisis. The EuroStoxx Bank index highlights the poor state of European banks as it is currently trading at a lower level than when it was created more than 33 years ago.
Source: FactorResearch
FACTOR PERFORMANCE 1H 2020: JAPAN
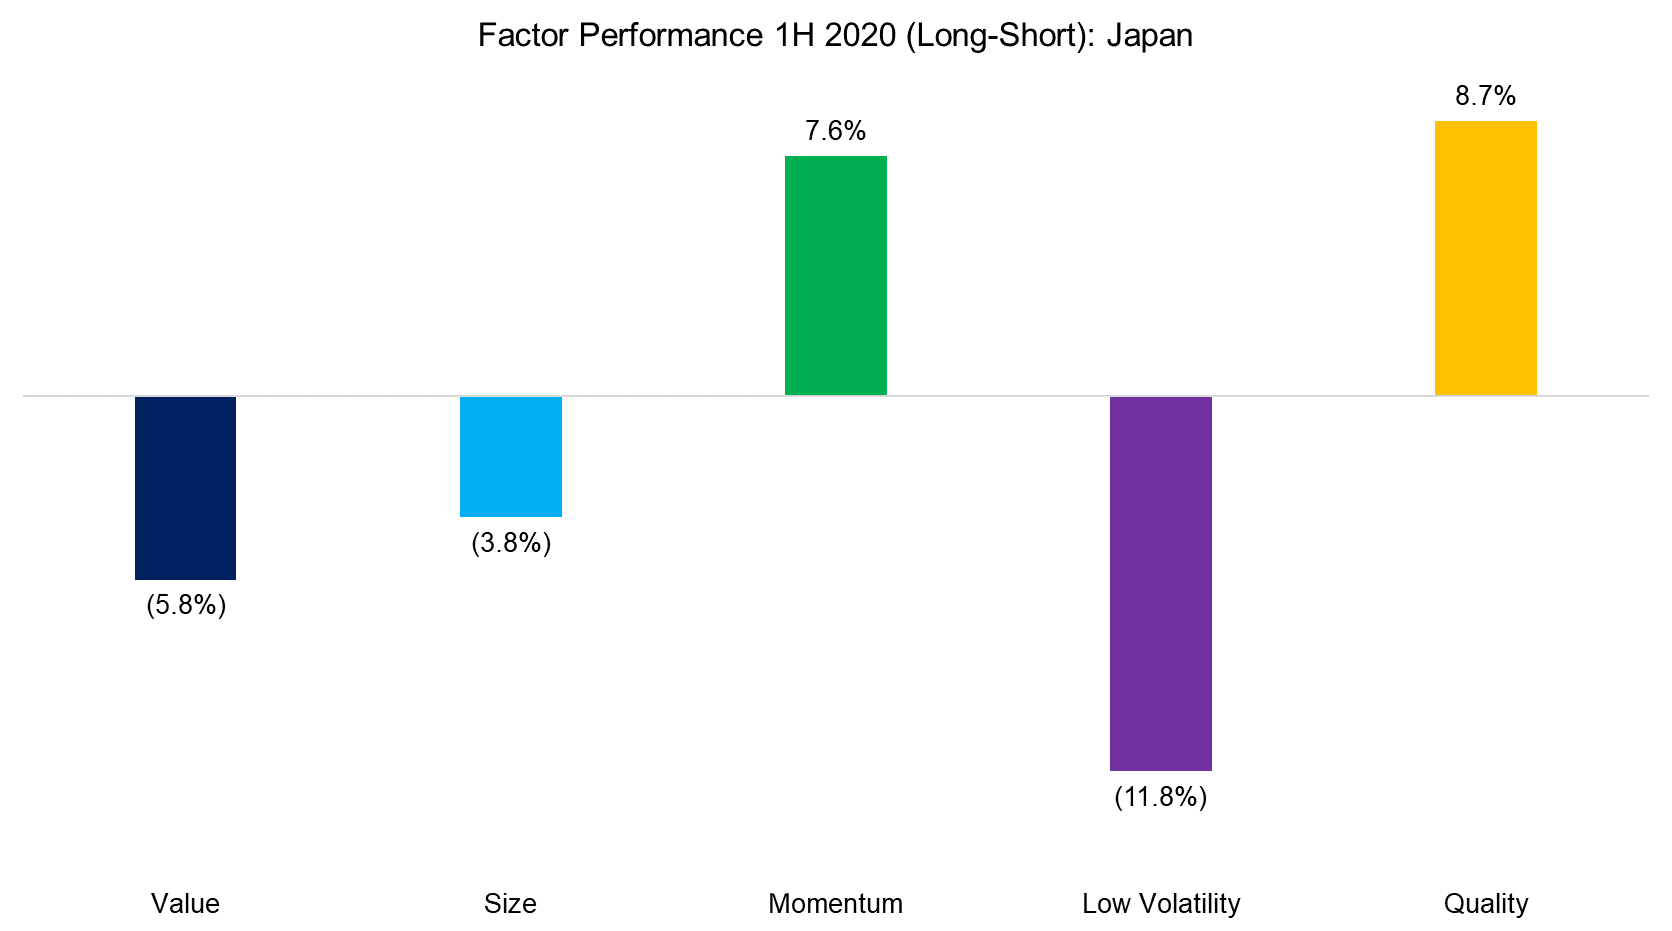
The long-term returns of common equity factors in the Japanese stock market have been lower than globally, but directionally the trends in performance were typically the same, e.g. Value in Japan mirrors Value globally.
The one factor in Japan worth highlighting is Low Volatility given exceptionally poor performance in a time when many investors where hoping for capital preservation characteristics from this strategy. Low-risk portfolios are typically dominated by what can be considered almost boring stocks from sectors like real estate. In contrast, high-risk portfolios tend to have a bias towards volatile technology stocks. The combination of being long real estate and short technology stocks expectedly did not perform well during a global pandemic.
Source: FactorResearch
FACTOR CORRELATIONS
The correlation matrix below highlights the global one-year factor correlations based on daily data. As of the first half of 2020, there are a couple of interesting observations. First, the correlation structure is ‘normal’, i.e., we have not seen correlations spike to 1. Value and Momentum continue to show a negative correlation around -0.5. This correlation structure implies risks and opportunities for multi-factor portfolios. Specifically, we observe that Momentum was highly correlated to the Quality factor while being negatively correlated to Value. Second, the correlation between small-caps and cheap stocks has been increasing. Naturally, investors can and should consider these relationships when constructing or investing in multi-factor products.

Source: FactorResearch
LONG-SHORT MULTI-FACTOR PRODUCTS
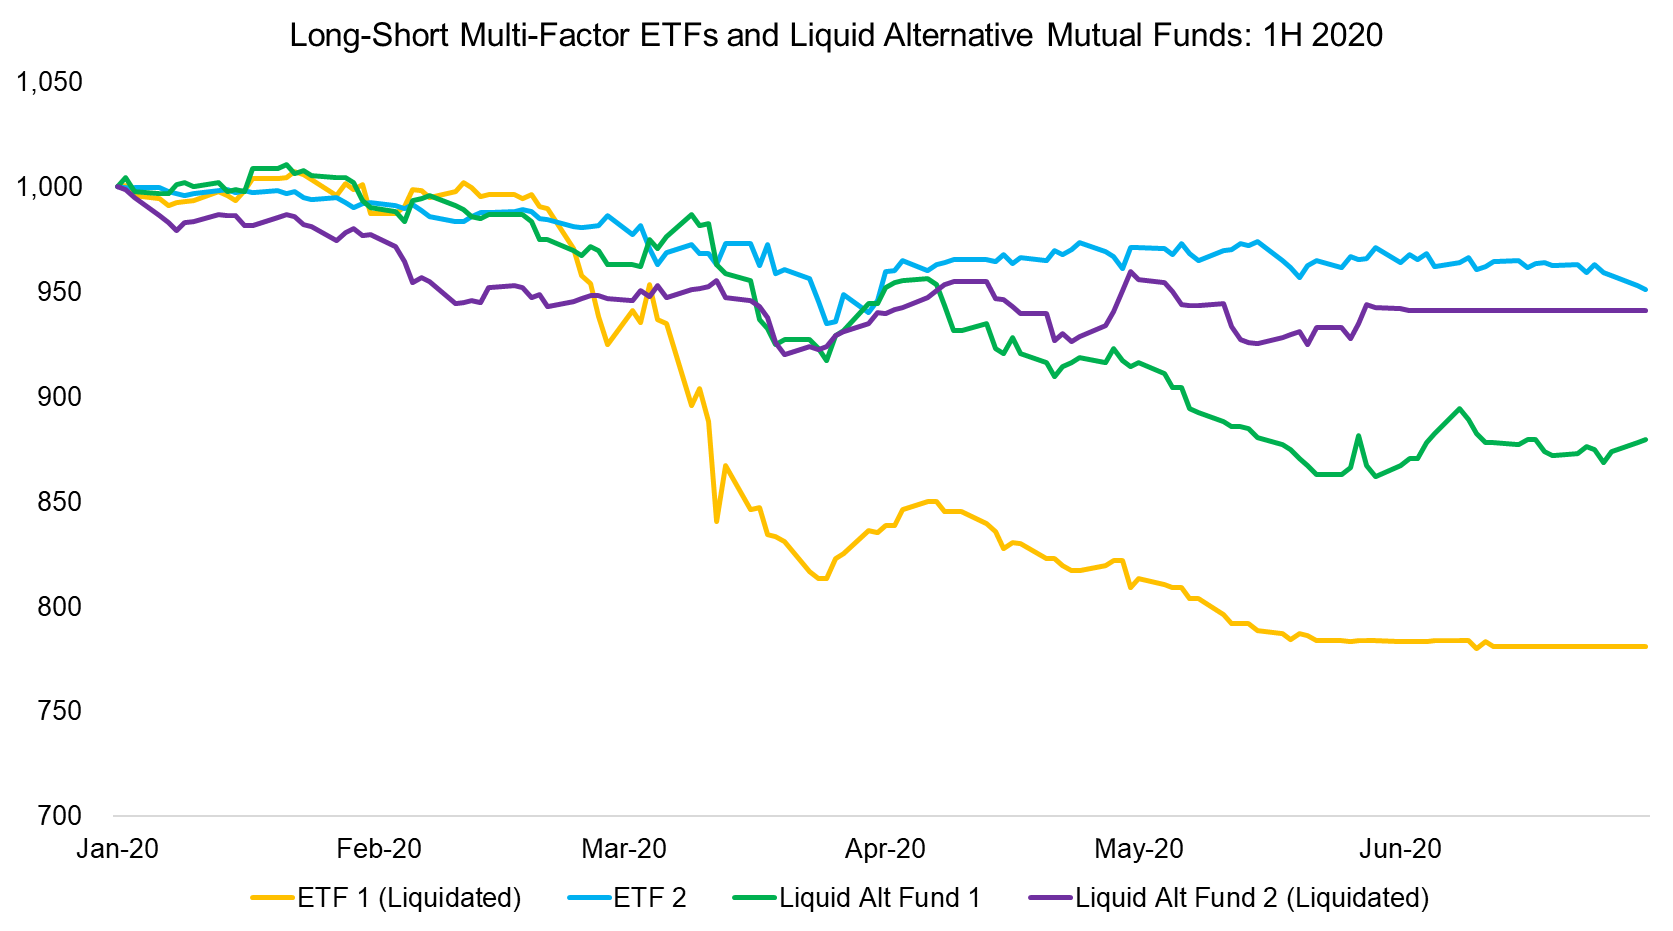
Finally, we analyze the performance of long-short multi-factor ETFs and liquid alternative mutual funds in the US and Europe. The returns in the first half of 2020 were negative, mirroring the theoretical factor performance (read Multi-Factor Smart Beta ETFs).
It is worth noting that these products have been consistently declining since the beginning of 2018, which made factor investing challenging over the last few years. Two of the four products have been liquidated in June 2020 and the two remaining ones have seen their assets under management decline by more than 90%, which makes them prime candidates for fund closure.
The demise of these products is unfortunate as they represent one of the few options for non-institutional investors to access long-short multi-factor exposure via liquid, transparent, and relatively cheap vehicles.
Source: FactorResearch
FURTHER THOUGHTS
Factor investing has been experiencing a death by a thousand cuts over the last two years given the consistently negative performance of multi-factor investing. Although investors have redeemed a significant amount of capital from long-short products in the space, smart beta still seems popular, likely because the underperformance is not as visible given that equity beta dominates the returns.
However, despite the pain, there is no clear alternative to factor investing for investors that want to generate outperformance. Active managers have disappointed over much longer time frames and there is little reason to believe that this will change. Given the choice between plain and smart beta for most investors, investors need to acknowledge that investing smartly does not seem particularly smart for extended periods of time.
RELATED RESEARCH
How to Evaluate Smart Beta ETFs
ABOUT THE AUTHOR
Nicolas Rabener is the CEO & Founder of Finominal, which empowers professional investors with data, technology, and research insights to improve their investment outcomes. Previously he created Jackdaw Capital, an award-winning quantitative hedge fund. Before that Nicolas worked at GIC and Citigroup in London and New York. Nicolas holds a Master of Finance from HHL Leipzig Graduate School of Management, is a CAIA charter holder, and enjoys endurance sports (Ironman & 100km Ultramarathon).
Connect with me on LinkedIn or X.

