Factor Olympics 2017
And the winner is…
January 2018. Reading Time: 10 Minutes. Author: Nicolas Rabener.
SUMMARY
- 2017 was a positive year for most factors
- Quality, Growth and Momentum showed the strongest performance
- Value, Dividend Yield and Size generated negative returns
INTRODUCTION
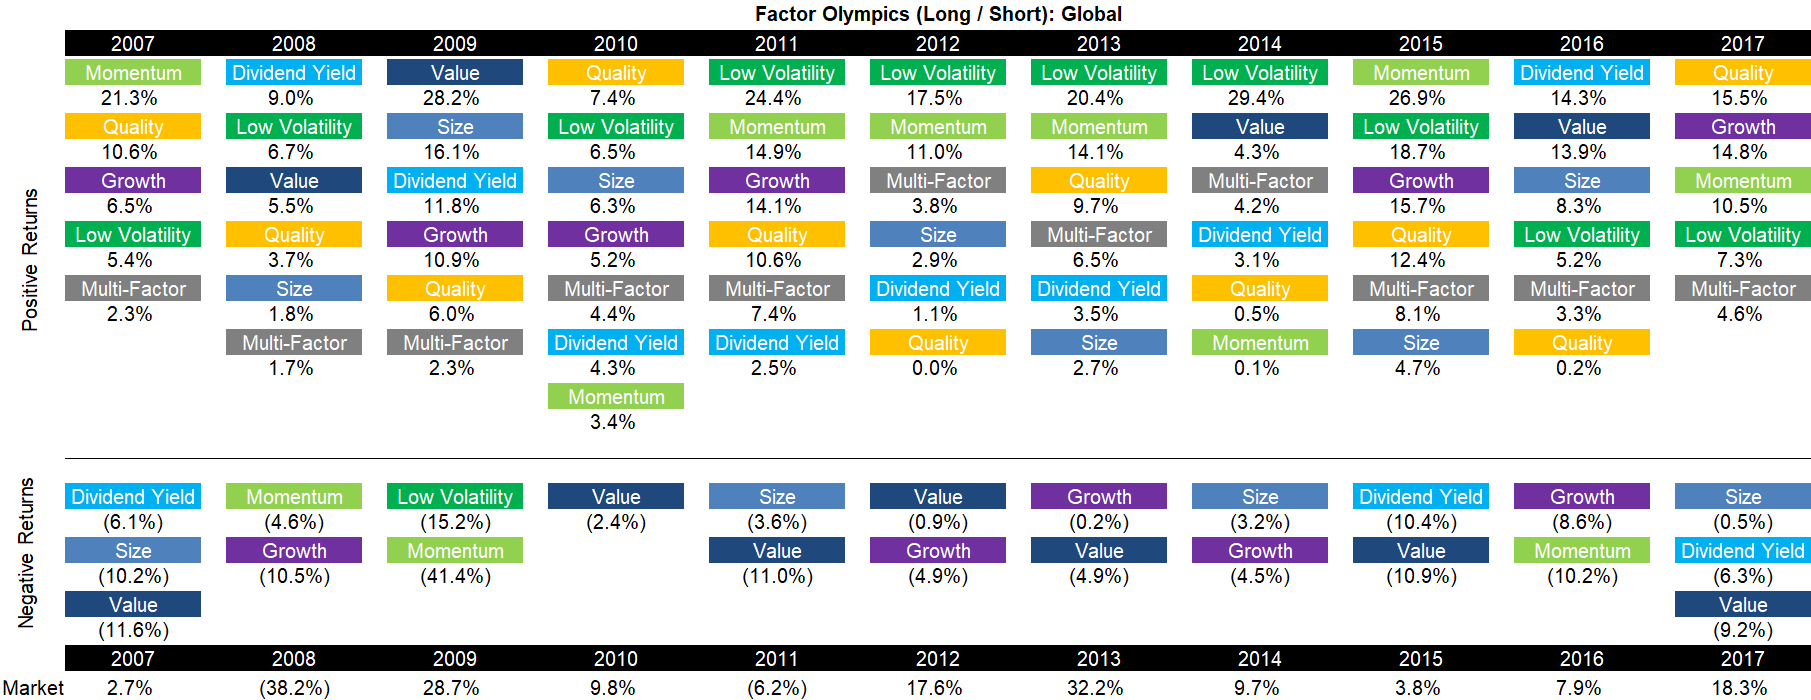
We present the performance of seven well-known factors on an annual basis for the last 10 years and the full-year 2017. It is worth mentioning that not all factors have strong academic support, e.g. Growth lacks a long-term track record of positive excess returns; however, is still a widely-followed investment style.
METHODOLOGY
The factors are created by constructing long-short beta-neutral portfolios of the top and bottom 10% of stocks in the US, Europe and Japan and 20% in smaller stock markets. Portfolios rebalance monthly and include 10bps of transaction costs.
FACTOR OLYMPICS (LONG / SHORT): GLOBAL
The table below shows the factor performance for the last 10 years ranked top to bottom. The global series is comprised of all developed markets in Asia, Europe and the US. Aside from displaying the factor performance the analysis highlights the significant factor rotation in terms of profitability from one year to the next, e.g. last year’s winners Dividend Yield, Value and Size, are this year’s losers. Factor investing has been at its all-time high in 2017 in terms of popularity according to Google Trends, but factor selection and factor timing are challenging subjects (read Factor Olympics: Q3 2017).
Source: FactorResearch
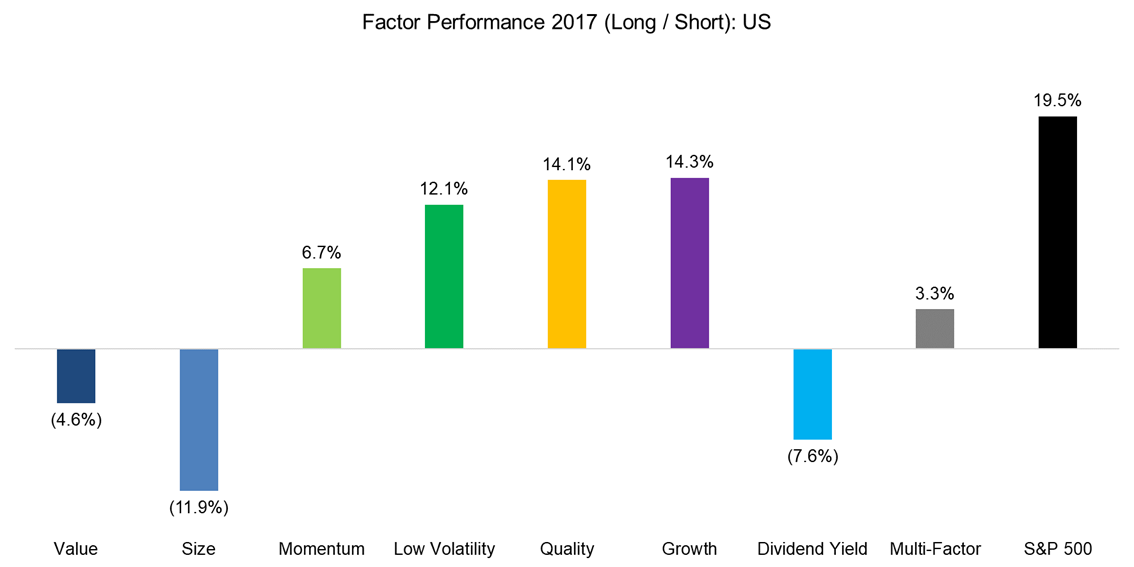
FACTOR PERFORMANCE 2017: US
The table above reflects the global factor performance and it is interesting to analyse how homogeneous the performance is across regions. The global performance is significantly weighted towards the US, so it is not surprising that factor performance in the US in 2017 is very similar to the global one. Value and Size were the consensus trades at the beginning of 2017, but generated the worst returns throughout the year, which highlights the risk of following the consensus.
Source: FactorResearch
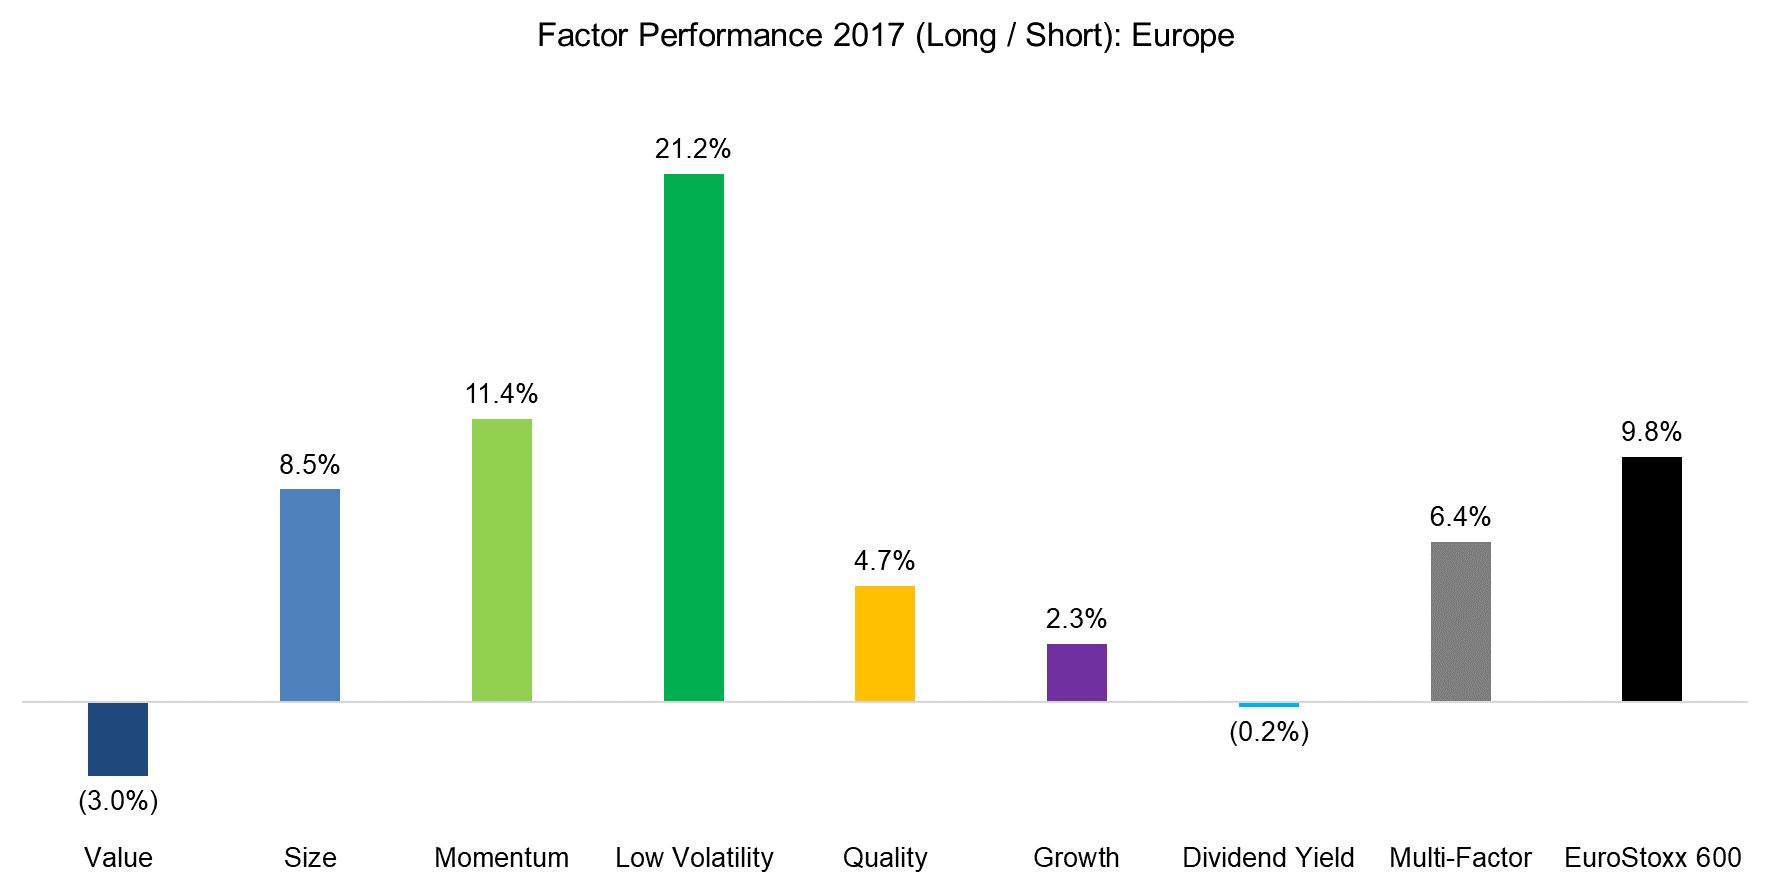
FACTOR PERFORMANCE 2017: EUROPE
The factor performance in Europe is similar to the US, except for Size, which was negative in the US, but is strongly positive in Europe, perhaps reflecting the more positive economic outlook for the region. Low Volatility generated the highest returns, which may be explained by the continued quantitative easing of the ECB as the strategy performs better when interest rates are declining than when they are rising.
Source: FactorResearch
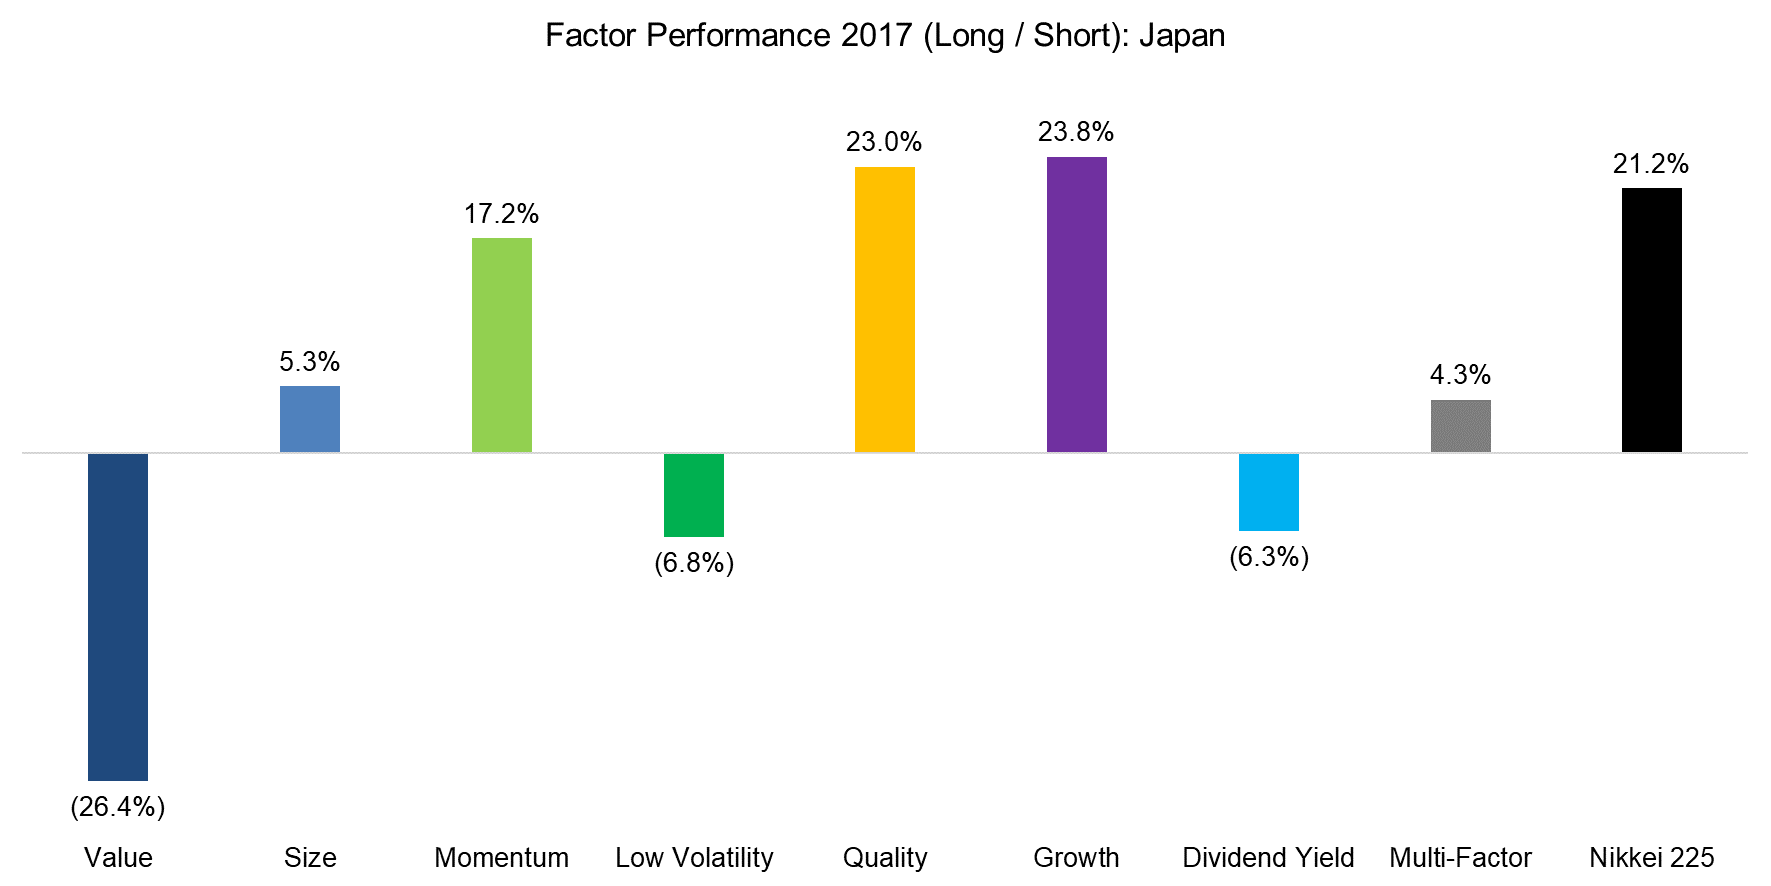
FACTOR PERFORMANCE 2017: JAPAN
Japan is often treated as a special case in the factor investing space as some strategies, e.g. Momentum, don’t work as well as in other countries. We noted in a previous report “Equity Factors in Japan” that although factor performance may be less strong, the trends are still roughly the same. In the chart below we can also observe that the factor performance in Japan is line with other markets, except for Low Volatility.
Source: FactorResearch
FACTOR PERFORMANCE 2017: PERFORMANCE CHART
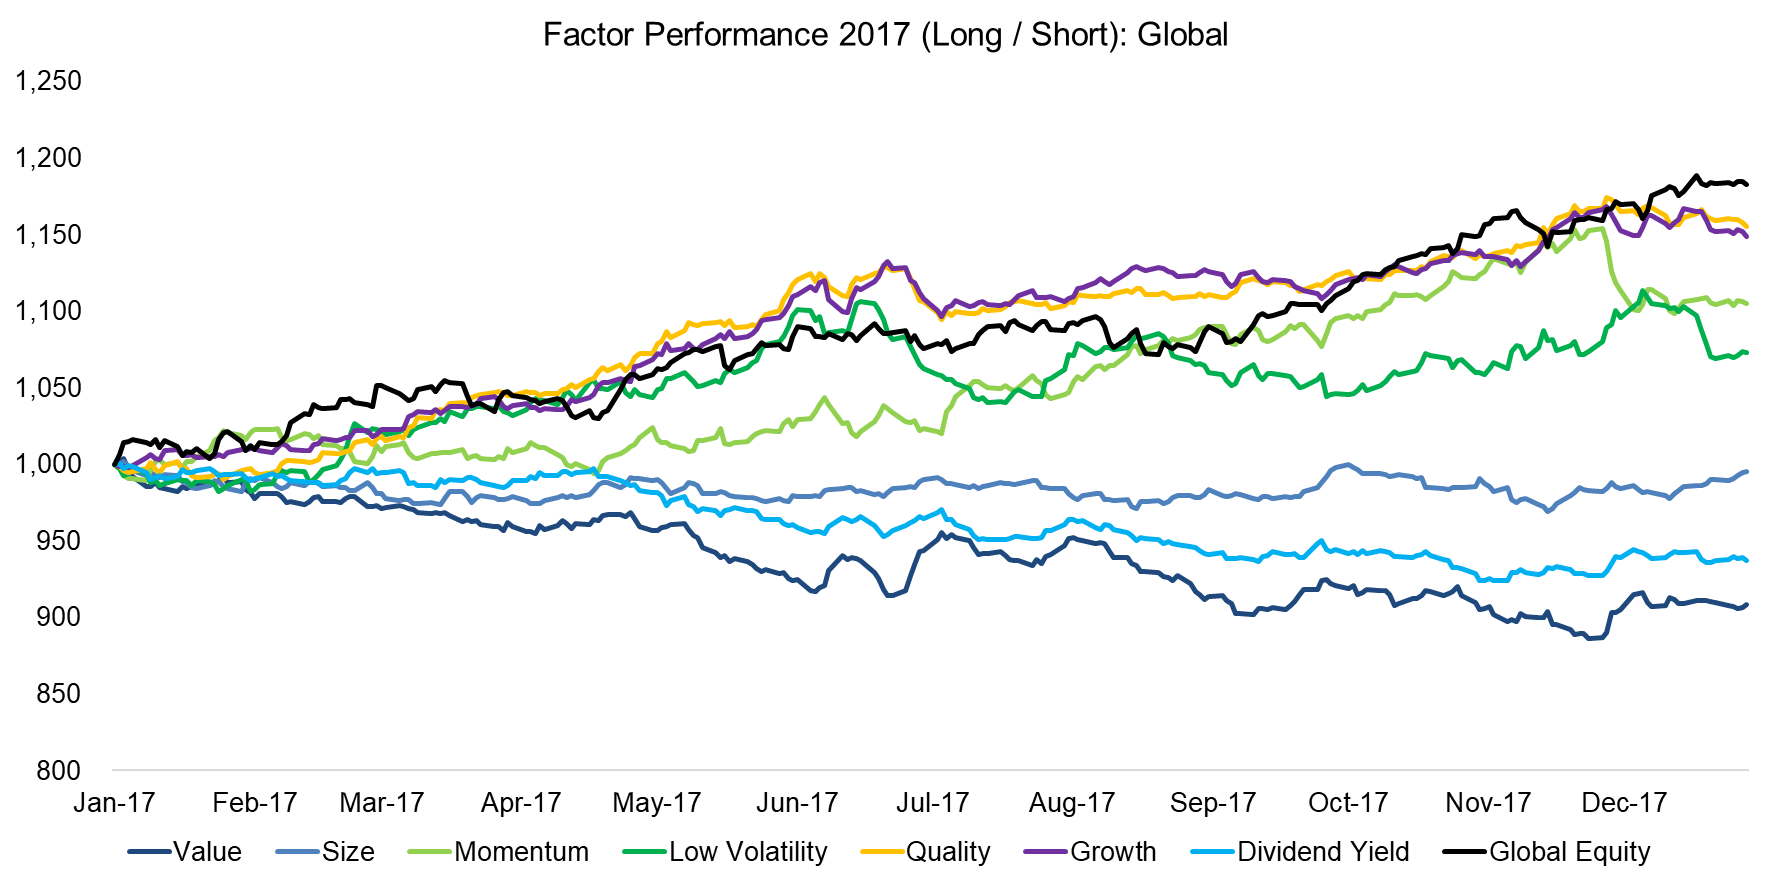
The chart below shows the factor performance in 2017 and we can observe that Quality and Growth seem almost identical, which can be explained by the Tech sector representing a significant percentage of the long portfolios in both factors. The Tech sector has shown strong growth in sales and earnings over the last few years and also features high profitability and low levels of debt compared to other industries, which explains why the sector is represented in the Quality and Growth factors.
Source: FactorResearch
The correlation matrix below highlights the strong relationship between Quality and Growth, which might be considered a portfolio risk. If the Tech sector starts underperforming, this will likely have a negative impact for both factors. Dividend Yield and Value show negative correlations to both and may be attractive from a diversification perspective.

Source: FactorResearch
FURTHER THOUGHTS
The factor performance in 2017 has been very consistent throughout the year with Quality and Growth steadily gaining compared to Value and Dividend Yield losing. The low factor volatility and consistency is likely a reflection of the exceptionally low market and economic volatility; however, these periods don’t tend to last long and investors should expect higher market and factor volatility in 2018.
ABOUT THE AUTHOR
Nicolas Rabener is the CEO & Founder of Finominal, which empowers professional investors with data, technology, and research insights to improve their investment outcomes. Previously he created Jackdaw Capital, an award-winning quantitative hedge fund. Before that Nicolas worked at GIC and Citigroup in London and New York. Nicolas holds a Master of Finance from HHL Leipzig Graduate School of Management, is a CAIA charter holder, and enjoys endurance sports (Ironman & 100km Ultramarathon).
Connect with me on LinkedIn or X.

