Factor Olympics 2018
And the Winner is…
January 2019. Reading Time: 10 Minutes. Author: Nicolas Rabener.
SUMMARY
- 2018 was negative for classic multi-factor portfolios
- Low Volatility generated the best and Value the worst performance
- Factor performance was homogenous across global markets
INTRODUCTION
We present the performance of five well-known factors on an annual basis for the last 10 years, including 2018. We only present factors where academic research highlights positive excess returns across market cycles. Other factors like Growth might be widely-followed investment styles, but lack academic support and are therefore excluded (read Factor Olympics Q3 2018).
METHODOLOGY
The factors are created by constructing long-short beta-neutral portfolios of the top and bottom 10% of stocks in the US, Europe and Japan, and 20% in smaller markets. Only stocks with a minimum market capitalisation of $1 billion are included. Portfolios rebalance monthly and transactions incur 10 basis points of costs.
FACTOR OLYMPICS: GLOBAL
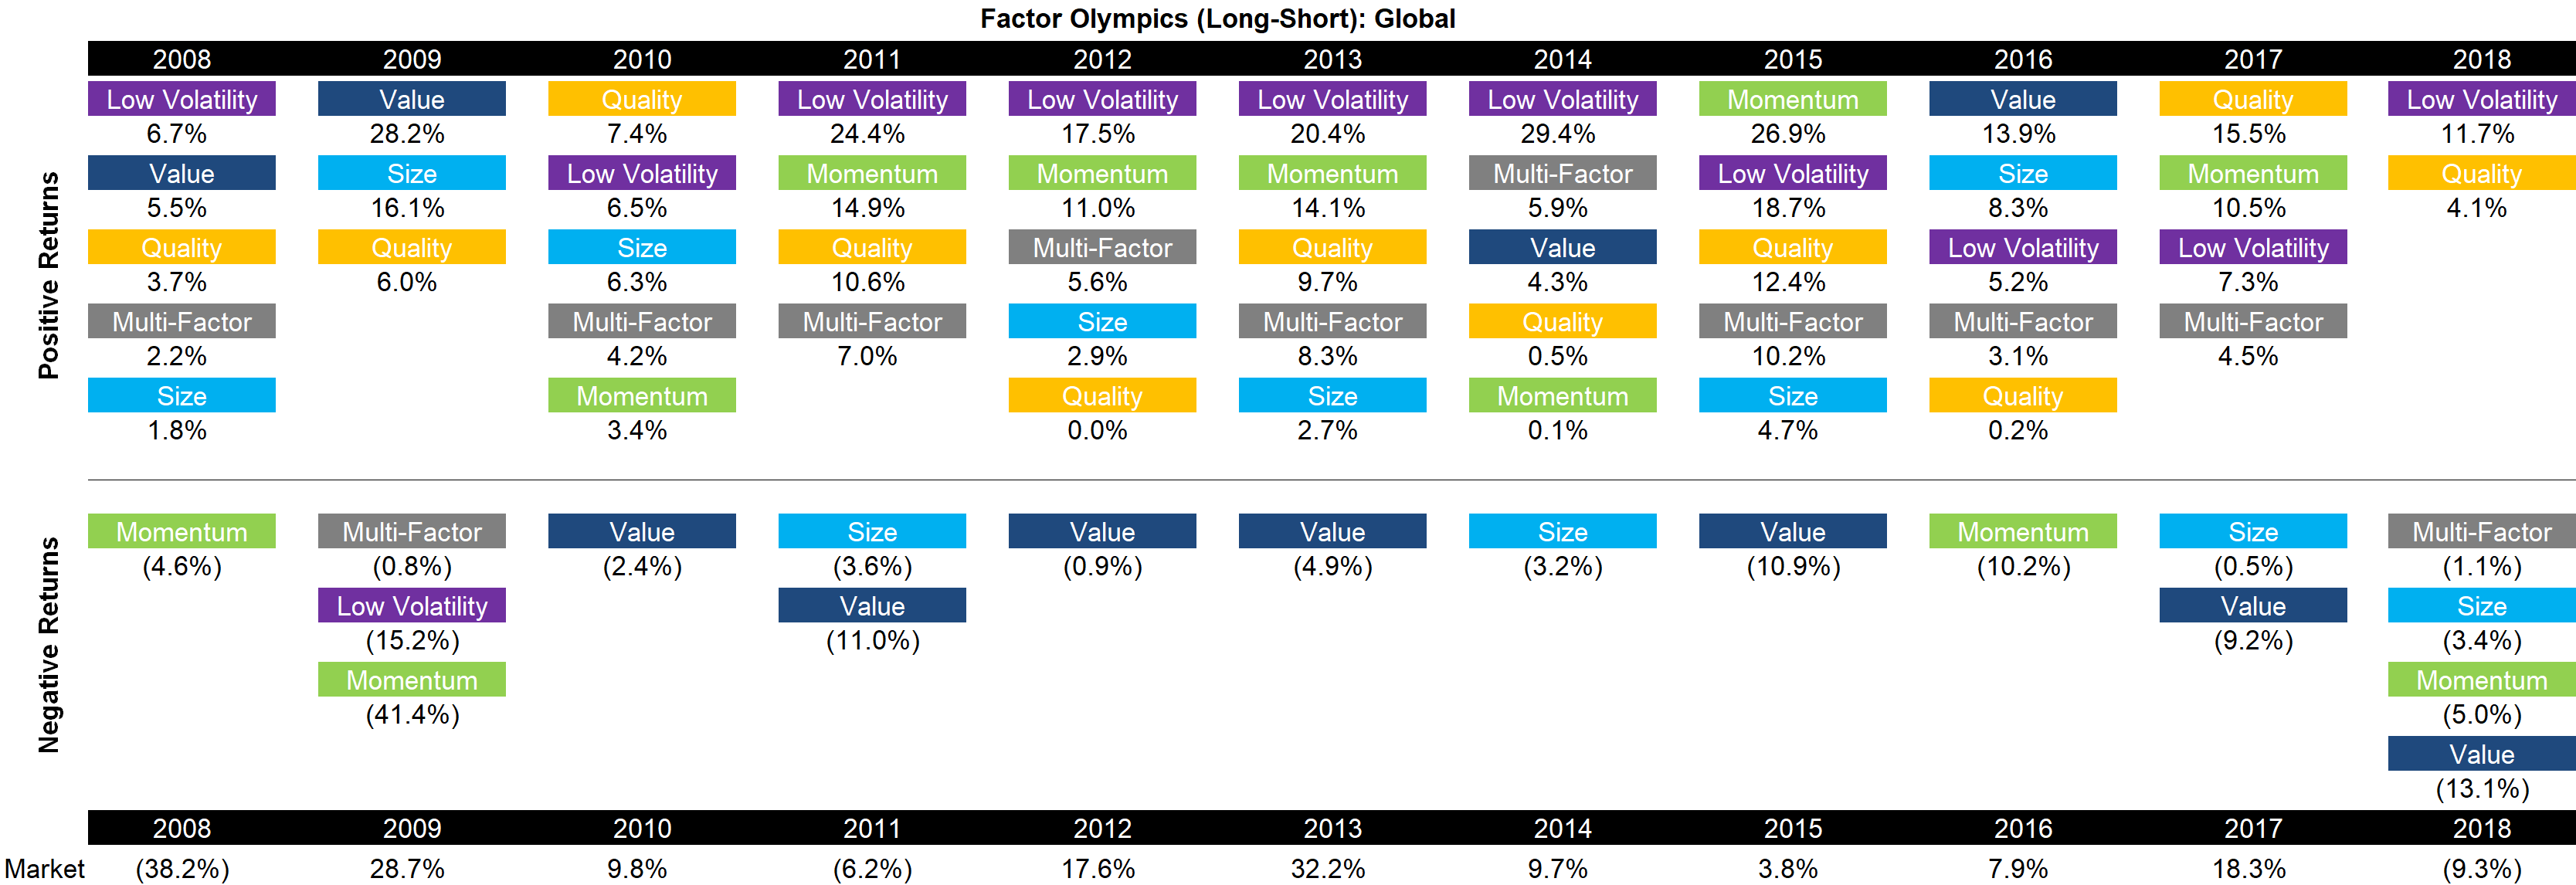
The table below shows the long-short factor performance for the last 10 years ranked top to bottom. The global series is comprised of all developed markets in Asia, Europe, and the US. Aside from displaying the factor performance, the analysis highlights the significant factor rotation in terms of profitability from one year to the next.
The year 2018 can be characterized as unusual as classic multi-factor portfolios were negative, which happens rarely. Most multi-factor smart beta ETFs or funds feature a combination of Value, Momentum, Quality, and Size. Out of those four factors, only Quality was positive.
Source: FactorResearch
FACTOR PERFORMANCE 2018: GLOBAL
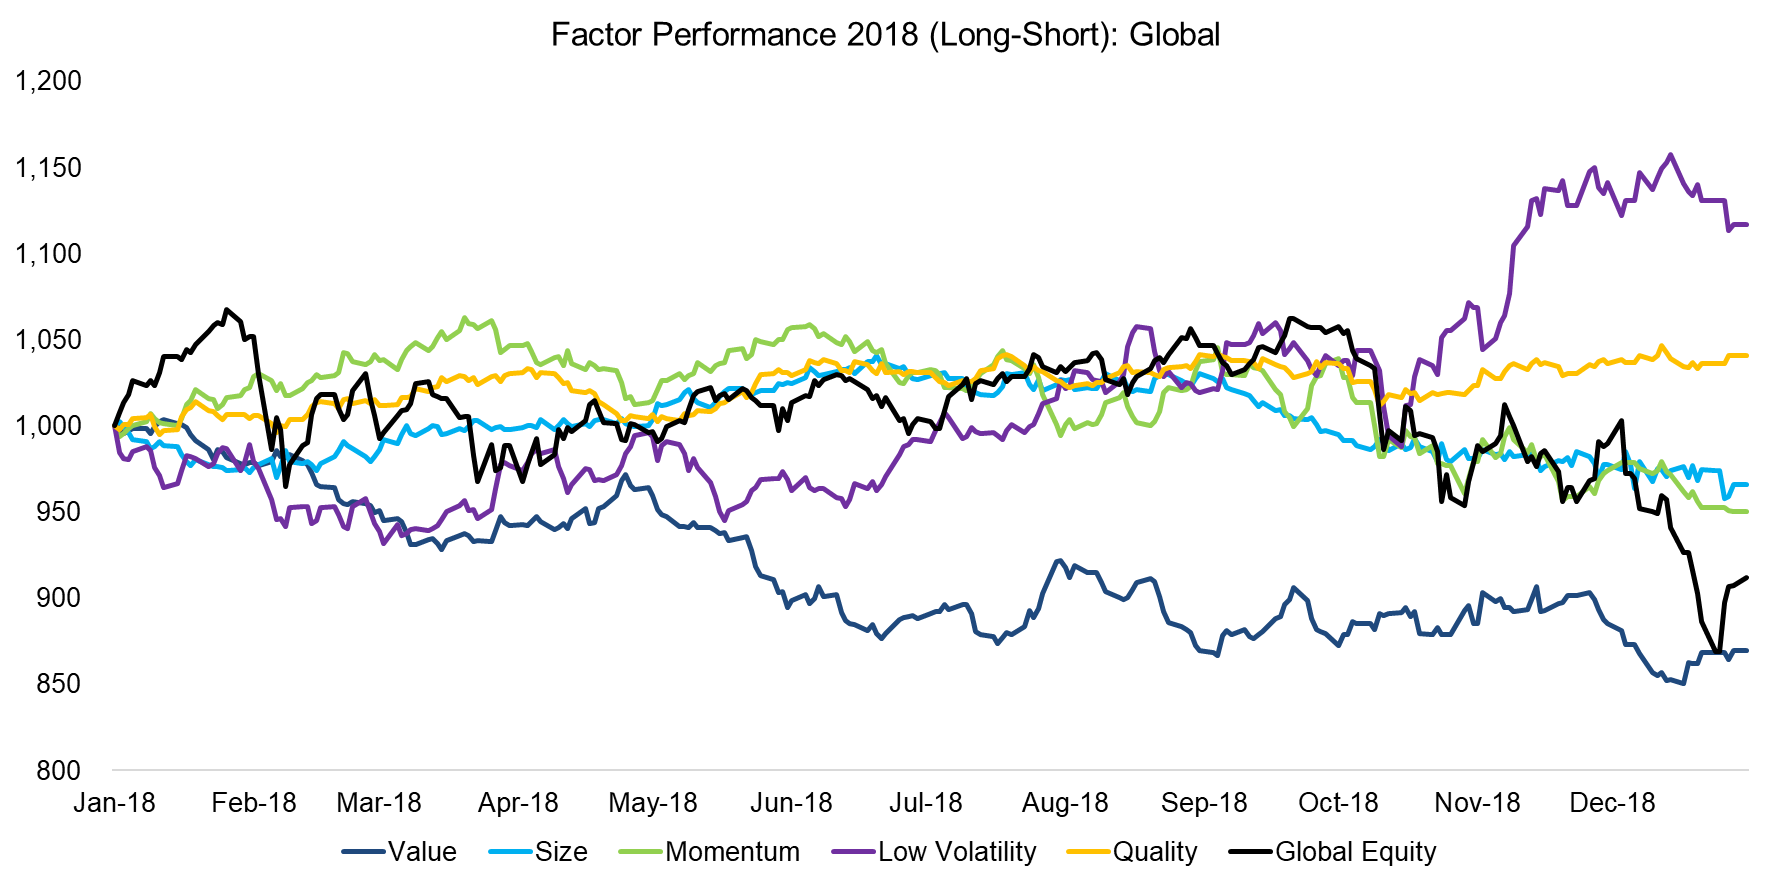
In the first two quarters of 2018, factor performance varied across markets, which could be explained by divergent central bank policies and geopolitical risks. However, over the next two quarters, global factor performance synchronised and became identical in the direction of factor returns across all markets. Perhaps concerns on global growth may explain the convergence of returns.
Most factors were more or less flat until Q4 2018, which coincides with global equity markets starting their decline. Thereafter Momentum and Size generated negative while Low Volatility and Quality positive returns. Value declined consistently throughout the year.
Some thoughts on factor performance:
- Value: The performance was the worst annual return of the last decade and increases the drawdown that the Value factor is experiencing since its peak in 2010.
- Size: Some investors expected global trade wars to benefit small cap stocks as these companies are supposedly more isolated from tariffs, but this did not translate into positive returns of the Size factor.
- Momentum: The performance was positive initially, but turned when Technology stocks, which made up a significant portion of the long portfolio, started declining.
- Low Volatility: The market expected 2018 to be the year of central banks normalizing their policies. Indeed, the Fed in the US increased interest rates while the ECB announced to slowly phase out quantitative easing. Given that the Low Volatility factor is interest rate-sensitive, investors might accordingly have expected this factor to underperform in 2018. Surprisingly, the factor generated the best returns, which is mainly explained by the performance in the last quarter where global growth concerns surfaced.
- Quality: The performance was positive with low levels of volatility.
Source: FactorResearch
FACTOR PERFORMANCE 2018: US
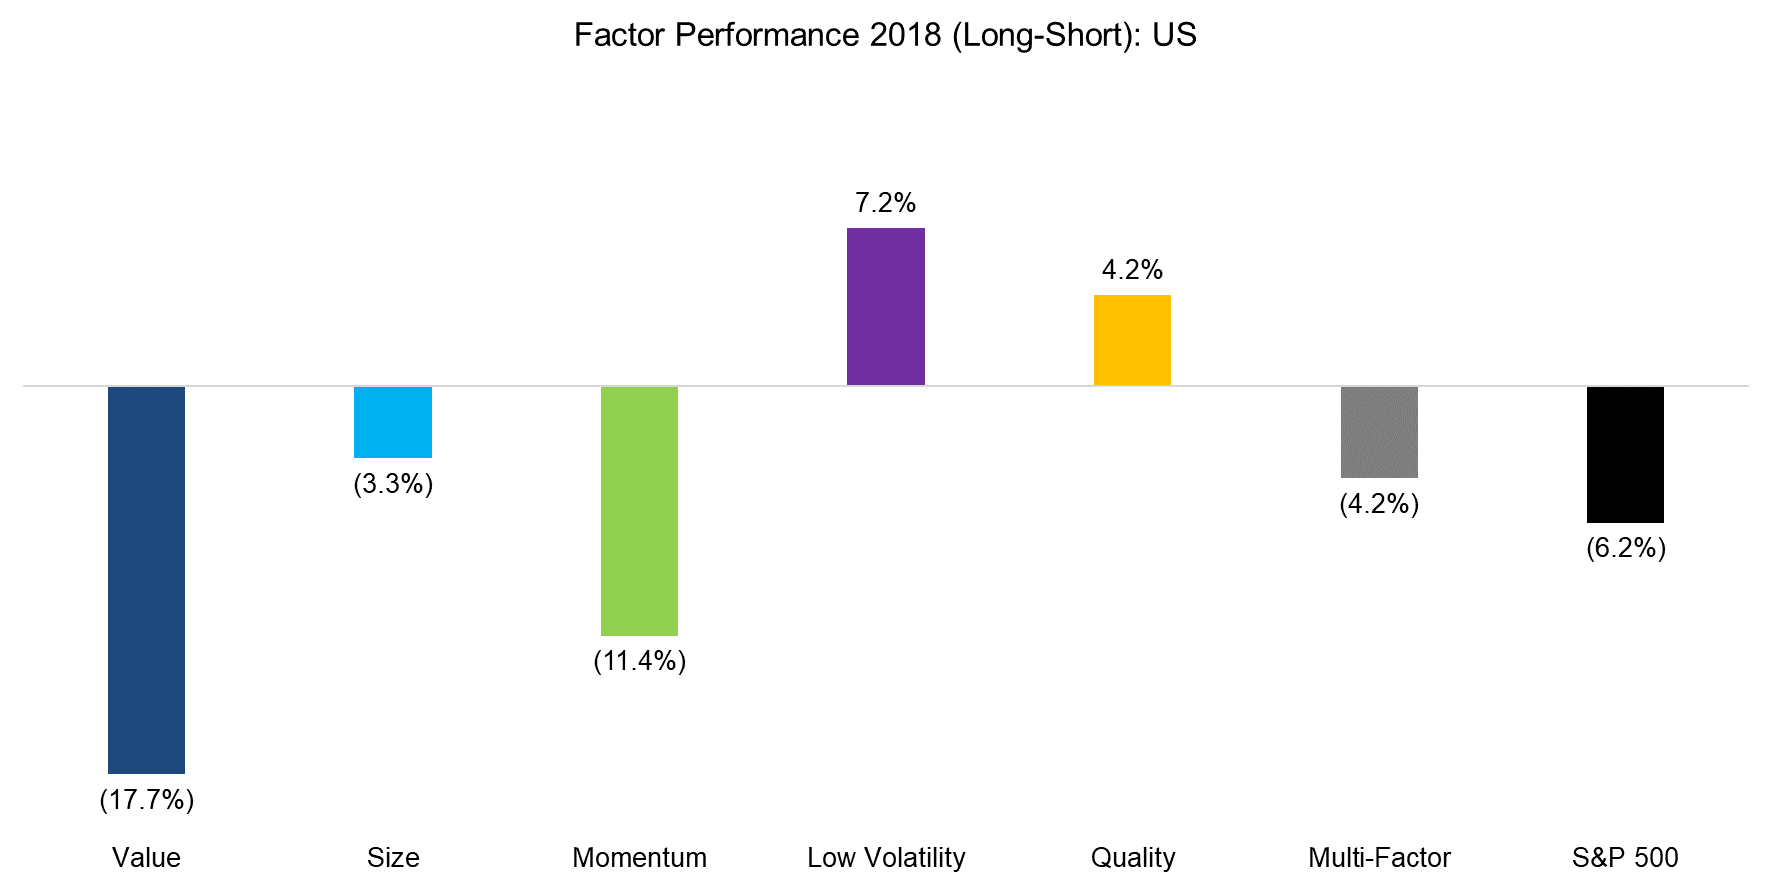
The global performance is significantly weighted towards the US, so it is not surprising that factor performance in the US is alike to the global returns. The factor performance in the US diverged from Europe and Asia in the first three quarters, but then converged in the fourth quarter. It is worth highlighting that investors have allocated more than six times the amount of capital to smart beta ETFs that track Value, the worst performing factor, versus Low Volatility, the best performing factor.
Source: FactorResearch
FACTOR PERFORMANCE 2018: EUROPE
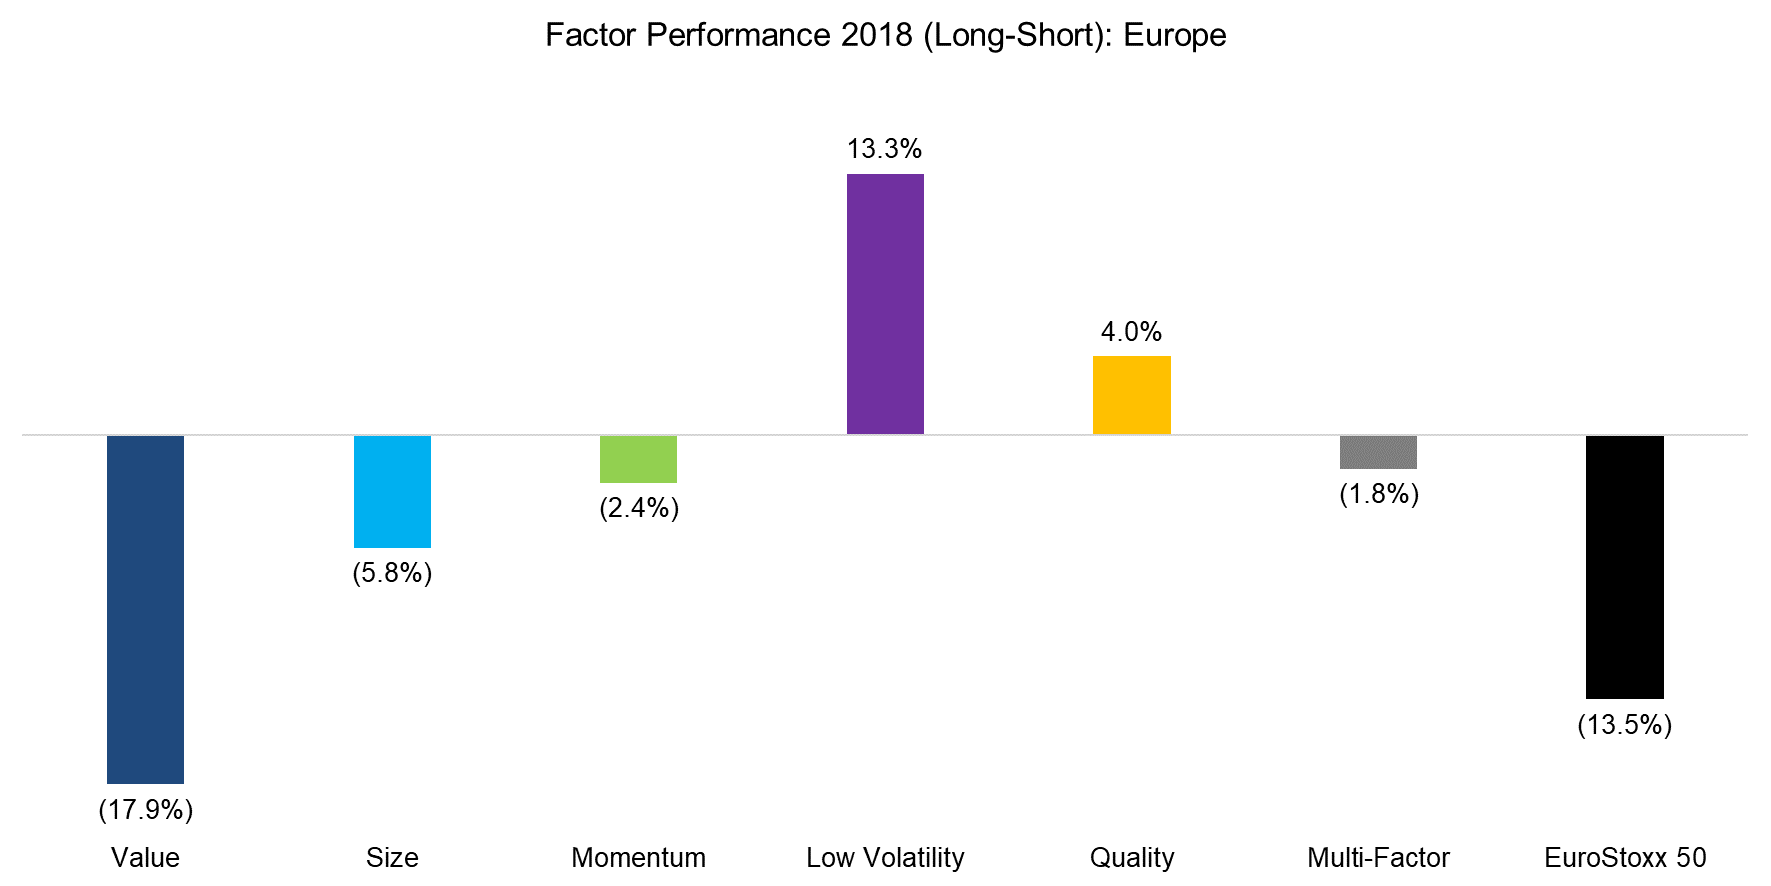
The factor performance in Europe is identical to the US in the direction of returns. The Value factor generated the worst and the Low Volatility factor the best performance. The Momentum factor was slightly less negative in Europe, which is likely explained by the Technology sector being less significant than in the US. Europe lacks the equivalent of FAANG stocks.
Source: FactorResearch
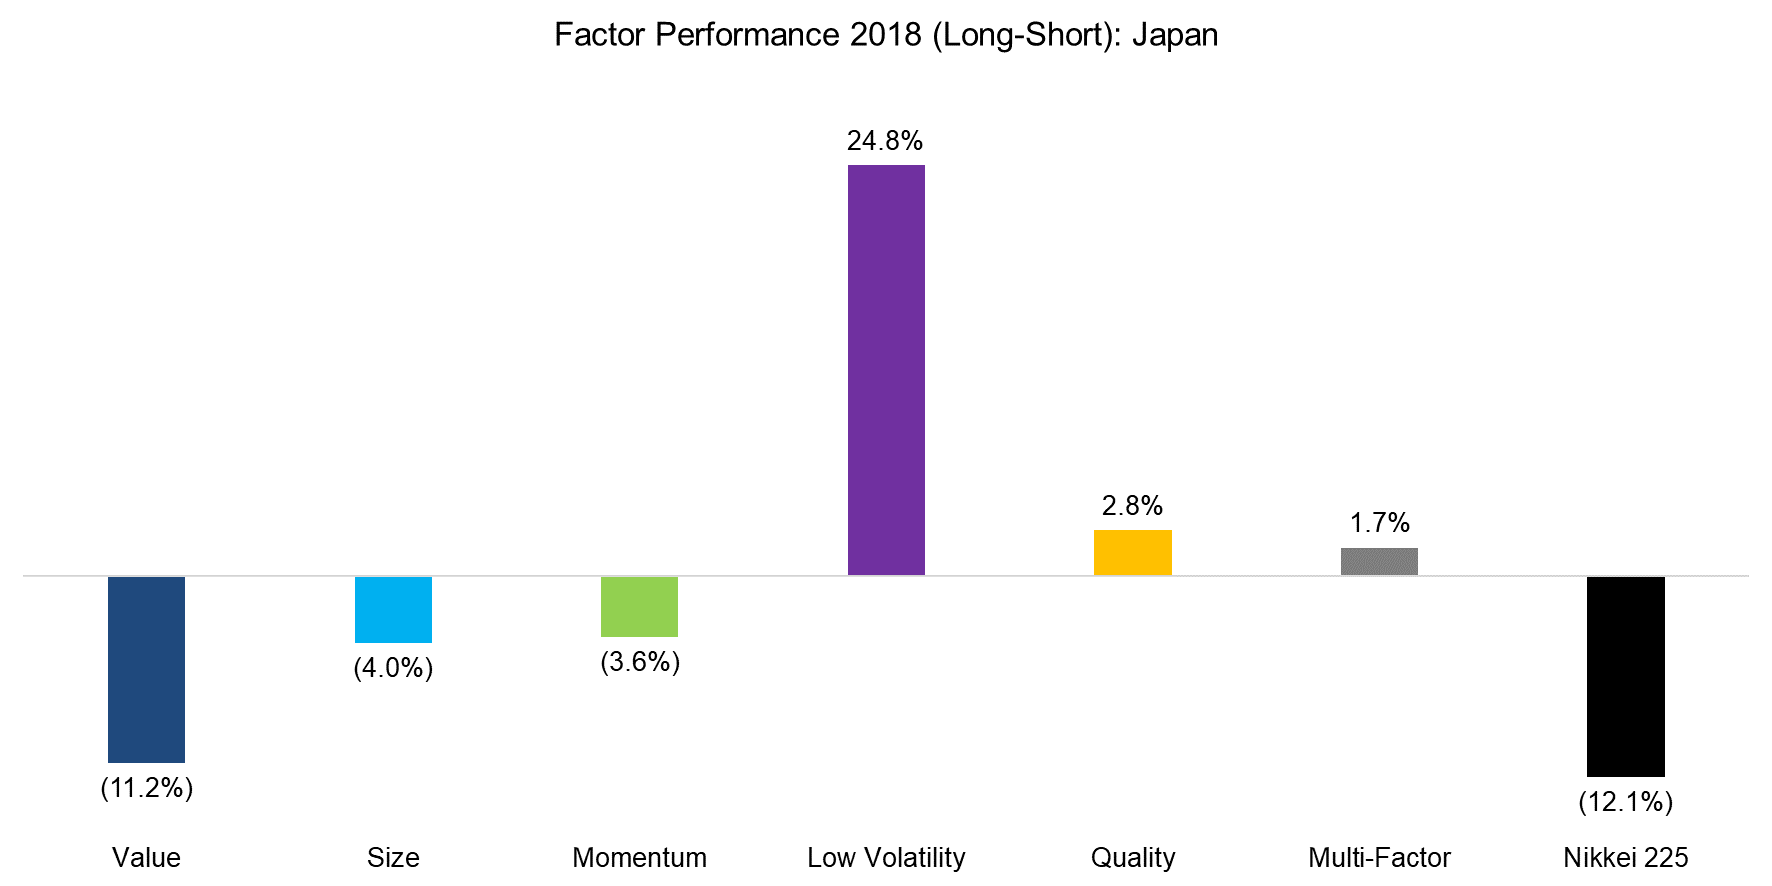
FACTOR PERFORMANCE 2018: JAPAN
Factor performance in Japan tends to be different and often less attractive than in other markets, although it strongly depends on the factor. For example, the Momentum factor in Japan does not seem to generate positive excess returns across market cycles, although the Value factor tends to be highly attractive. Interestingly, 2018 was a year were factor performance in Japan essentially mirrors global factor performance (read Equity Factors In Japan).
Source: FactorResearch
The correlation matrix below highlights the global one-year factor correlations. We can observe a strong relationship between Momentum and Quality, which may be surprising given that Quality generated positive while Momentum negative returns in 2018. The positive correlation only recently emerged and is not structural in nature. In contrast, Momentum and Value are negatively correlated, which tends to be accretive for creating a diversified multi-factor portfolio. Unfortunately, these potential diversification benefits failed to materialize in 2018 as both factors were negative.

Source: FactorResearch
FURTHER THOUGHTS
Most factor-focused investors are likely keen to forget 2018 given the negative performance of most common equity factors. Some investors argue that the expected returns of a classic multi-factor portfolio are attractive given that negative years like 2018 are rare. However, none of the factors like Value or Momentum screen as uncrowded or extremely cheap based on fundamental valuations. The outlook for multi-factor portfolios is attractive, but more from the perspective of an evergreen investment than on a spot basis.
ABOUT THE AUTHOR
Nicolas Rabener is the CEO & Founder of Finominal, which empowers professional investors with data, technology, and research insights to improve their investment outcomes. Previously he created Jackdaw Capital, an award-winning quantitative hedge fund. Before that Nicolas worked at GIC and Citigroup in London and New York. Nicolas holds a Master of Finance from HHL Leipzig Graduate School of Management, is a CAIA charter holder, and enjoys endurance sports (Ironman & 100km Ultramarathon).
Connect with me on LinkedIn or X.

