Factor Olympics Q1 2019
And the Winner is…
April 2019. Reading Time: 10 Minutes. Author: Nicolas Rabener.
SUMMARY
- 2019 has started favorable for factor investors, compared to 2018
- Low Volatility generated the best and Value the worst performance
- Factor performance is comparable in the US & Europe, but different in Japan
INTRODUCTION
We present the performance of five well-known factors on an annual basis for the last 10 years. We only present factors where academic research highlights positive excess returns across market cycles and asset classes. Other strategies like Growth might be widely-followed investment styles, but lack academic support and are therefore excluded (read Factor Olympics 2018).
METHODOLOGY
The factors are created by constructing long-short beta-neutral portfolios of the top and bottom 10% of stocks in the US, Europe and Japan, and 20% in smaller markets. Only stocks with a minimum market capitalisation of $1 billion are included. Portfolios rebalance monthly and transactions incur 10 basis points of costs.
FACTOR OLYMPICS: GLOBAL
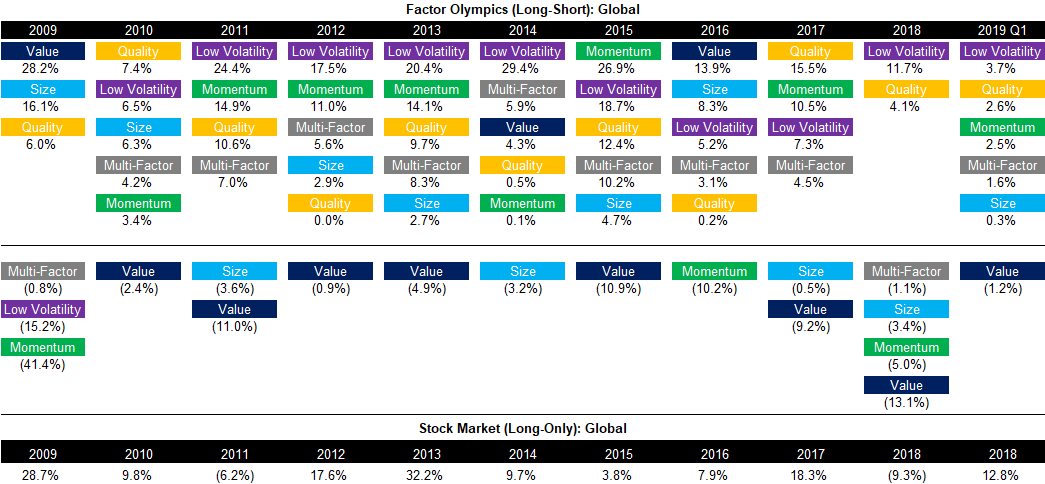
The table below shows the long-short factor performance for the last 10 years ranked top to bottom. The global series is comprised of all developed markets in Asia, Europe, and the US. Aside from displaying the factor performance, the analysis highlights the significant factor rotation in terms of profitability from one year to the next.
The year 2019 has started favorably for factor-focused investors as most factors show positive performance in the first quarter, with only Value being negative. The performance leadership is similar to the last decade with the Low Volatility, Quality, and Momentum factors exhibiting the highest returns.
Source: FactorResearch
FACTOR PERFORMANCE 2018: GLOBAL
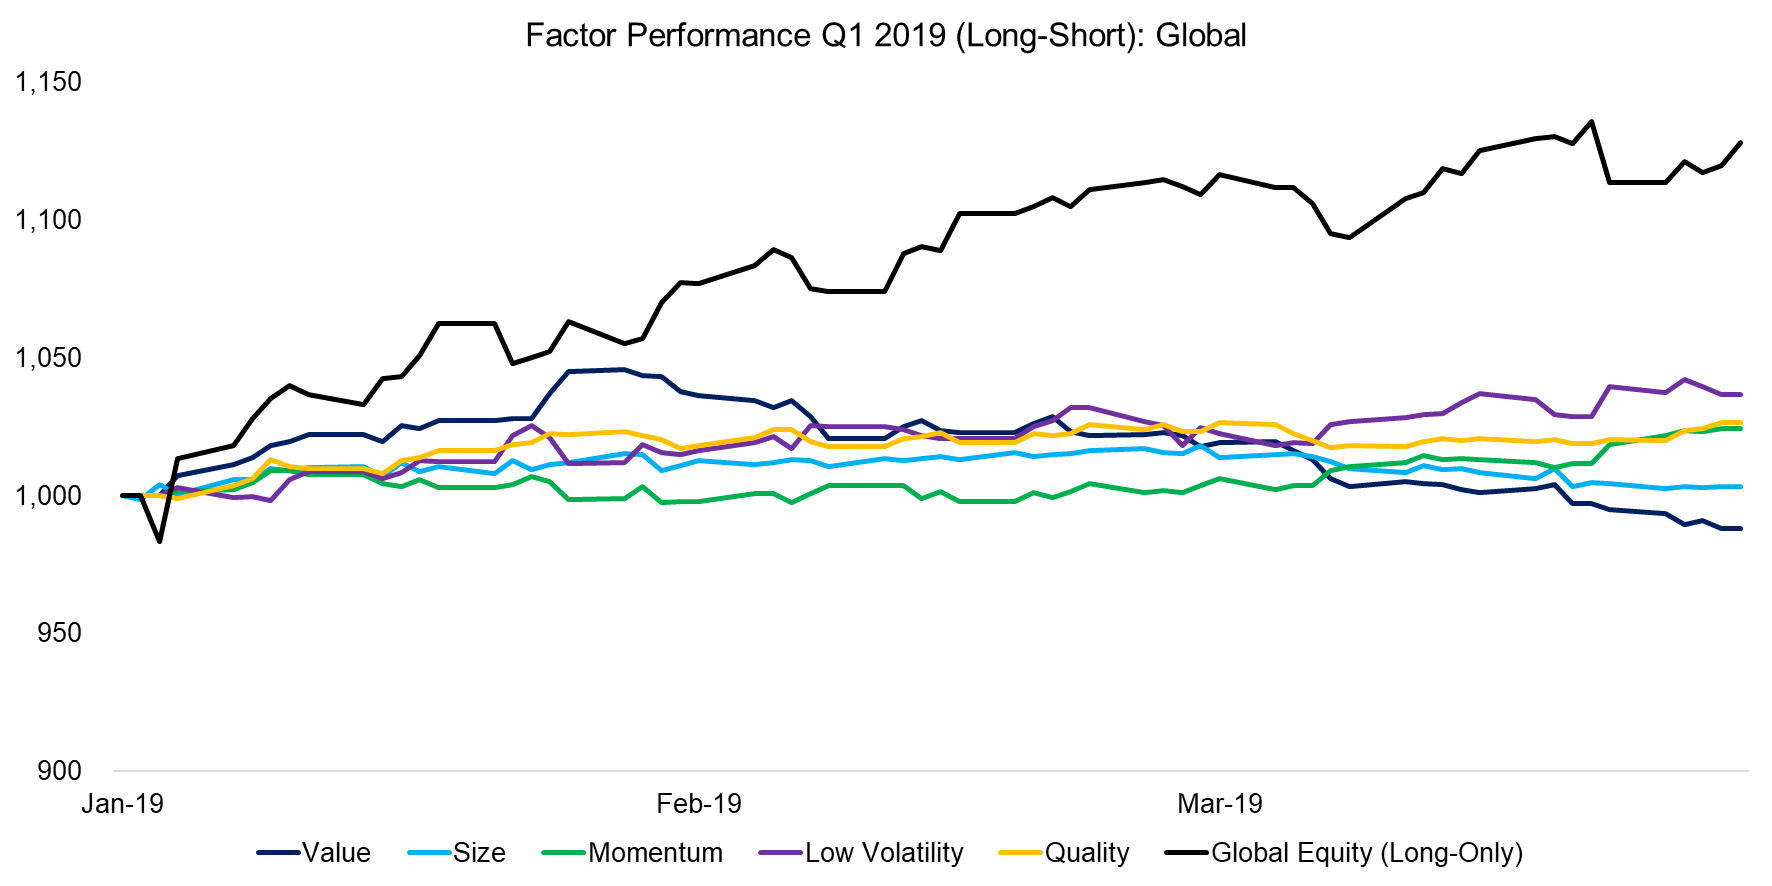
Equity markets generated strong positive returns across the globe in the first quarter of 2019 with the US and European stock markets showing double-digit returns. Some market commentators are currently highlighting that equity markets have decoupled from bond markets, which show yield compression and even inverted yield curves that historically preceded recessions. It might seem that one of these two markets is wrong, but it is worth noting that the relationship between both was not consistent across time.
Some thoughts on the performance of the global long-short factors:
- Value: The performance was positive in January, which was in line with the well-documented calendar effect that highlights strong returns for cheap and small stocks in the first month of the year. Thereafter returns were consistently negative.
- Size, Momentum & Quality: These factors exhibited little volatility and are effectively flat year-to-date.
- Low Volatility: Positive performance each month basis across the first quarter.
Source: FactorResearch
FACTOR PERFORMANCE Q1 2019: US
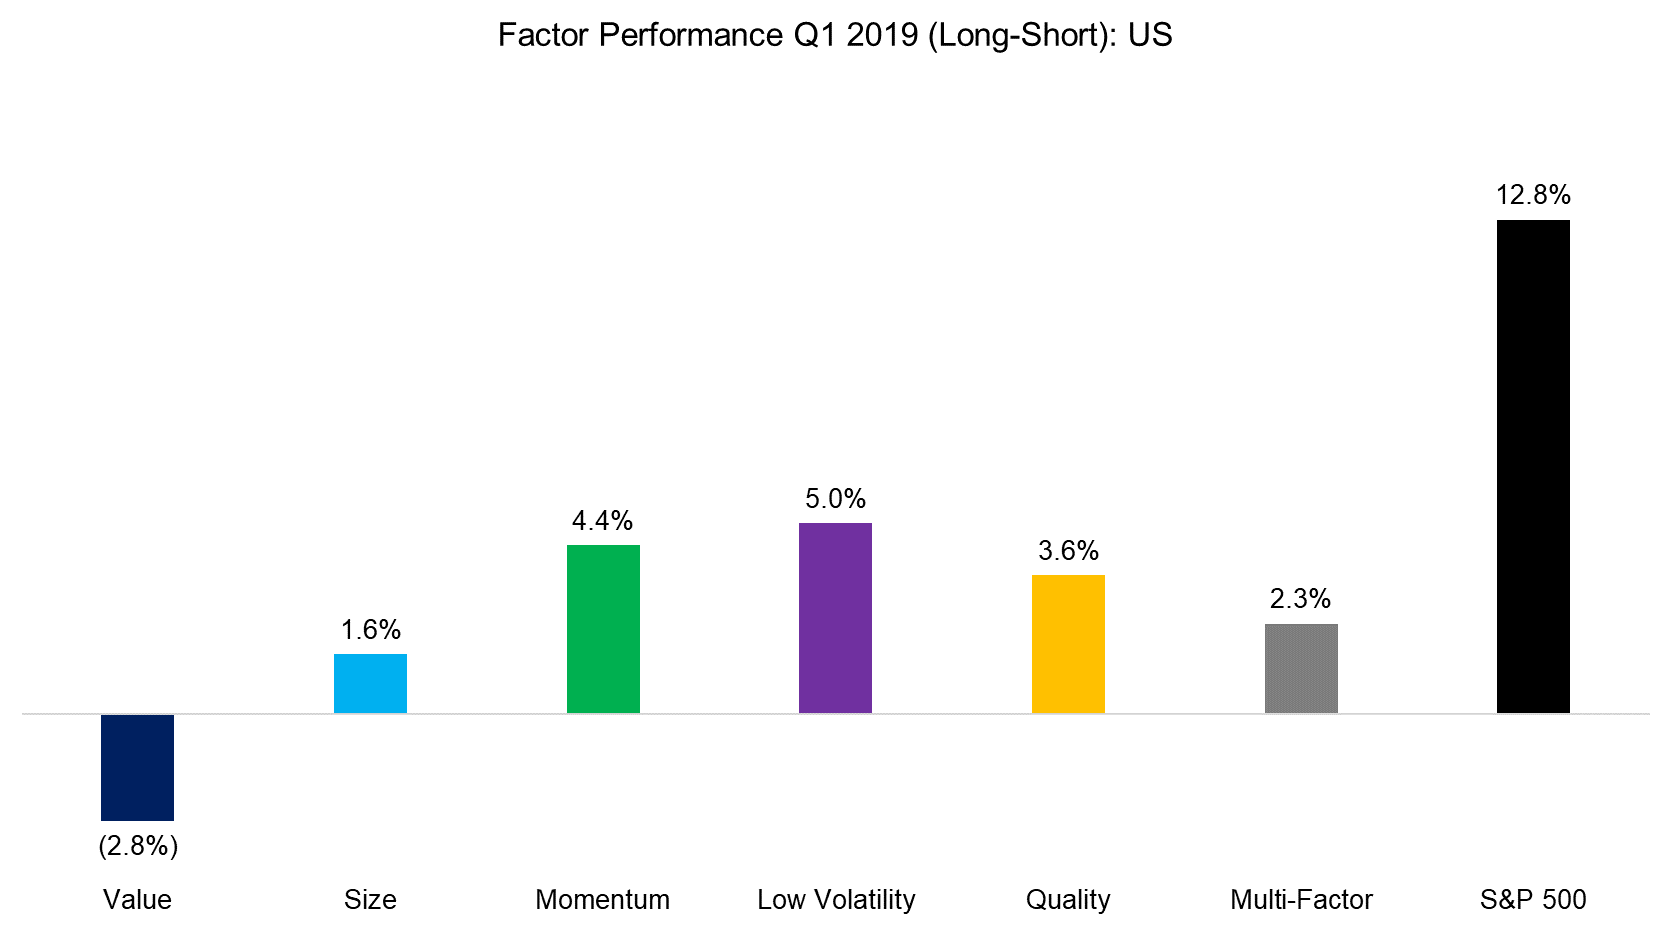
The global performance is significantly weighted towards the US, so it is not surprising that factor performance in the US is alike to the global returns. The factor performance in the US is led by the Low Volatility factor, which can be partially explained by the interest rate sensitivity of the factor and the continuous decrease in bond yields that started in November 2018. The portfolio of the factor has overweights in stocks from sectors like real estate and utilities that are not particularly volatile and can be considered bond-proxies based on the nature of their business models. Tech stocks have also performed strongly in the first quarter, which is reflected in the performance of the Momentum and Quality factors.
Source: FactorResearch
FACTOR PERFORMANCE Q1 2019: EUROPE
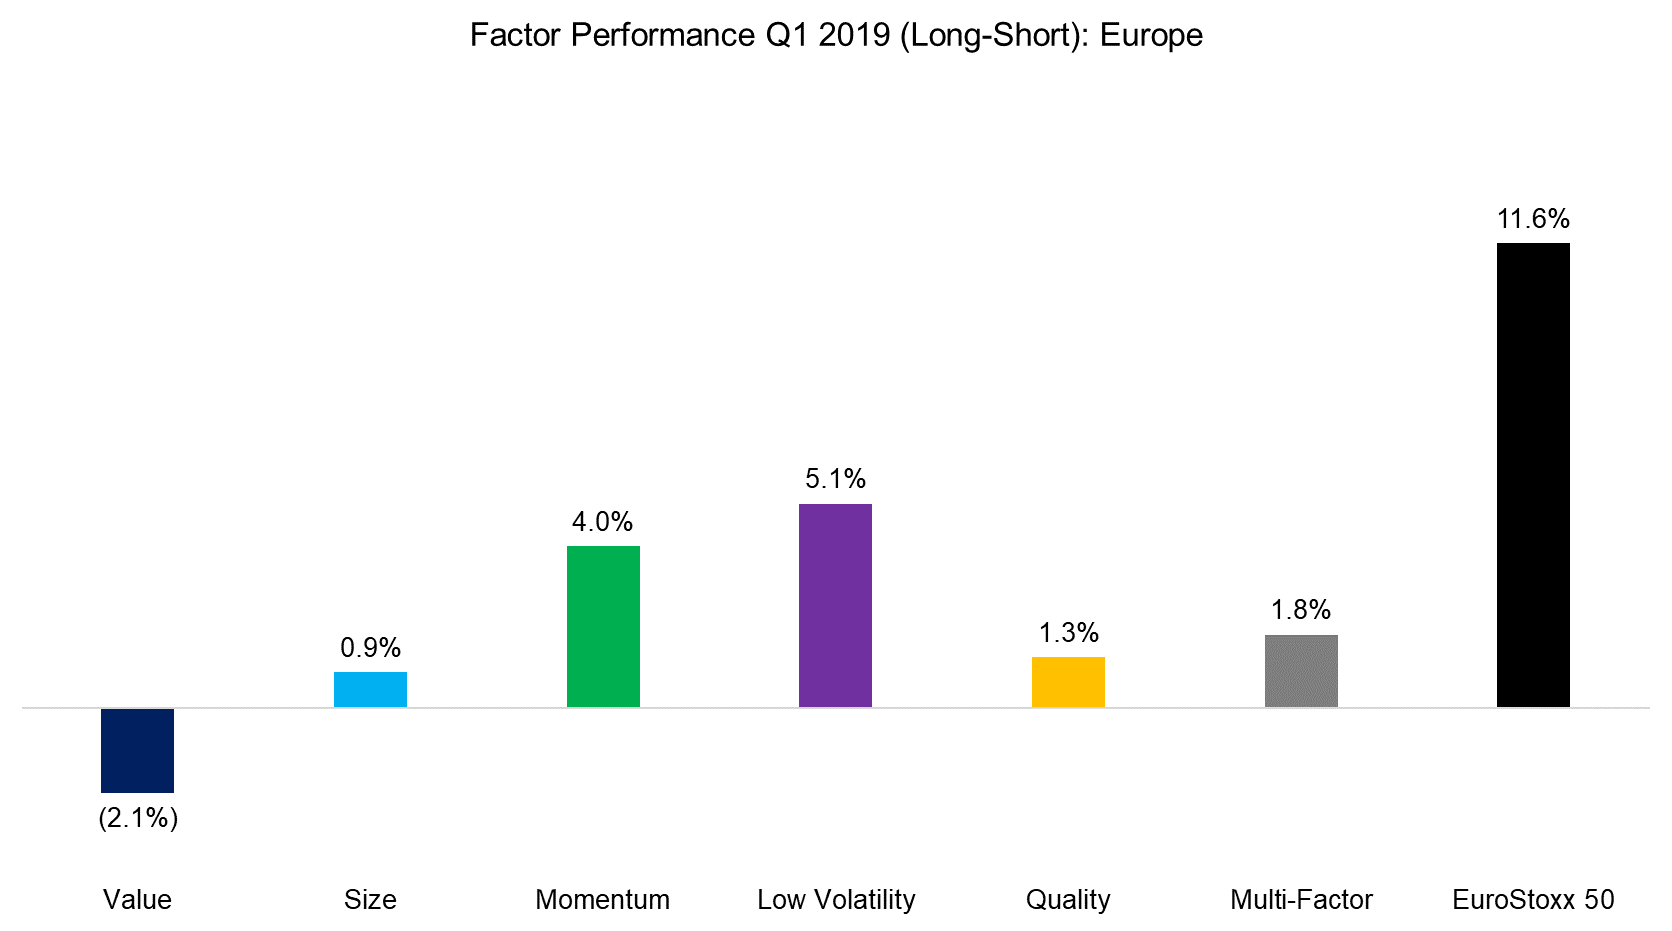
The factor performance in Europe is identical to the US in the direction of returns. Many investors will be concerned with the poor performance of the Value factor, which is a staple in most factor portfolios and has extended its decade-long drawdown. Our understanding of Value is that it is mainly driven by the risk sentiment of investors, which, depending on how it is measured, is still cautious despite a bull market since the end of the Global Financial Crisis in 2009.
Source: FactorResearch
FACTOR PERFORMANCE Q1 2019: JAPAN
The factor performance in Japan is different from the US and Europe in the direction and magnitude of returns. Most factors are negative in the first quarter of 2019, which reflects in the negative performance of the multi-factor portfolio. Historically the performance of common equity factors in Japan was lower than in other regions, although the trends were often the same.
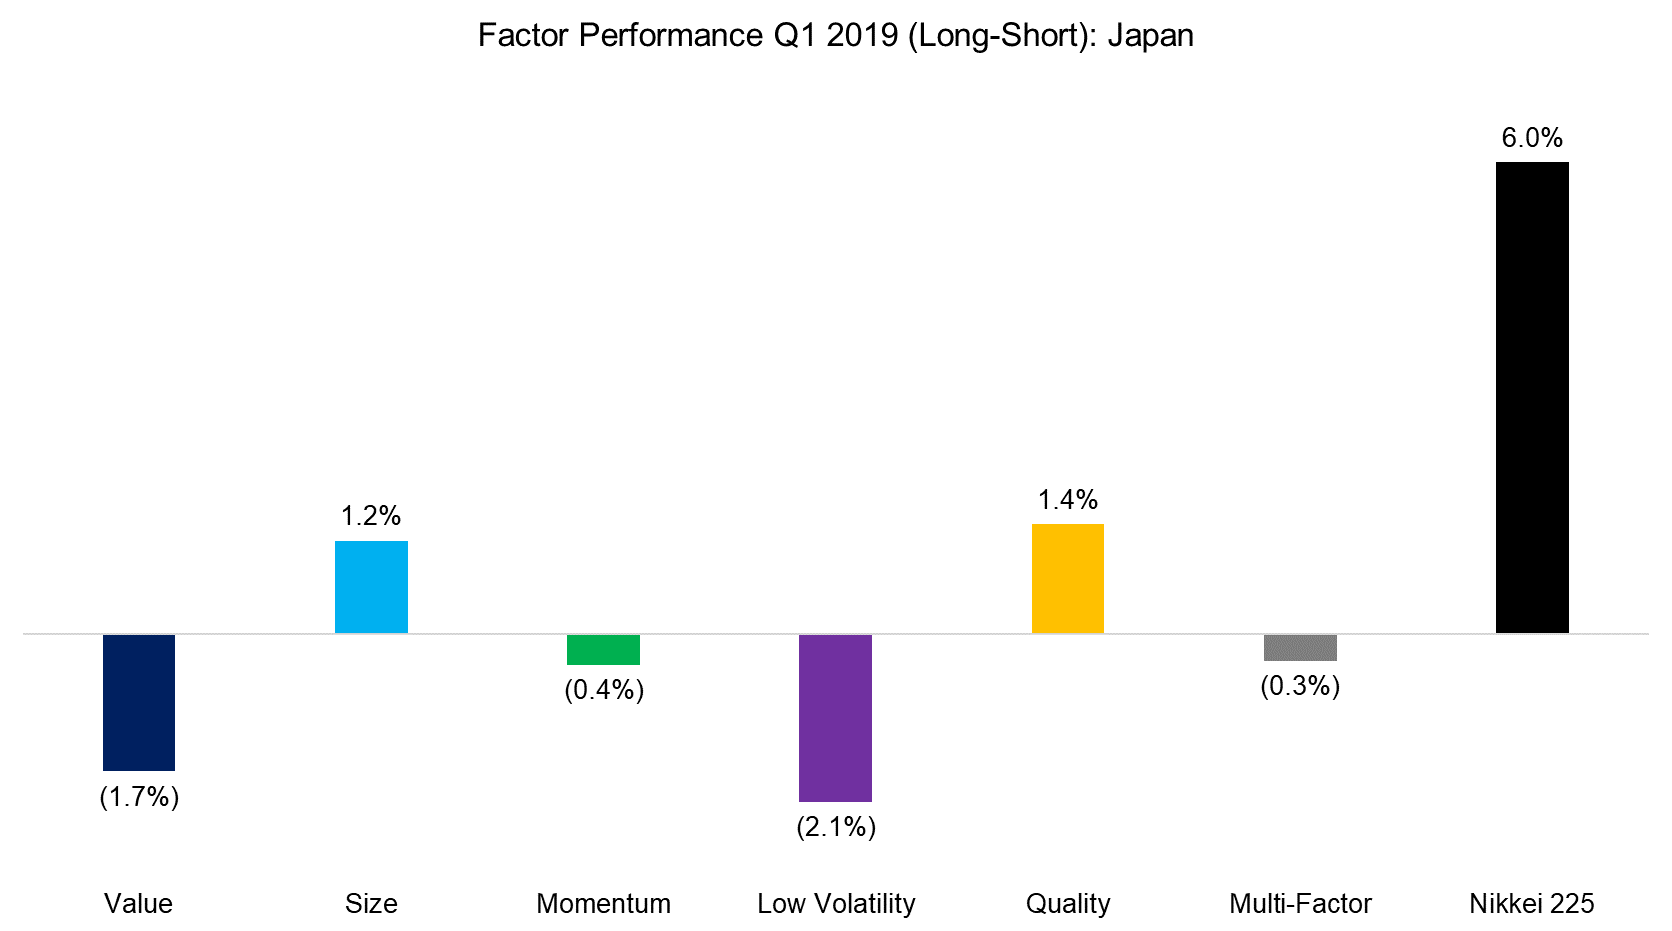
Source: FactorResearch
FACTOR CORRELATIONS
The correlation matrix below highlights the global one-year factor correlations. We observe a strong positive relationship between the Momentum and Quality factors, which is not structural in nature. The portfolios of both factors have overweights in the Technology sector as these stocks have been performing strongly, are highly profitable and lowly levered. Investors that have exposure to these two factors might consider the Value factor for diversification, which features negative relationships with both of them (read Factors: Correlation Check).

Source: FactorResearch
FURTHER THOUGHTS
It is interesting to note that investors are currently having different perceptions of long-short and long-only multi-factor products. Most common equity factors were negative in 2018, which reflected clearly in negative returns of market neutral multi-factor products. Investors accordingly redeemed capital from liquid alternative mutual and hedge funds that offer exposure to this strategy. In contrast, the interest and allocations to long-only multi-factor products like smart beta ETFs were exceptionally strong last year, with the majority of investors preferring multi-factor over single-factor products.
Perhaps these unusual preferences can be explained by different investor types. Long-short products are mainly used by institutional investors while ETFs are dominated by retail investors. These two investor groups frequently behave differently. Another reason might be simply the lack of transparency with regards to the performance of long-only multi-factor products. If your smart beta ETF was down yesterday, was it due to the market or factor exposure?
ABOUT THE AUTHOR
Nicolas Rabener is the CEO & Founder of Finominal, which empowers professional investors with data, technology, and research insights to improve their investment outcomes. Previously he created Jackdaw Capital, an award-winning quantitative hedge fund. Before that Nicolas worked at GIC and Citigroup in London and New York. Nicolas holds a Master of Finance from HHL Leipzig Graduate School of Management, is a CAIA charter holder, and enjoys endurance sports (Ironman & 100km Ultramarathon).
Connect with me on LinkedIn or X.

