Factor Olympics Q1 2020
And the Winner is…
April 2020. Reading Time: 10 Minutes. Author: Nicolas Rabener.
SUMMARY
- Beta-neutral long-short factors were largely negative during Q1 2020
- Momentum & Quality are leading the performance leaderboard
- Investors were most negative on small cap and cheap stocks
INTRODUCTION
We present the performance of five well-known factors on an annual basis for the last 10 years. We only present factors where academic research highlights positive excess returns across market cycles and asset classes. Other strategies like Growth might be widely-followed investment styles, but lack academic support and are therefore excluded (read Factor Olympics 2019).
METHODOLOGY
The factors are created by constructing long-short beta-neutral portfolios of the top and bottom 10% of stocks in the US, Europe and Japan, and 20% in smaller markets. Only stocks with a minimum market capitalization of $1 billion are included. Portfolios rebalance monthly and transactions incur 10 basis points of costs.
FACTOR OLYMPICS: GLOBAL
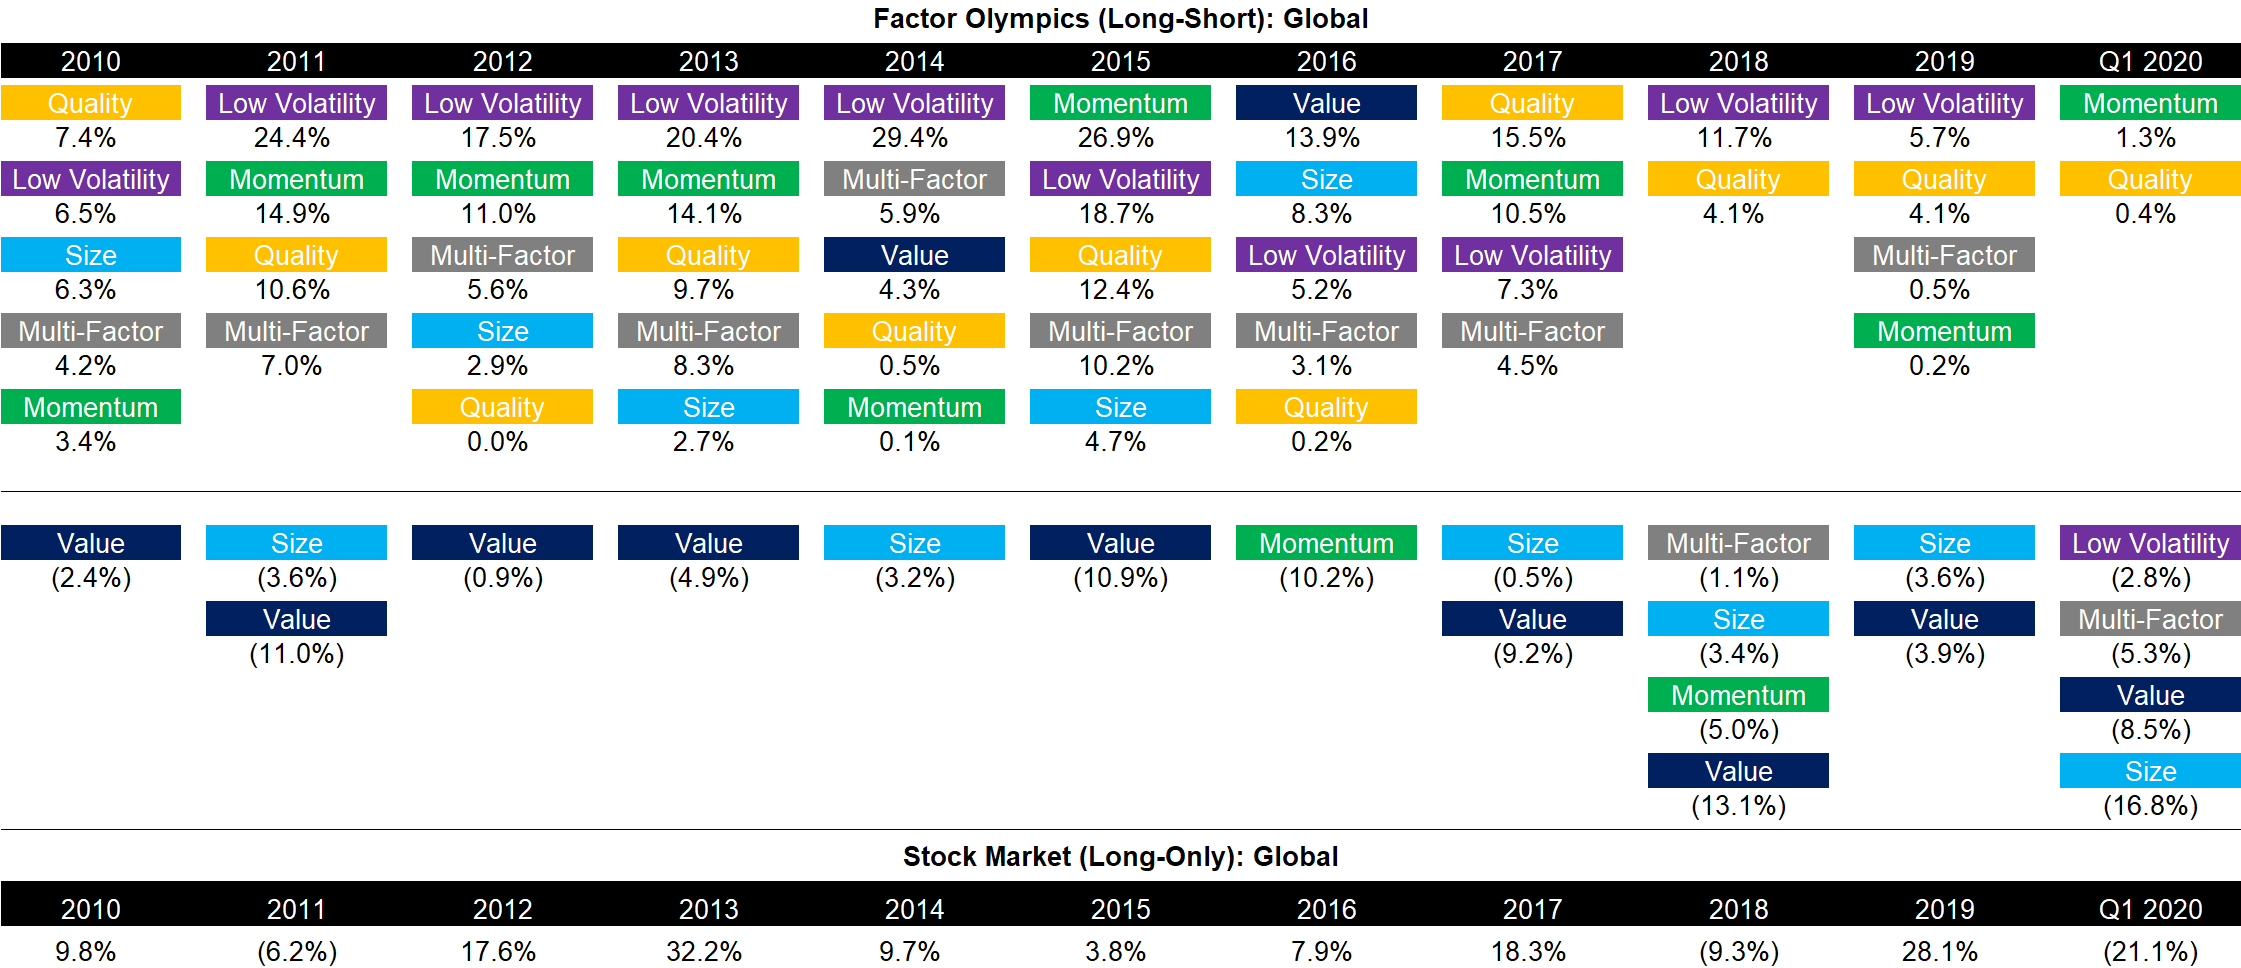
The table below shows the long-short factor performance for the last 10 years ranked top to bottom. The global series is comprised of all developed markets in Asia, Europe, and the US. Aside from displaying the factor performance, the analysis highlights the significant factor rotation in terms of profitability from one year to the next.
Factor investing has been disappointing in the first quarter of 2020 as the performance of a classic multi-factor portfolio was significantly negative. Given that global stock markets crashed and these factors are constructed via beta-neutral long-short portfolios, investors could have hoped for at least some factors to generate strong positive returns. Momentum and Quality stocks did outperform, but only barely.
Source: FactorResearch
FACTOR PERFORMANCE Q1 2020: GLOBAL
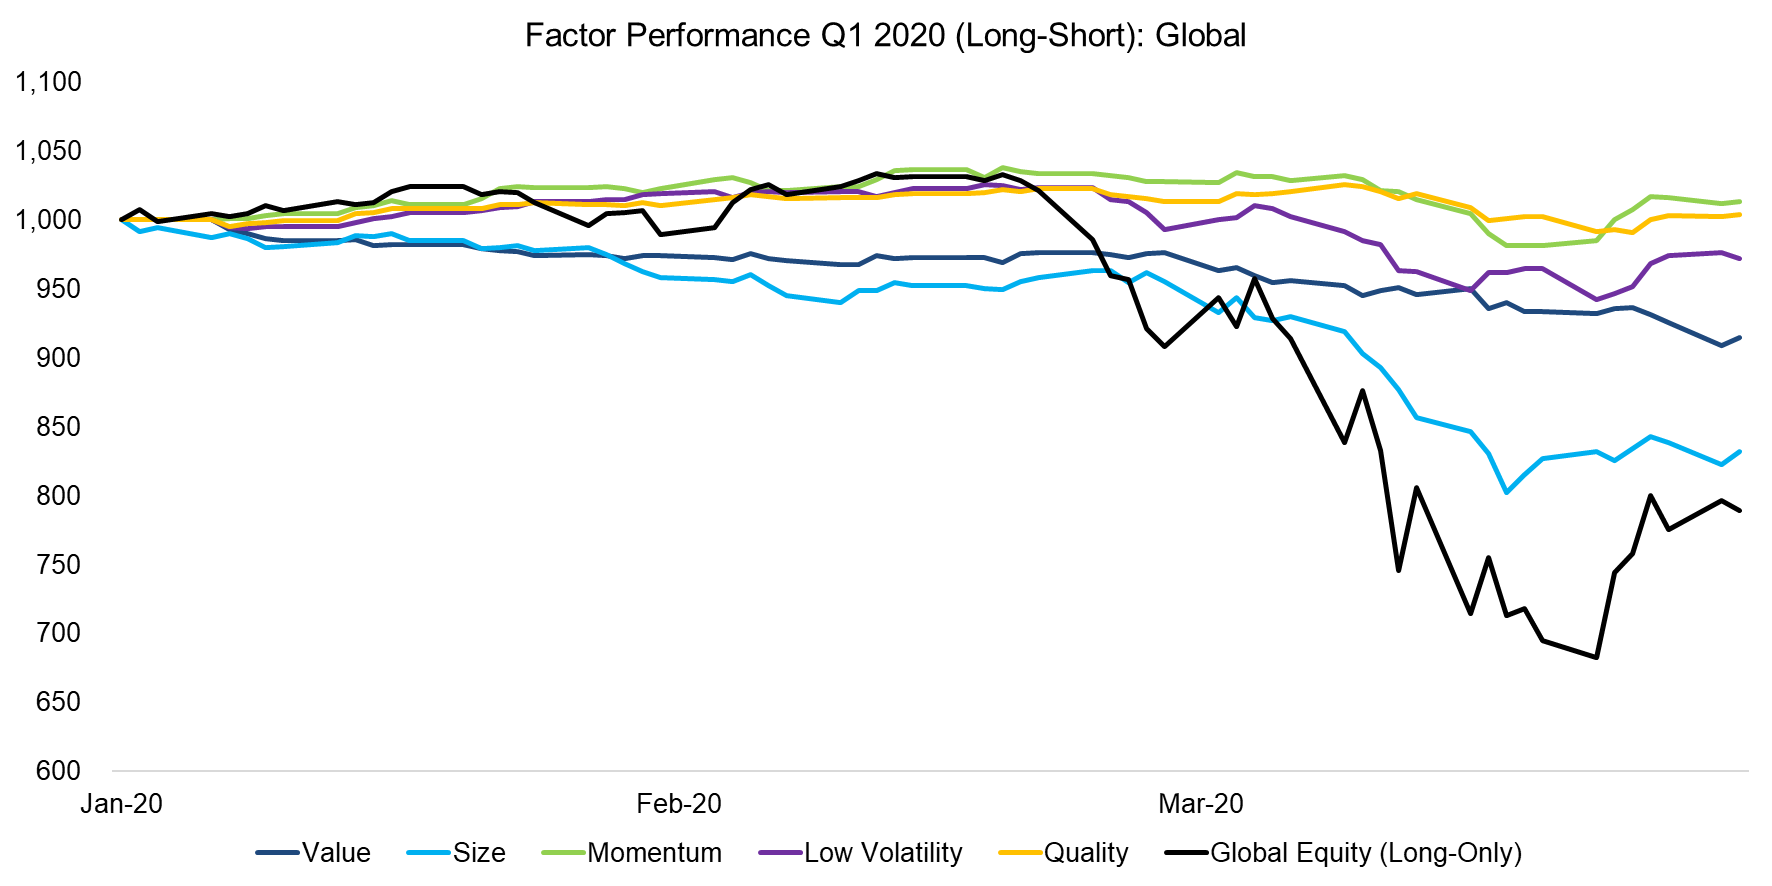
Global stocks entered a bear market given the coronavirus crisis, although the performance varied across regions. European stocks performed the worst, while US and Japanese stocks generated similar losses.
Some thoughts on the performance of the global long-short factors:
- Size: Small cap underperformed large cap stocks significantly, which can be attributed to investors assuming that larger companies are less affected by the current crisis than smaller firms. A second explanation is that technology firms like Amazon or Zoom have outperformed and the technology sector contributes more stocks to the large cap than small cap portfolio.
- Low Volatility: Investors allocate to this factor for capital preservation during market crashes and downturns, which makes the negative performance year-to-date disappointing for investors.
- Quality & Momentum: As expected Quality stocks have outperformed in the crisis while the positive returns of the Momentum factor can be attributed to a bias towards the technology sector.
Source: FactorResearch
FACTOR PERFORMANCE Q1 2020: US
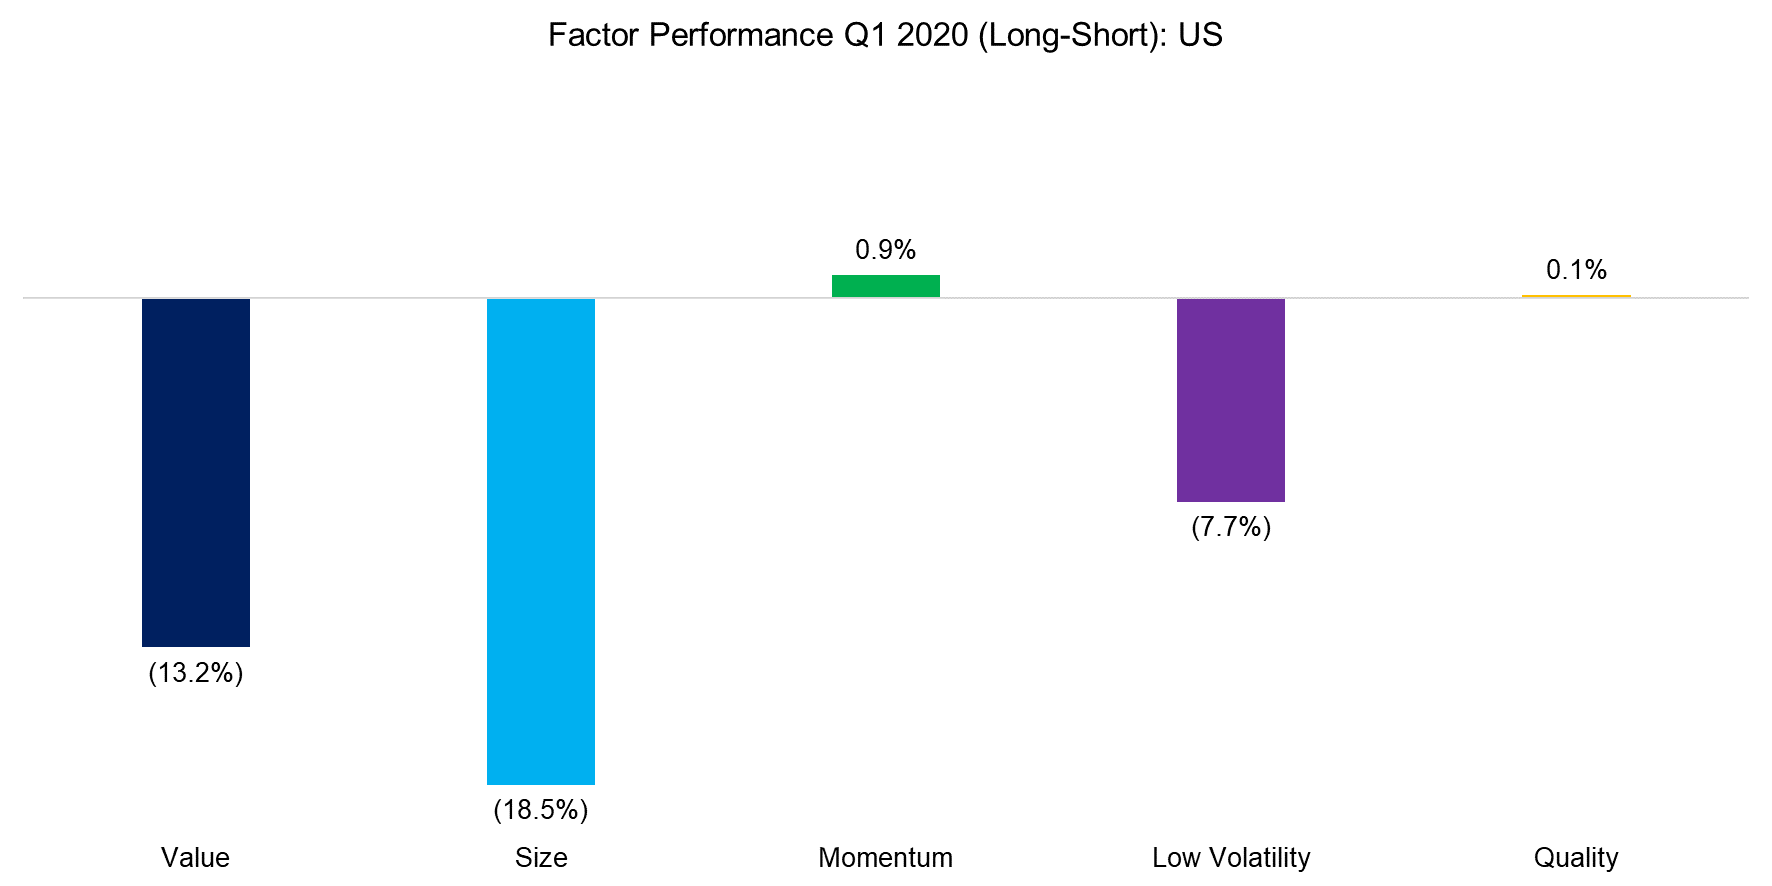
The global performance is significantly weighted towards the US, so it is not surprising that factor performance in the US is alike to the global returns.
The Size factor in the US lost almost 20% in the first quarter of 2020, which is relatively rare in magnitude for long-short portfolios and was reached last time in 2009 when the Momentum and Low Volatility factors crashed as stock markets recovered from the global financial crisis. It is somewhat unusual that Quality and Momentum stocks did not generate larger positive returns, which would have helped to offset the losses from the other factors within a multi-factor portfolio.
Source: FactorResearch
FACTOR PERFORMANCE Q1 2020: EUROPE
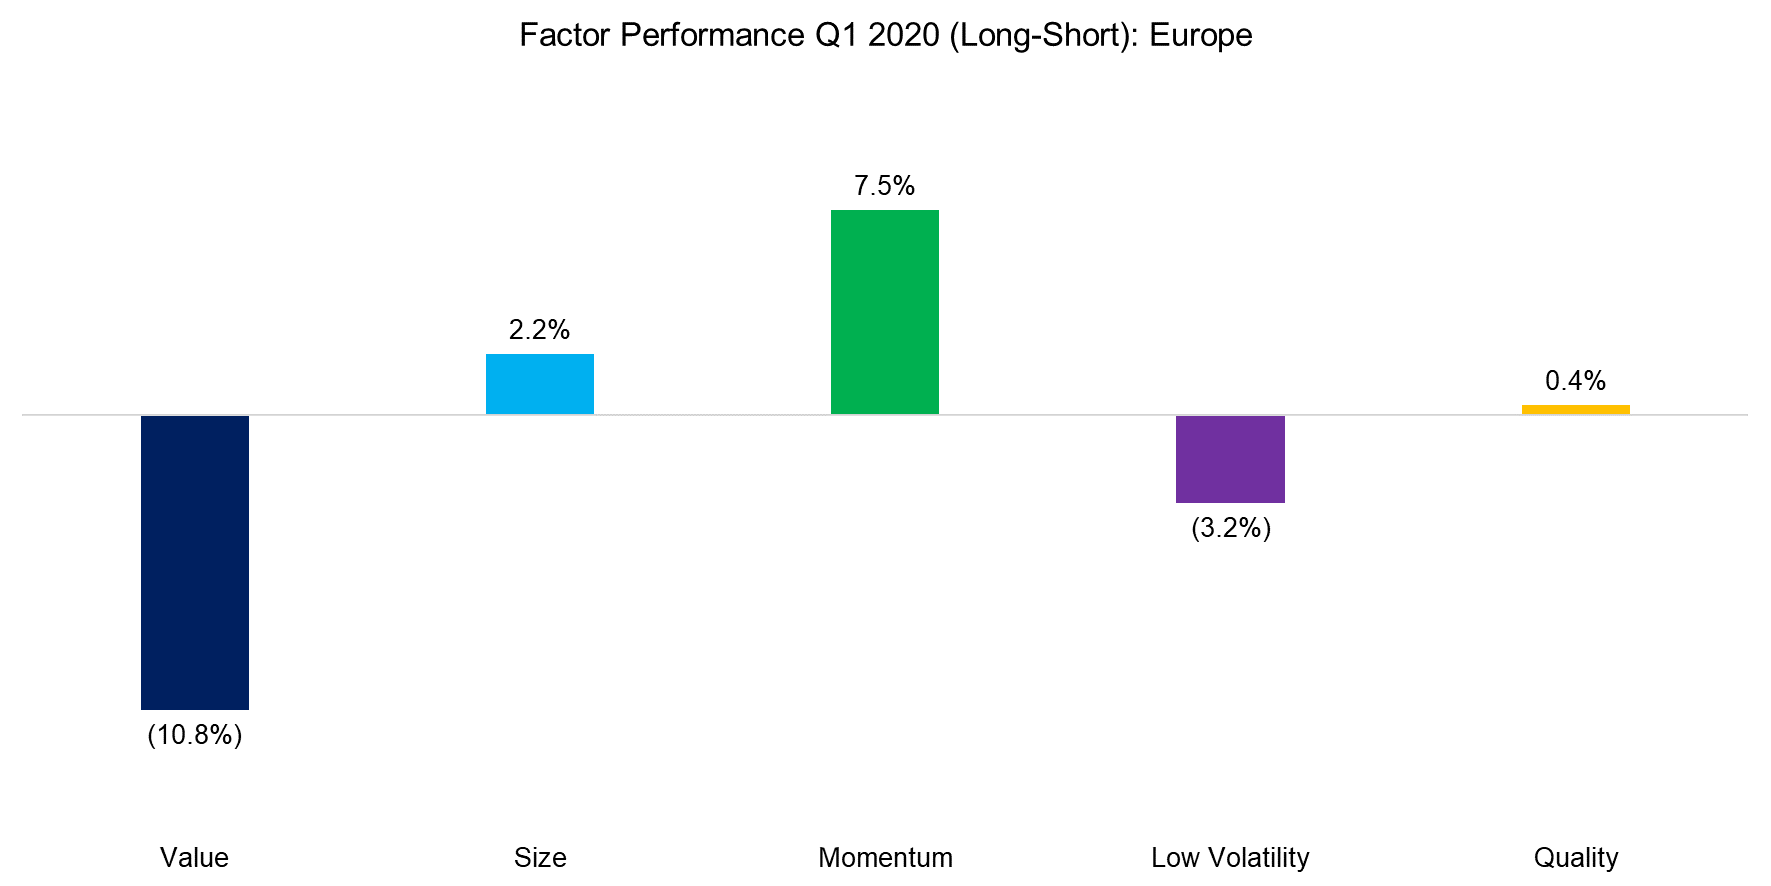
The factor performance in Europe is typically similar to the US in the direction of returns, which highlights that factors have the same performance drivers across markets.
In Q1 2020, we observe two meaning deviations: firstly, Momentum stocks generated strong returns in Europe, compared to almost flat returns in the US. Secondly, the Size factor in Europe was positive while negative in the US, which can be attributed to lower exposure to technology stocks and higher exposure to financials amongst European large caps. The outlook for European banks like Deutsche Bank or Unicredit was negative before the coronavirus crisis and has deteriorated significantly since then.
Source: FactorResearch
FACTOR PERFORMANCE Q1 2020: JAPAN
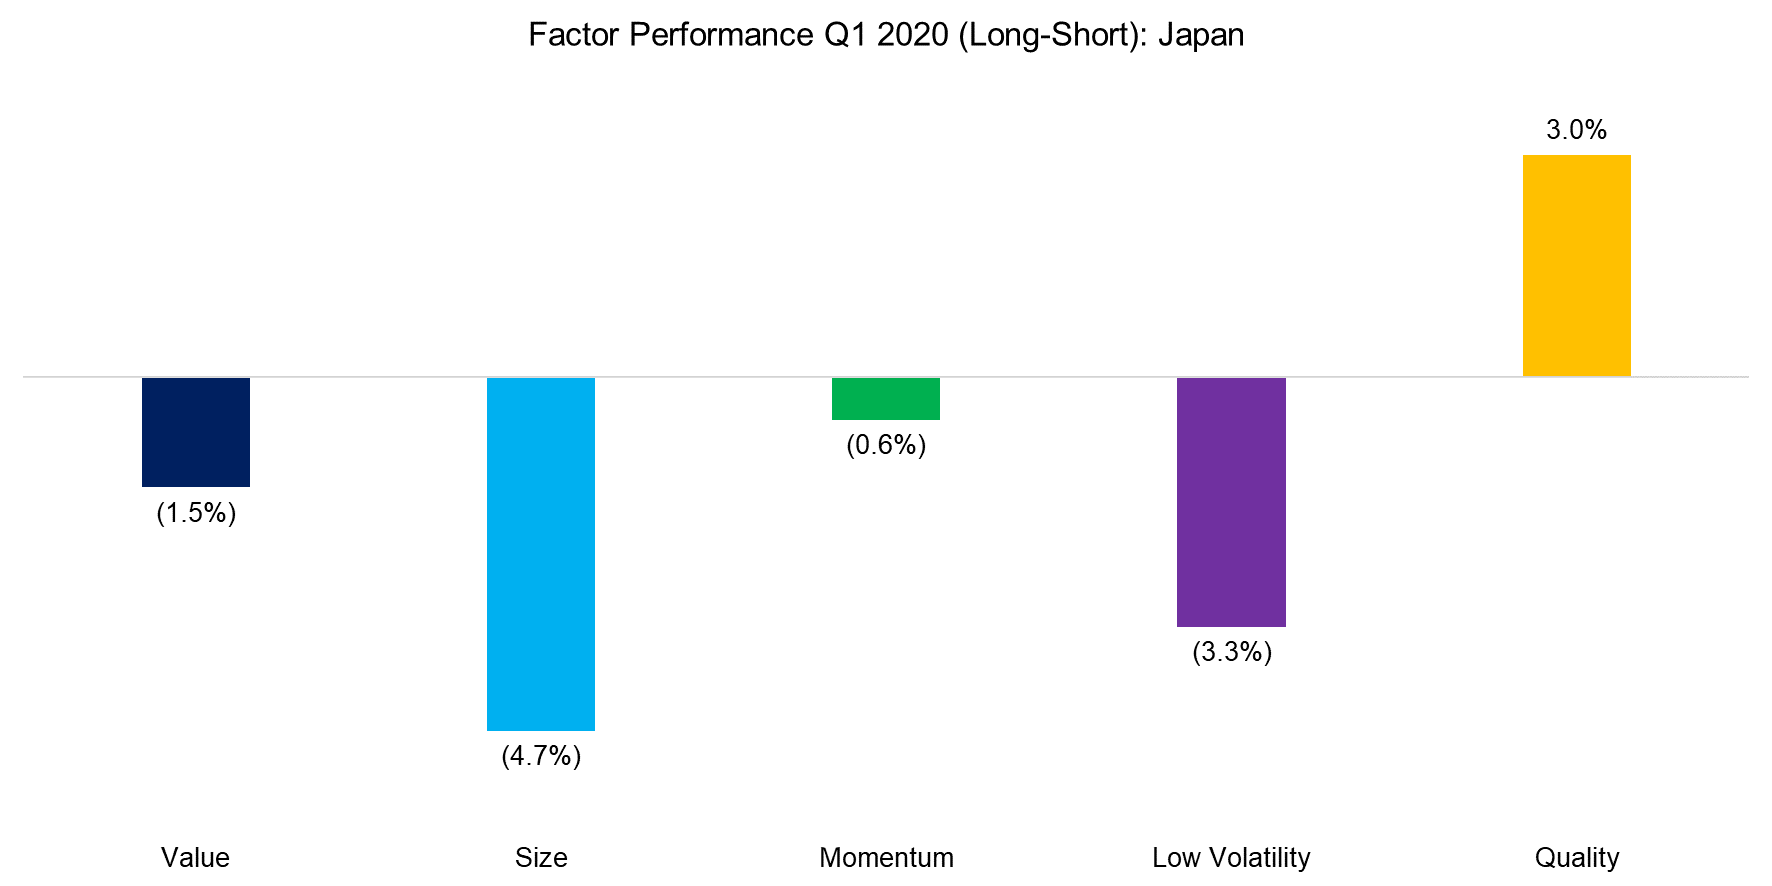
The long-term returns of common equity factors in the Japanese stock market have been lower than globally, but the trends in performance were typically the same, e.g. Value in Japan mirrors Value globally (read Equity Factors In Japan).
The performance of factors in Japan is directionally identical to that in the US, except for the performance of the Momentum factor, which was negative. The coronavirus has spread less within the Japanese society than in other countries and factor performance has therefore been less extreme as companies are slightly less negatively affected.
Source: FactorResearch
FACTOR CORRELATIONS
The correlation matrix below highlights the global one-year factor correlations based on daily data. As of the end of the first quarter of 2020, these are showing risks and opportunities for multi-factor portfolios. Specifically, we observe that Momentum was highly correlated to the Quality factor while being negatively correlated to Value. Naturally, investors can and should consider these relationships when constructing or investing in multi-factor products.

Source: FactorResearch
LONG-SHORT MULTI-FACTOR PRODUCTS
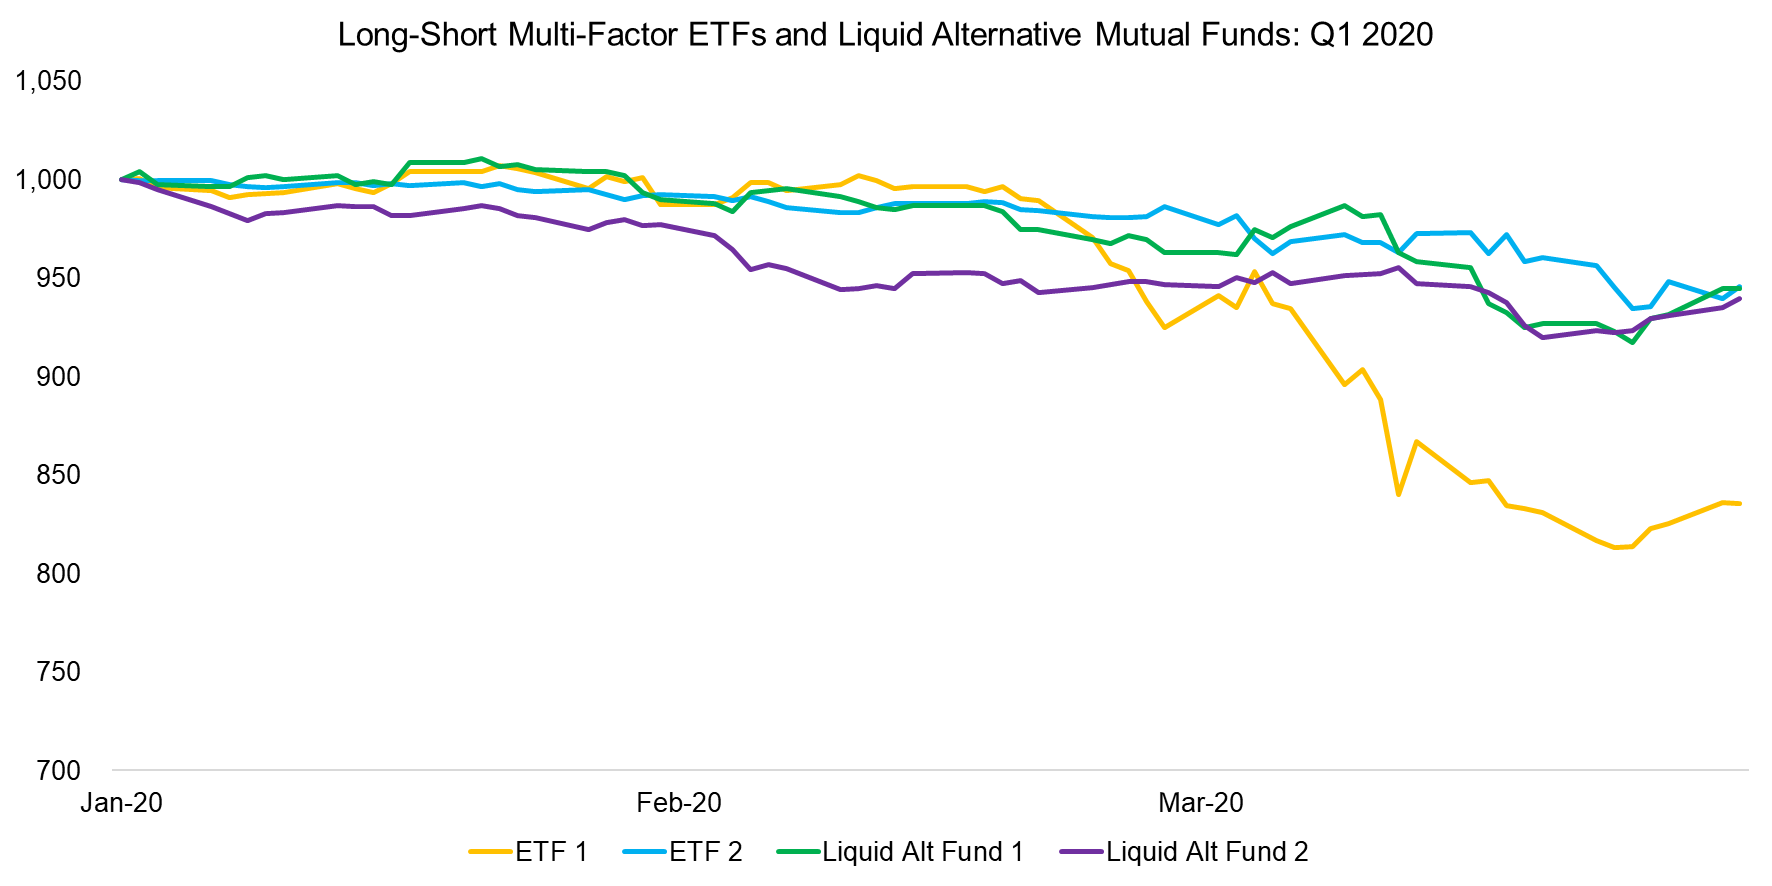
Finally, we analyze the performance of long-short multi-factor ETFs and liquid alternative mutual funds in the US and Europe. The returns in the first quarter of 2020 were negative, mirroring the theoretical factor performance.
It is worth noting that these products have been consistently declining since the beginning of 2018, which made factor investing challenging over the last few years. The drawdown in some of these products has breached 30%, which is less apparent when analyzing long-only factor portfolios given that beta is driving most of the returns.
Source: FactorResearch
FURTHER THOUGHTS
Given the negative performance of classic multi-factor investing over the last two years, it would have been helpful for proponents of this investment framework if some factors would have provided strong positive performance during this crisis. However, the market does not care for wishful thinking and although painful to experience, investors can perhaps find some comfort that these periods are not abnormal from a historical perspective.
RELATED RESEARCH
How to Evaluate Smart Beta ETFs
ABOUT THE AUTHOR
Nicolas Rabener is the CEO & Founder of Finominal, which empowers professional investors with data, technology, and research insights to improve their investment outcomes. Previously he created Jackdaw Capital, an award-winning quantitative hedge fund. Before that Nicolas worked at GIC and Citigroup in London and New York. Nicolas holds a Master of Finance from HHL Leipzig Graduate School of Management, is a CAIA charter holder, and enjoys endurance sports (Ironman & 100km Ultramarathon).
Connect with me on LinkedIn or X.

