Factor Olympics Q2 2022
And the winner is…
July 2022. Reading Time: 10 Minutes. Author: Nicolas Rabener.
SUMMARY
- Value is the clear winner of YTD 2022
- Value, Momentum, and Low Volatility factors were positively correlated, which changed to previous years
- The Quality factor performed worst, which can be explained by a bias towards tech stocks
INTRODUCTION
We present the performance of five well-known factors on an annual basis for the last 10 years. Specifically, we only present factors where academic research supports the existence of positive excess returns across market cycles and asset classes (read Factor Olympics Q1 2022).
METHODOLOGY
Our factors are created by constructing long-short beta-neutral portfolios of the top and bottom 10% of stocks in the US, Europe, and Japan, and 20% in smaller markets. Only stocks with a minimum market capitalization of $1 billion are included. Portfolios rebalance monthly and transactions incur 10 basis points of costs.
FACTOR OLYMPICS: GLOBAL RETURNS
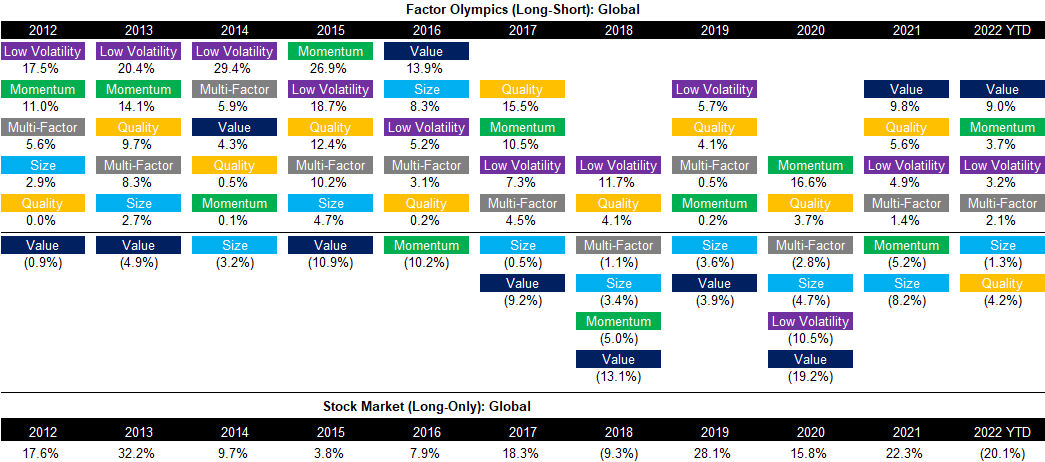
The table below shows the long-short factor performance for the last 10 years ranked top to bottom. The global series is comprised of all developed markets in Asia, Europe, and the US. Aside from displaying the factor performance, the analysis highlights the significant factor rotation in terms of profitability from one year to the next, highlighting the benefits of diversified exposure.
The performance of an equal-weighted multi-factor portfolio was positive as of the first half of 2022, where most of the performance can be attributed to the Value factor. Three out of five factors we highlight generated positive returns and there was no significant negative contributor, making this year one of the best years in recent history for factor investing.

Source: FactorResearch
TRENDS IN GLOBAL FACTOR PERFORMANCE
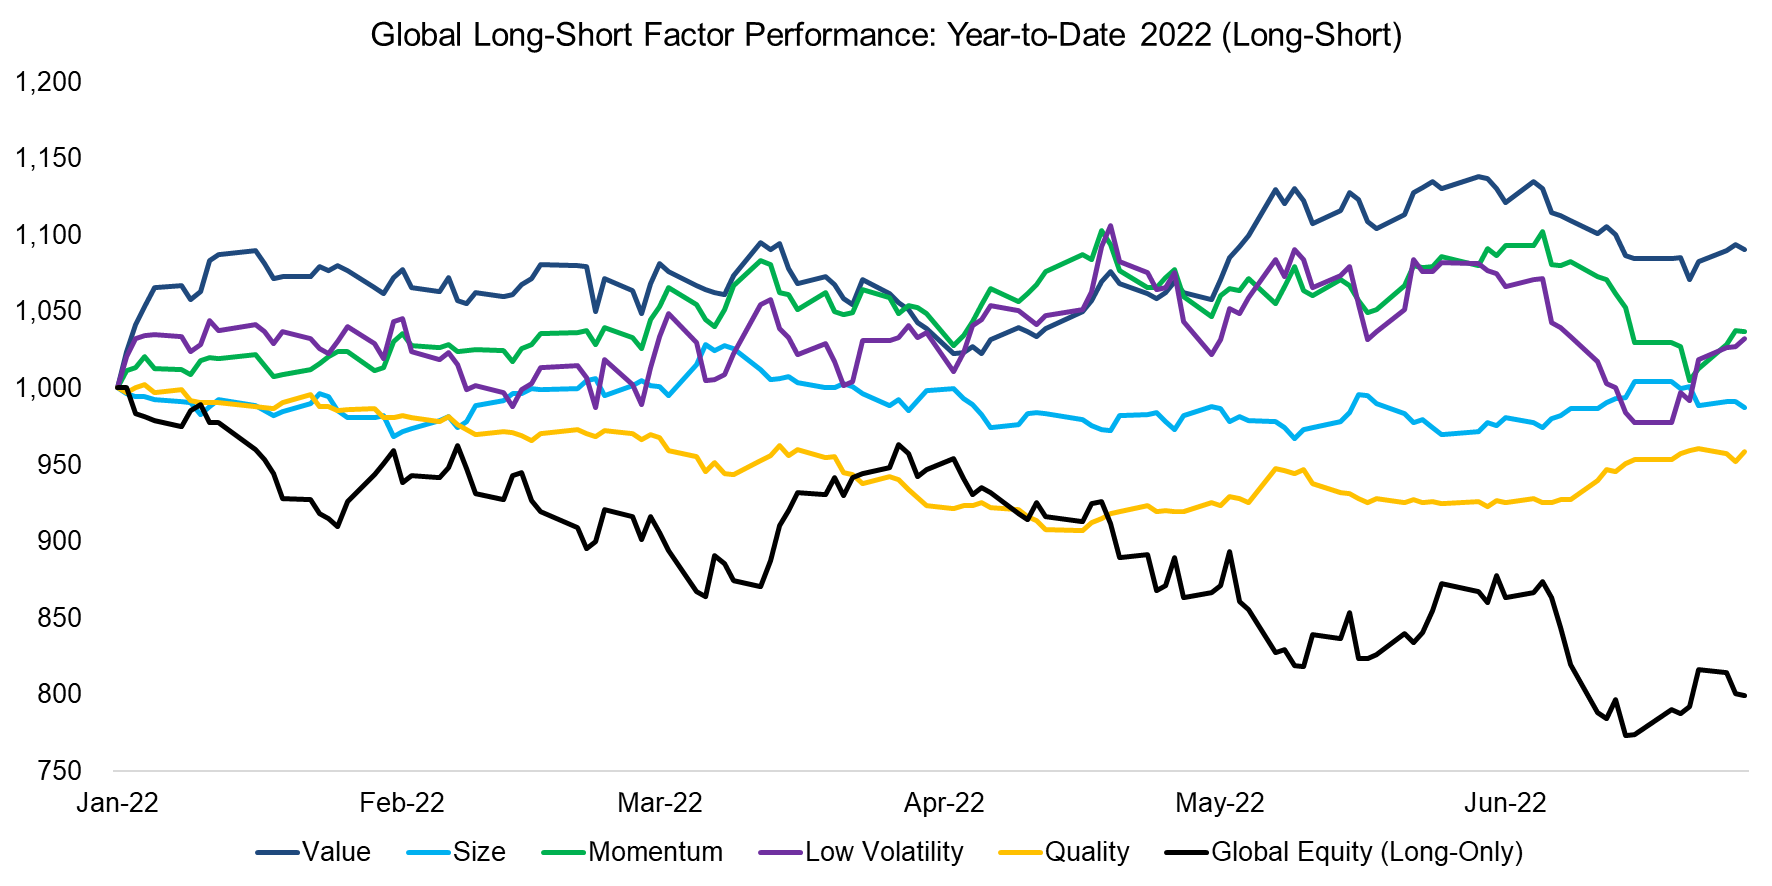
The factor performance in the first half of 2022 is unusual as the trends in the Value, Momentum, and Low Volatility factors were identical. In the last few years, Momentum and Low Volatility factors were positively correlated, but strongly negatively correlated to Value. Given that the trends are identical indicates that the correlations have changed.
The strong performance of the Value and Low Volatility factors can be attributed to the downturn in expensive and volatile technology stocks. For most years in the recent decade tech stocks were in the long portfolio of the Momentum factor as they have been the best-performing stocks, but the decline in the tech sector has been going on long enough that they rotated out of the long portfolio, where they were partially replaced by cheap and low volatile stocks, and have been moving into the short portfolio.

Source: FactorResearch
PERFORMANCE OF LONG-SHORT MULTI-FACTOR PRODUCTS
There are only a few liquid alternative mutual funds and ETFs that provide exposure to factors in the long-short format as seen in academic research. Given the poor performance of factor investing in recent years, many products were liquidated.
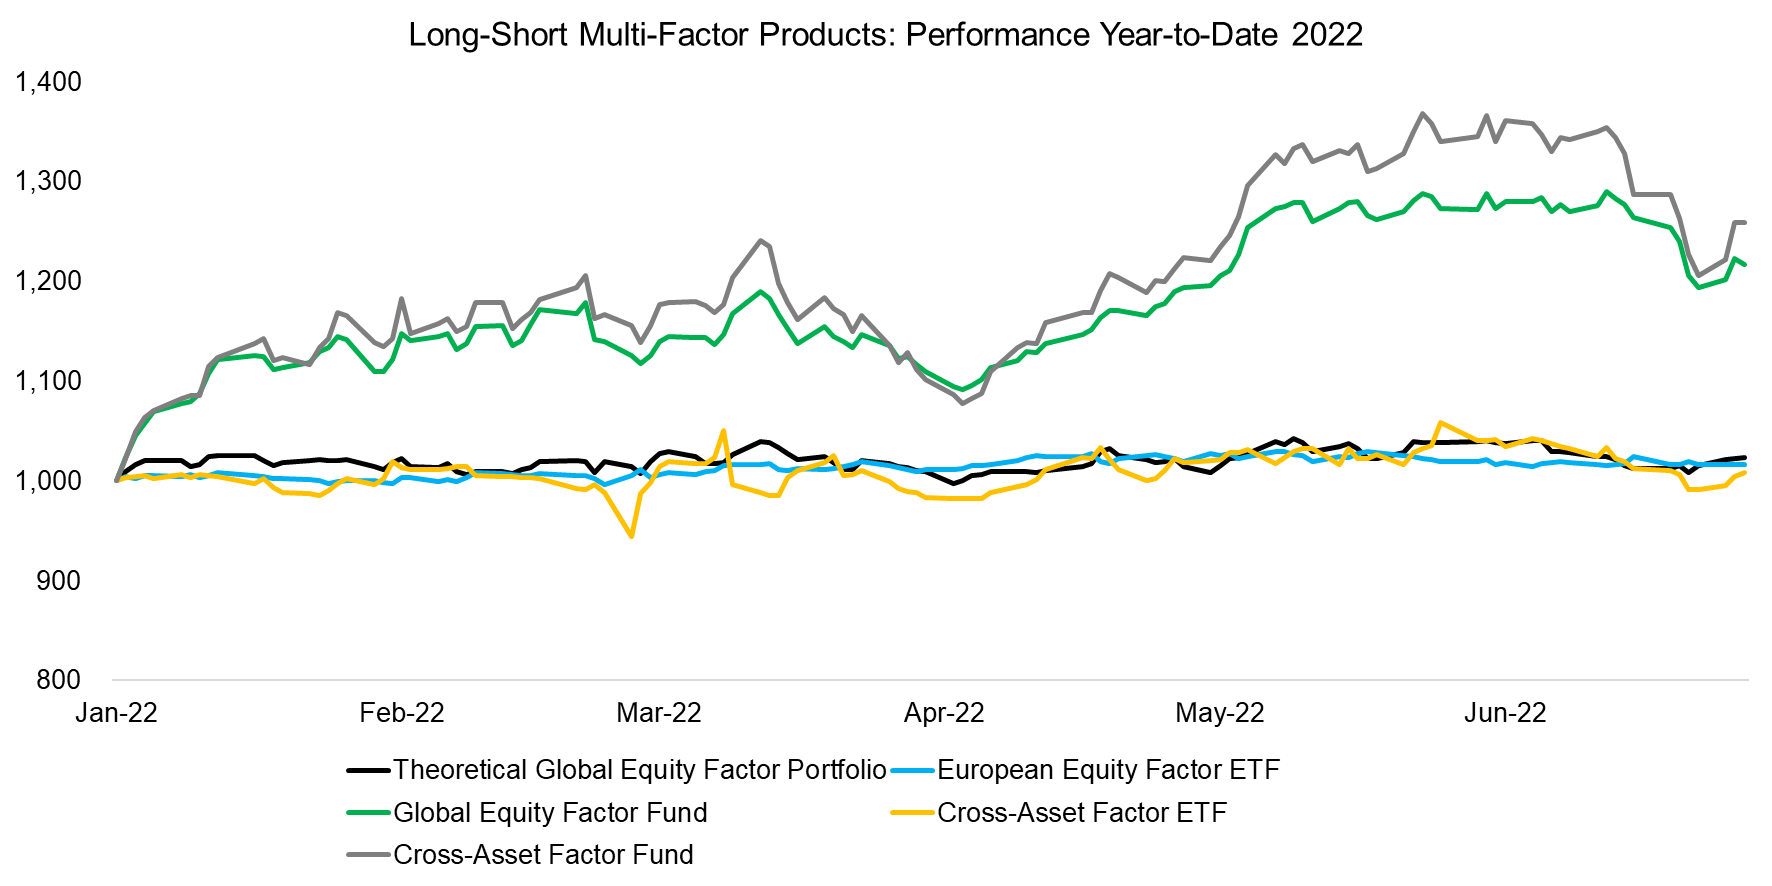
The European multi-factor equity fund (MKTN) generated similar a return to the theoretical multi-factor portfolio, which was essentially zero in year-to-date 2022. The multi-factor cross-asset ETF (FLSP) exhibited slightly higher volatility, but also failed to generate positive returns.
The global multi-factor equity (QMNIX) and multi-factor cross-asset (QSPRX) funds are from the same asset management company (AQR) and generated strong returns. The cross-asset fund has a large allocation to equity factors that explains the high correlation between these two products. Both have significant exposure to the Value factor, which performed well in the first half of 2022.

Source: FactorResearch
SMART BETA EXCESS RETURNS
Although investors should allocate to factors constructed as long-short portfolios given that these offer high diversification benefits, most invest via long-only smart beta ETFs. Following the money, we highlight the excess returns generated from investing in smart beta ETFs in the US, which represents a universe of 160+ products and approximately $800 billion of assets under management.
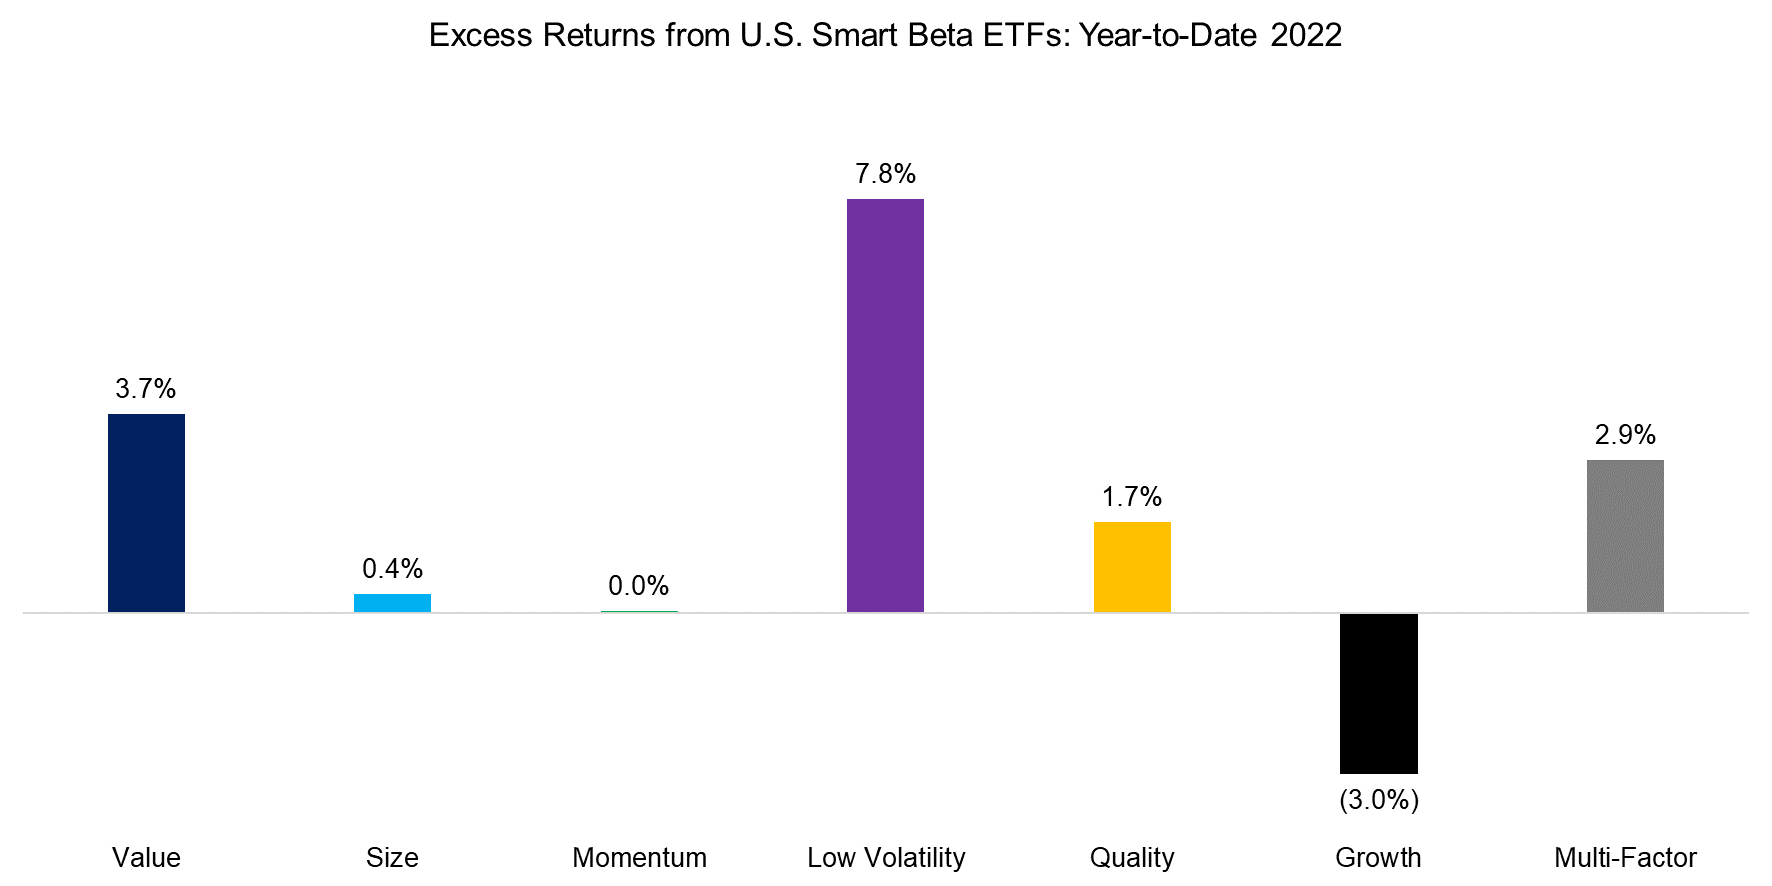
The returns will naturally be somewhat different as long-short factor portfolios are constructed beta-neutral, i.e. there is a short portfolio and leverage is used to achieve beta-neutrality, and stocks are typically weighted equally. Smart beta ETFs are long-only and mostly weight stocks by their market capitalization.
The performance of the long-short factors and excess returns of smart ETFs overlapped primarily for Value and Low Volatility. The key divergence is for the Quality factor, where the long-short performance was negative but smart beta excess returns were positive. We use leverage and profitability ratios when constructing the long-short portfolio, which provided net exposure to tech stocks as these typically feature low leverage. Given the downturn in tech stocks, the factor performance was negative. There were only five smart beta ETFs in our sample and their definition for quality stocks was heteregenous, which resulted in differentiated performance.

Source: FactorResearch
FACTOR CORRELATIONS
The correlation matrix below highlights the global one-year factor correlations based on daily data. The current correlations highlight a scenario that is remniscient of the tech bubble in 2000, where the Value and Low Volatility factors were positively correlated, which is different to the previous years. The positive correlation between Value and Momentum is also less frequently seen (read Factors: Correlation Check).

Source: FactorResearch
FURTHER THOUGHTS
Traditional factor investing has been under attack essentially since the global financial crisis in 2008, where buying cheap stocks, mainly financials then, proved an almost fatal strategy. The years thereafter were equally difficult as investors allocated significant amounts of capital into primarily unprofitable (tech) companies that traded at expensive valuations.
The investor sentiment seems to have changed in 2021 and rising interest rates in 2022 have accelerated the shift away from expensive tech companies, which benefitted the Value and Low Volatility factors. Factor investing will always remain cyclical as there is no free lunch, but it is rewarding to see that this investing framework continues to work well and has not stopped working as often voiced by critics.
RELATED RESEARCH
Defensive and Diversifying Strategies in YTD 2022
Improving the Odds of Value Investing
ABOUT THE AUTHOR
Nicolas Rabener is the CEO & Founder of Finominal, which empowers professional investors with data, technology, and research insights to improve their investment outcomes. Previously he created Jackdaw Capital, an award-winning quantitative hedge fund. Before that Nicolas worked at GIC and Citigroup in London and New York. Nicolas holds a Master of Finance from HHL Leipzig Graduate School of Management, is a CAIA charter holder, and enjoys endurance sports (Ironman & 100km Ultramarathon).
Connect with me on LinkedIn or X.

