Factor Olympics Q3 2021
And the winner is…
October 2021. Reading Time: 10 Minutes. Author: Nicolas Rabener.
SUMMARY
- 2021 is shaping up as a year of undifferentiated factor performance
- Value is the only factor with positive performance in year-to-date 2021
- The Size factor has generated the most negative returns
INTRODUCTION
We present the performance of five well-known factors on an annual basis for the last 10 years. Specifically, we only present factors where academic research supports the existence of positive excess returns across market cycles and asset classes (read Factor Olympics Q2 2021).
METHODOLOGY
Our factors are created by constructing long-short beta-neutral portfolios of the top and bottom 10% of stocks in the US, Europe, and Japan, and 20% in smaller markets. Only stocks with a minimum market capitalization of $1 billion are included. Portfolios rebalance monthly and transactions incur 10 basis points of costs.
FACTOR OLYMPICS: GLOBAL RETURNS
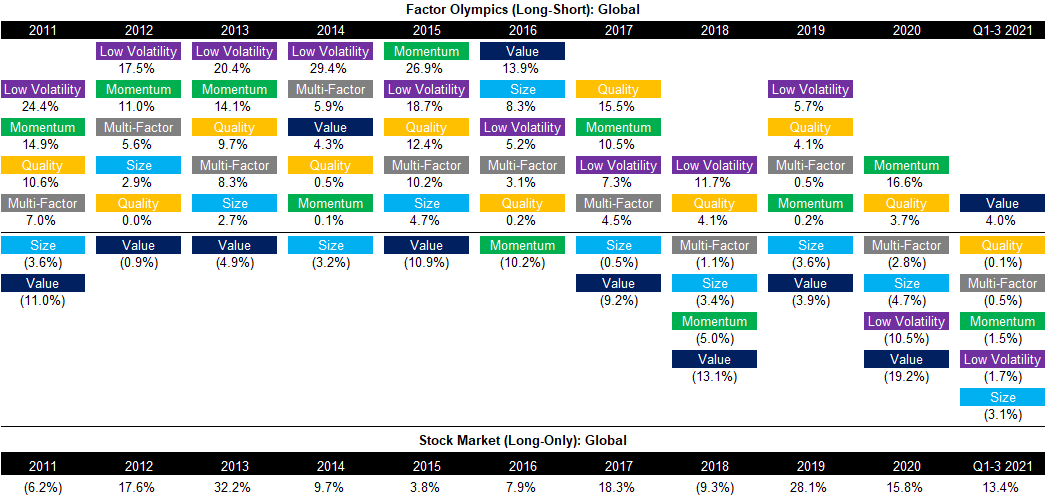
The table below shows the long-short factor performance for the last 10 years ranked top to bottom. The global series is comprised of all developed markets in Asia, Europe, and the US. Aside from displaying the factor performance, the analysis highlights the significant factor rotation in terms of profitability from one year to the next, highlighting the benefits of diversified exposure.
Unfortunately, even a portfolio diversified across the academically recognized factors would have generated a loss in 2021, albeit a minor one, similar to previous years. The last year where a multi-factor portfolio generated a meaningful positive return was in 2017, which is a lifetime away for a fund manager.

Source: FactorResearch
TRENDS IN GLOBAL FACTOR PERFORMANCE
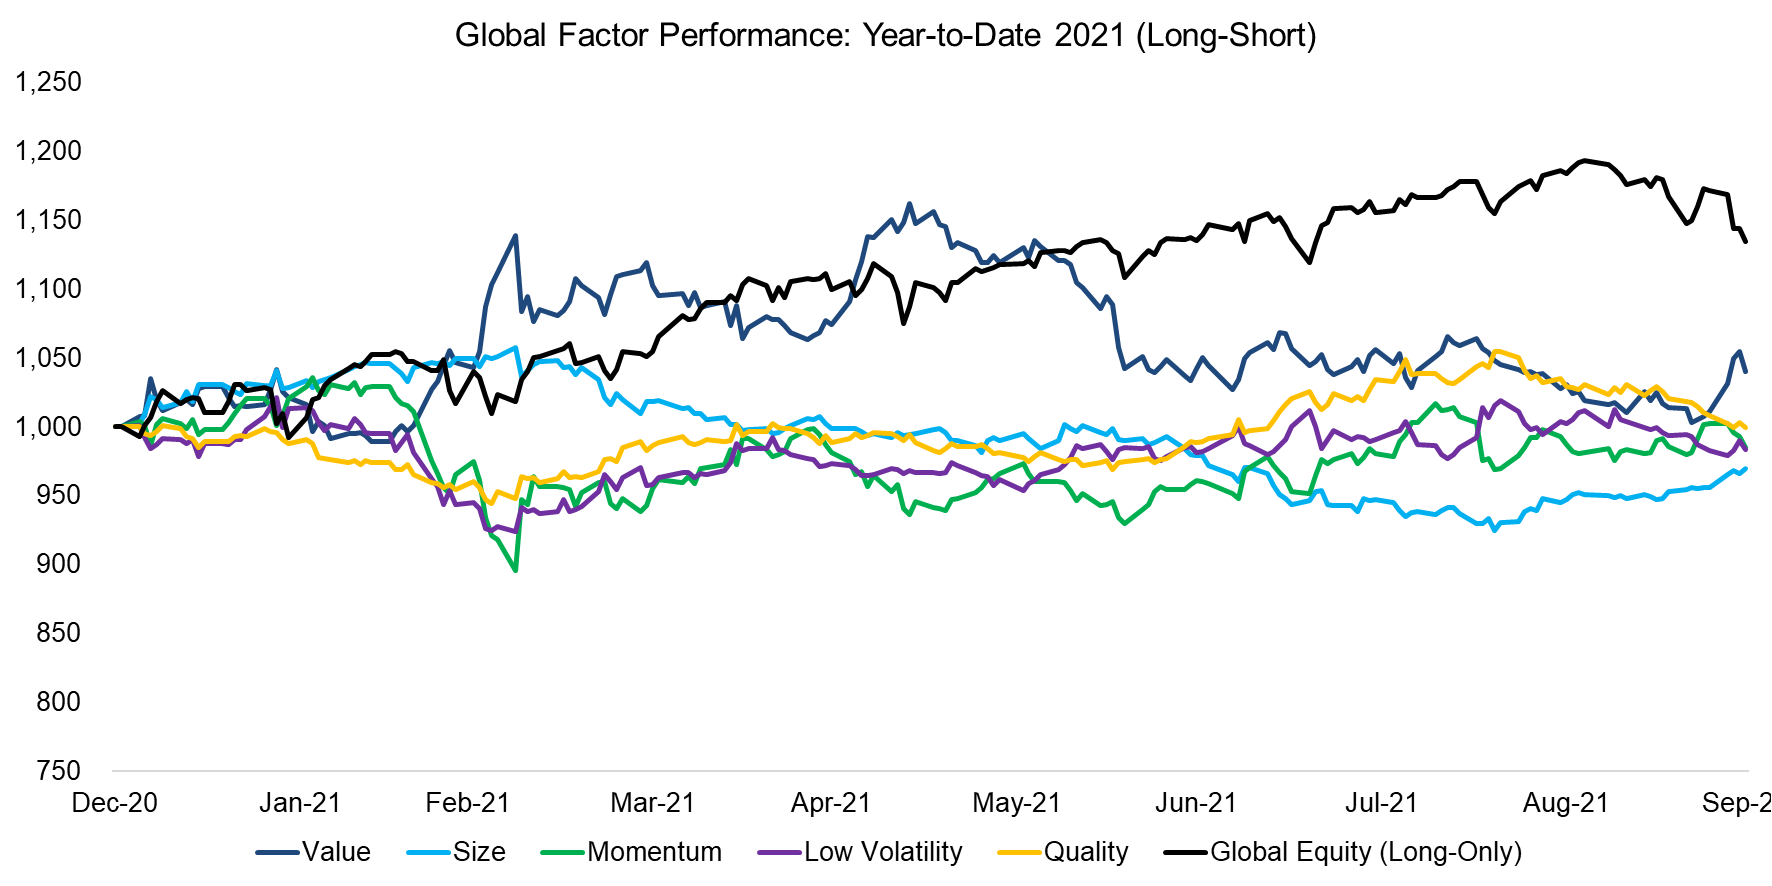
The first half-year of 2021 highlighted differentiated factor performance with Value showing strongly positive returns, and all other factors slightly negative ones. However, the Value rally began to unwind at the end of Q2 and as of the end of Q3, the factor is showing only a small gain.
It is interesting that the Value and Size factors have diverged in 2021 as these factors tend to behave similarly, which can be attributed to both being primarily driven by risk sentiment. The market risk has not been at high levels as measured by the VIX and the market as well as factor volatility has steadily decreased since the beginning of the year.

Source: FactorResearch
PERFORMANCE OF LONG-SHORT MULTI-FACTOR PRODUCTS
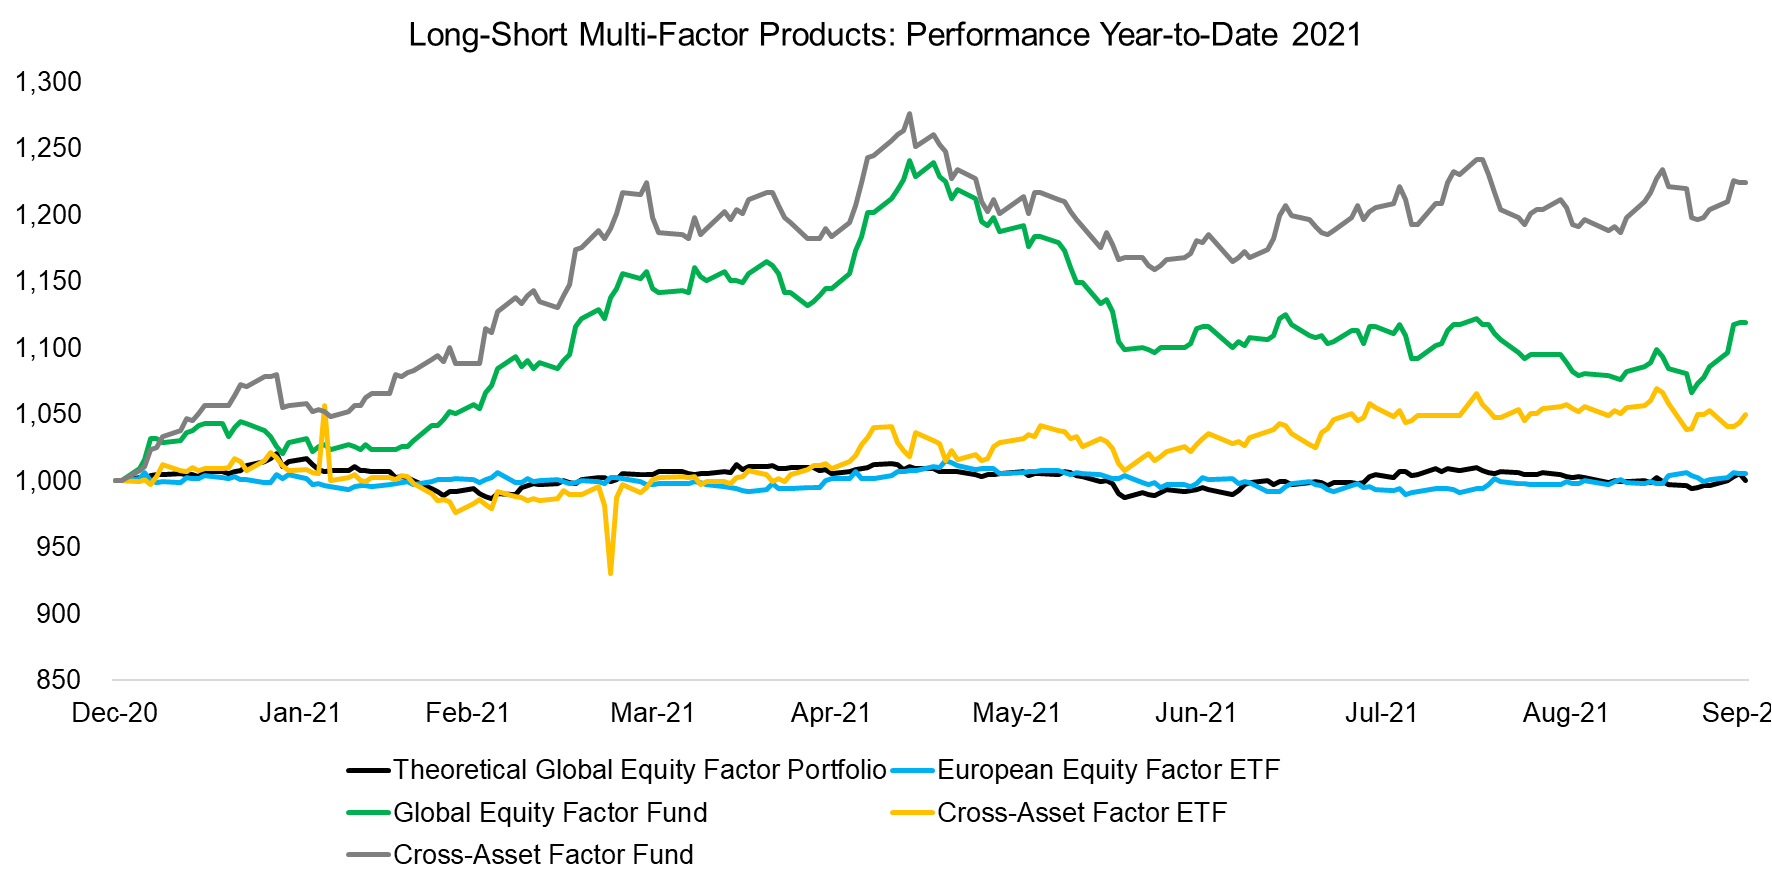
There are only a few liquid alternative mutual funds and ETFs that provide exposure to factors in the long-short format as seen in academic research. Given the poor performance of factor investing in recent years, many products were liquidated.
We highlight the performance of four surviving products and observe rather divergent performance in the three quarters of 2021. The Global Equity Factor and Cross- Asset Factor Fund are from the same asset management company, and equities represents the largest allocation within the cross-asset fund, which explains why they are highly correlated. Their performance reflects a large exposure to the Value factor, which performed well in the first half of 2021, but less well in the third quarter.
The European multi-factor equity fund generated similar returns to the theoretical multi-factor portfolio, which was essentially zero year-to-date 2021. Most interesting is the performance of the cross-asset ETF, which has started to generate relatively consistent returns in the second and third quarters. The overall return is less than 5%, but that is perfectly fine for an uncorrelated strategy that offers diversification benefits.

Source: FactorResearch
SMART BETA EXCESS RETURNS
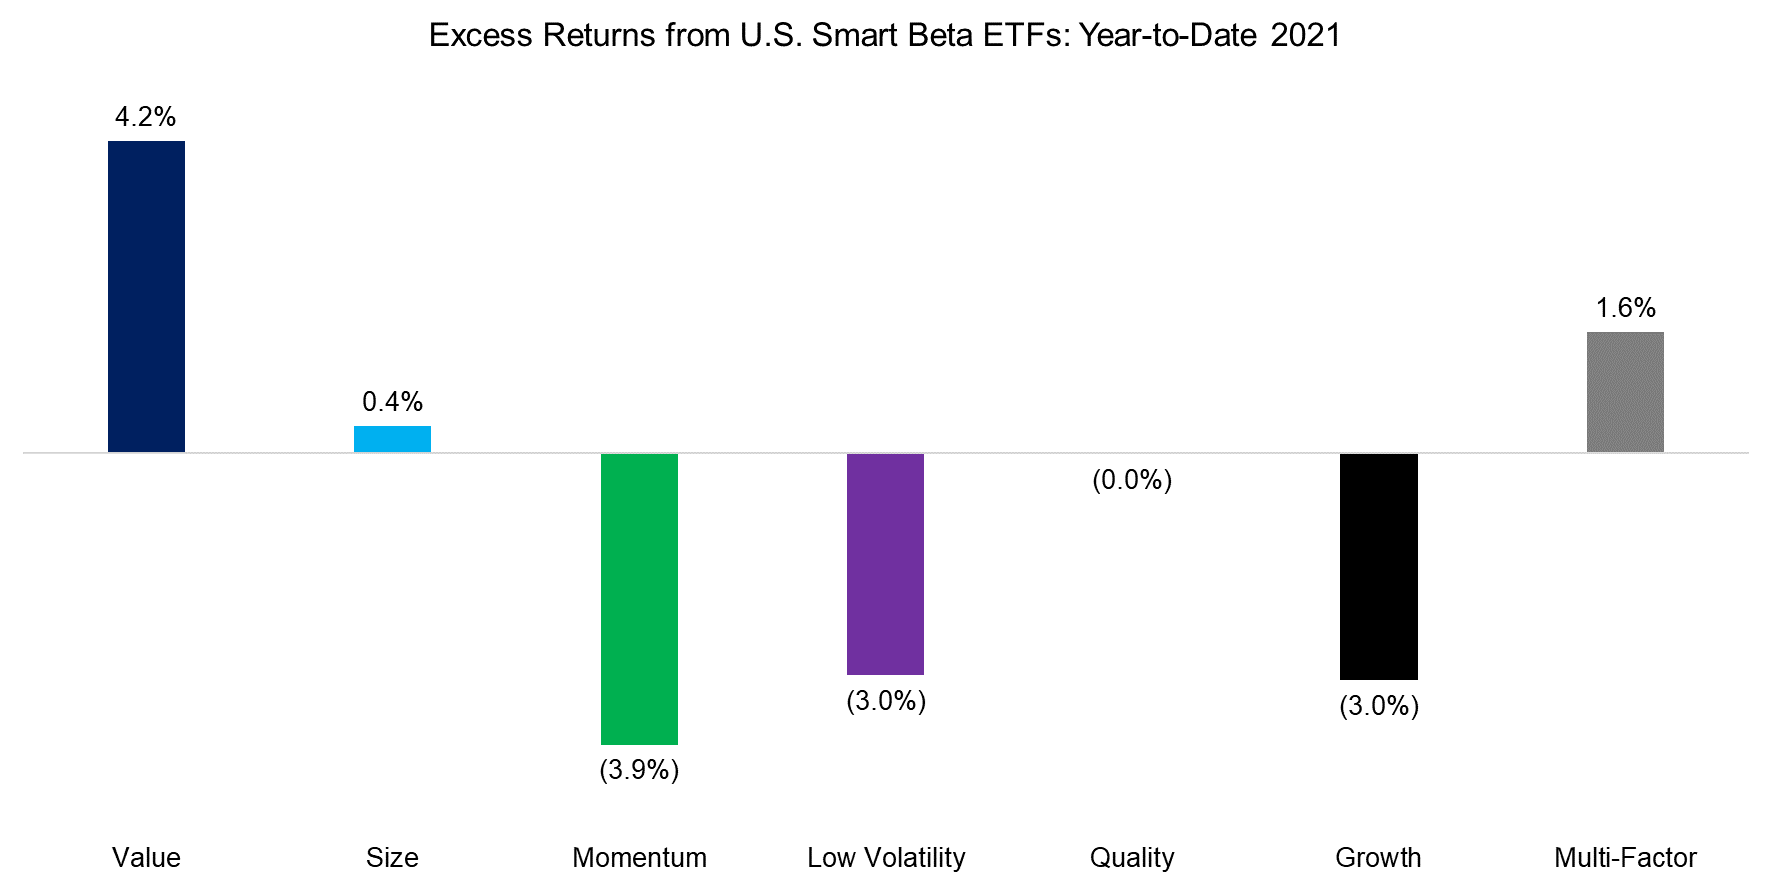
Although investors should allocate to factors constructed as long-short portfolios given that these offer high diversification benefits, most invest via long-only smart beta ETFs. Following the money, we highlight the excess returns generated from investing in smart beta ETFs in the US, which represents a universe of 170+ products and approximately $800 billion of assets under management (read Multi-Factor Smart Beta ETFs).
The returns will naturally be somewhat different as long-short factor portfolios are constructed beta-neutral, i.e. there is a short portfolio and leverage is used to achieve beta-neutrality, and stocks are typically weighted equally. Smart beta ETFs are long-only and mostly weight stocks by their market capitalization.
We observe that the trends in performance from long-only factor investing were approximately the same as when allocating to long-short portfolios, except for the Size factor and multi-factor portfolio. The positive return of the latter is likely explained by most multi-factor products having exposure to Value, which has been the best performing factor in 2021.

Source: FactorResearch
FACTOR CORRELATIONS
The correlation matrix below highlights the global one-year factor correlations based on daily data. As of the third quarter of 2021, we observe correlation clusters that are somewhat structural and have frequently shown in recent years. Value and Size were positively correlated, same as for Momentum, Low Volatility, and Quality. These two clusters were negatively correlated.

Source: FactorResearch
FURTHER THOUGHTS
As we are getting closer to the year-end, it seems that 2021 will go down as another year that factor investing-focused managers would like to forget. Although the performance for a multi-factor portfolio was only slightly negative (and positive for smart beta) year-to-date, it is not helpful given the poor performance in recent years.
At least Value, the most common factor in multi-factor portfolios, has generated positive returns in 2021. Furthermore, the valuation spread, i.e. the difference between how the stocks in the long (cheap) and stocks in the short (expensive) portfolio trade, is at historic highs, which provides a favourable long-term outlook.
RELATED RESEARCH
Improving the Odds of Value Investing
ABOUT THE AUTHOR
Nicolas Rabener is the CEO & Founder of Finominal, which empowers professional investors with data, technology, and research insights to improve their investment outcomes. Previously he created Jackdaw Capital, an award-winning quantitative hedge fund. Before that Nicolas worked at GIC and Citigroup in London and New York. Nicolas holds a Master of Finance from HHL Leipzig Graduate School of Management, is a CAIA charter holder, and enjoys endurance sports (Ironman & 100km Ultramarathon).
Connect with me on LinkedIn or X.

