Factor Portfolios: Turnover Analysis
What’s my Portfolio Churn?
March 2018. Reading Time: 10 Minutes. Author: Nicolas Rabener.
SUMMARY
- Factor portfolios have an annual turnover over more than 100%
- The turnover rate varies substantially across factors
- Decreasing the rebalancing frequency reduces turnover, but also risk-return ratios
INTRODUCTION
Some ETF investors claim that passive index products are superior to actively managed funds due to lower turnover and therefore less transaction costs. While this is partially true, most investors are unlikely to be familiar that indices such as the S&P 500 have a relatively high amount of turnover. The average tenure in the S&P 500 has decreased from 33 years in 1964 to 24 years in 2016, which implies an 8% turnover per annum, and is expected to shrink further. Stated differently, about half of the current members of the index will be replaced over the next 10 years, which is not in line with a buy-and-hold philosophy. In the factor investing space the high turnover of factor portfolios is often cited as a reason for the mediocre performance of live investible factor-based products compared to their theoretical backtesting. In this short research note we will analyse the turnover of common equity factors in the US.
METHODOLOGY
We focus on seven factors namely Value, Size, Momentum, Low Volatility, Quality, Growth and Dividend Yield as well as a multi-factor portfolio, which allocates equally to these. The factors are created by constructing long-short beta-neutral portfolios of the top and bottom 10% of stocks of the US stock market. The multi-factor portfolio is based on the intersectional model, which selects the stocks in the intersection of the factors (read Multi-Factor Models 101). Only stocks with a market capitalisation of larger than $1 billion are included. Portfolios are rebalanced monthly and each transaction occurs costs of 10 basis points.
TRADABLE STOCK UNIVERSE
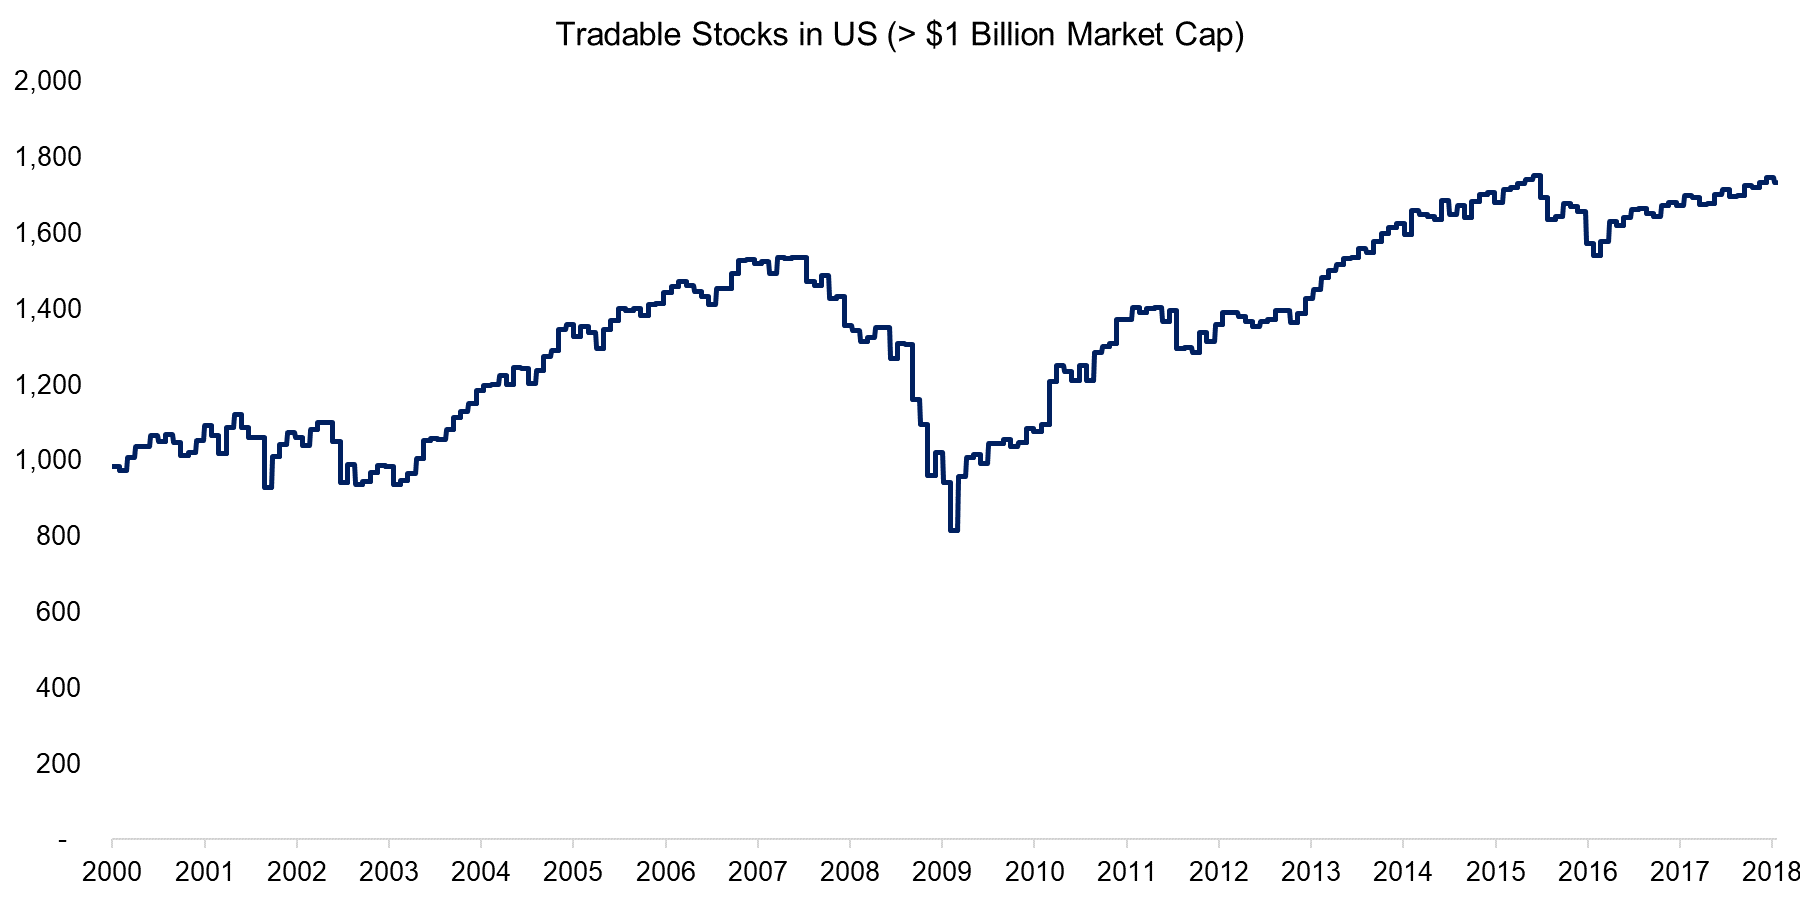
Before we analyse the factor turnover, it is worth providing details on the factor construction. Our universe of stocks in the US includes all companies with a minimum market capitalisation of $1 billion, which equates to approximately 1,700 stocks as of the first quarter of 2018. Portfolios are created by the top and bottom 10% of the stock market ranked by a factor, which results in a long-short portfolio of approximately 340 stocks. The chart below shows the number of stocks available since 2000, which fluctuates with the ups and downs of the stock market given the minimum market capitalisation constraint.
Source: FactorResearch
VALUE FACTOR US: TURNOVER PER ANNUM
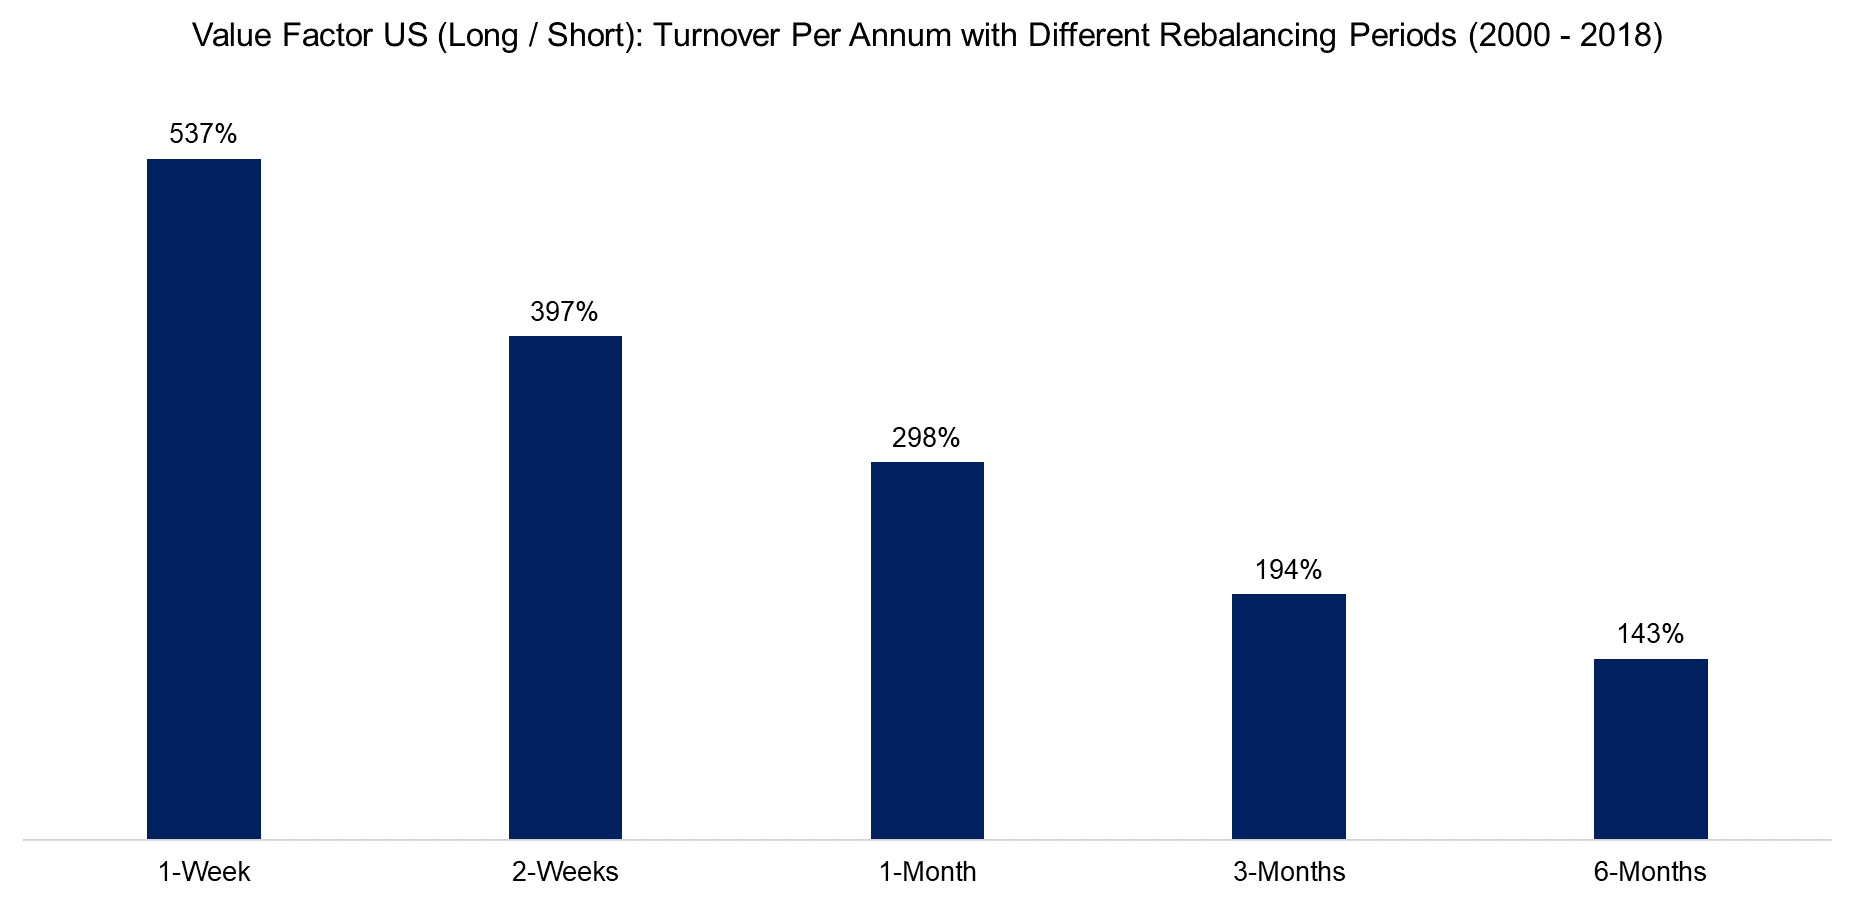
The chart below shows the turnover per annum of a long-short portfolio of Value stocks, which are defined by a combination of book-value and price-earnings multiples, in the US for different rebalancing periods. We can observe that even with monthly rebalancing, which might be considered the standard for institutional investors on average, the turnover per annum is significantly above 100%.
Source: FactorResearch
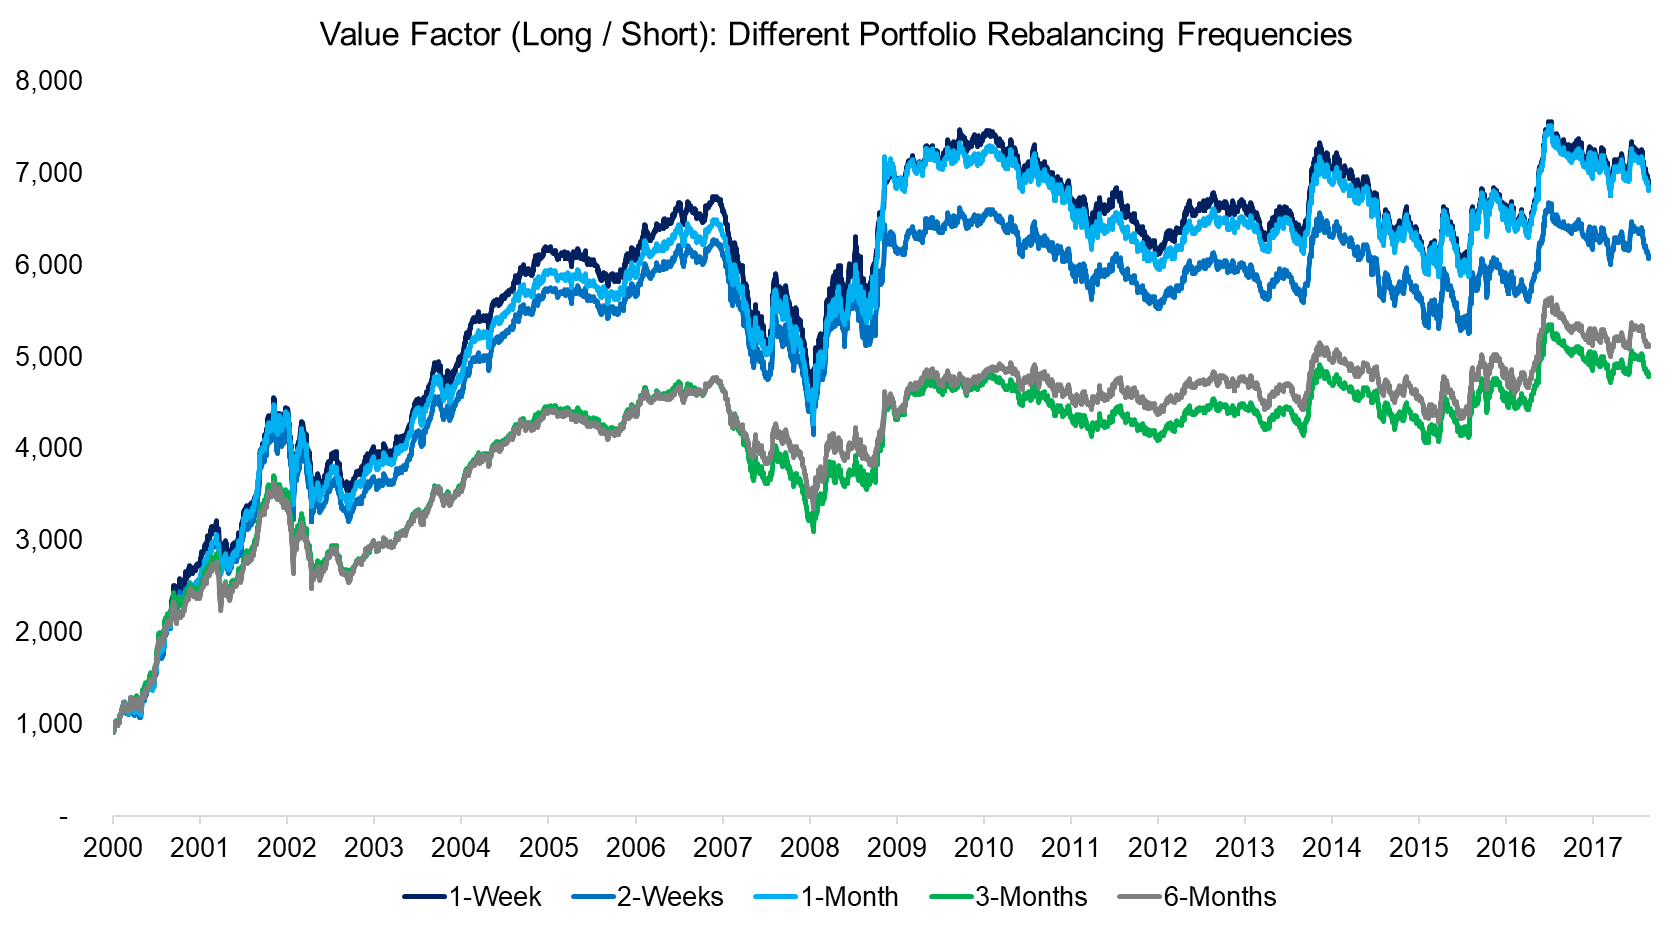
Investors concerned with the high turnover can consider reducing the rebalancing frequency. The chart below highlights the performance of the Value factor (long-short) in the US at different rebalancing periods and we can observe similar profiles for weekly to monthly rebalancing while quarterly and semi-annually were less attractive for the period from 2000 to 2017. Weekly rebalancing repositions the portfolio more quickly to opportunities, but naturally at the expense of higher turnover and more transaction costs.
Source: FactorResearch
TURNOVER PER ANNUM ACROSS FACTORS & A MULTI-FACTOR PORTFOLIO
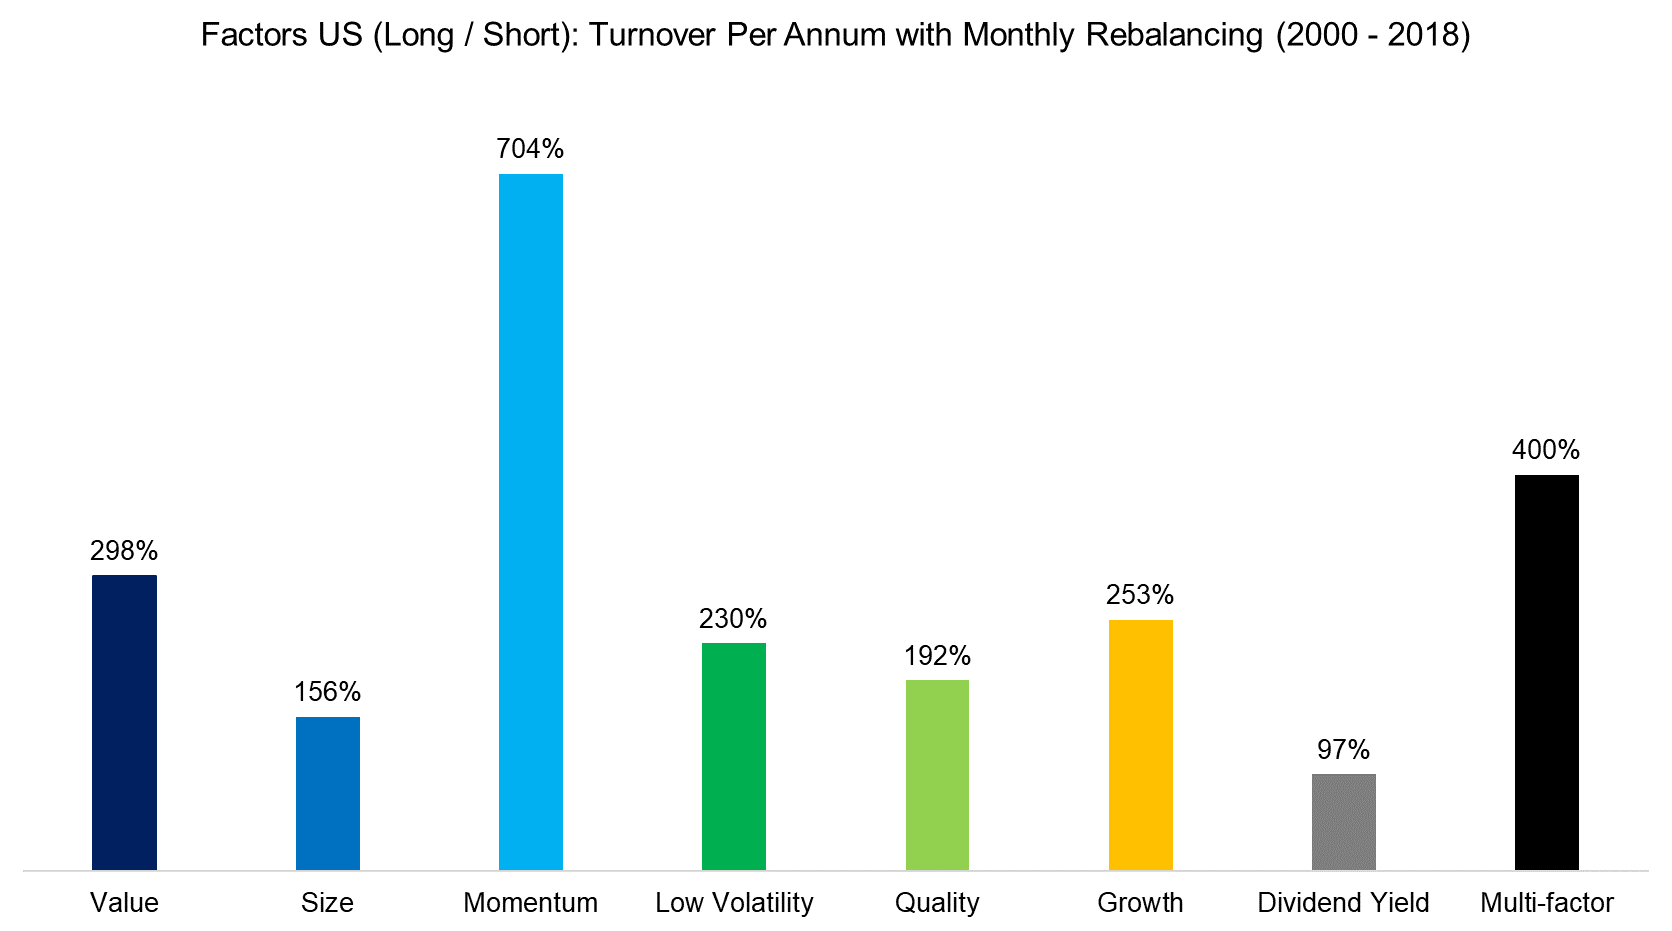
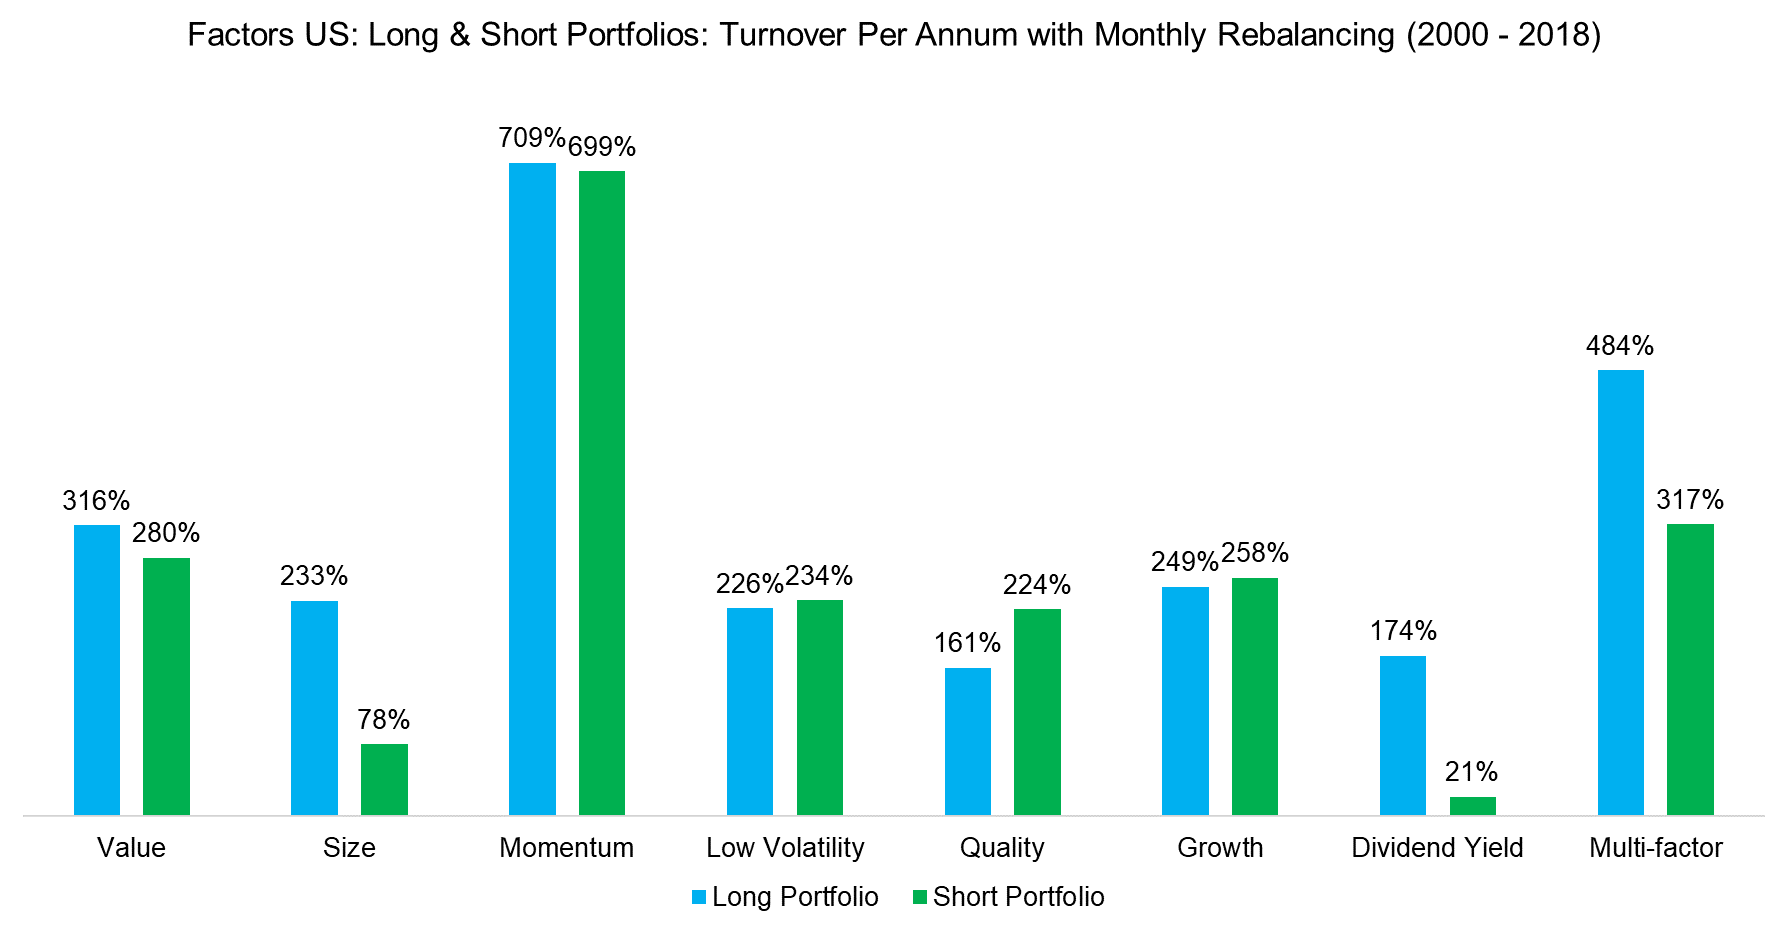
The chart below shows the turnover per annum for seven common factors and a multi-factor portfolio with monthly rebalancing. We can observe that Momentum has the highest turnover, which can be explained by the factor definition of buying the winning and shorting the losing stocks as these change constantly, highlighting the Darwinian nature of the stock market. The multi-factor portfolio shows the second highest turnover while Dividend Yield has the lowest turnover. It is interesting to observe that factors like Quality and Growth, which are exclusively based on fundamental data and not price-based, still show a relatively high turnover. Fundamental data in the US gets released on a quarterly basis, but naturally companies release their data on different dates. Factor definitions play a role as well and the shorter the lookback, e.g. one-year versus three-year earnings growth, the more turnover can be expected.
Source: FactorResearch
In addition to analysing the turnover of factors on portfolio level, we can also differentiate between the long and short portfolios. We can observe that the turnover is spread equally over the long and short portfolios for most factors, except for Size and Dividend Yield. The turnover of the short portfolio of the Size factor is significantly lower than that of the long portfolio, which can be explained that large companies, e.g. Microsoft, which comprise the short portfolio, tend to stay large and not change too often. The short portfolio of the Dividend Yield factor also shows relatively low turnover, which can be explained that these are companies that pay no dividend, e.g. technology companies, and therefore remain in the short portfolio for long periods of time.
Source: FactorResearch
FURTHER THOUGHTS
This short research note highlights the turnover per annum of common factors and a multi-factor portfolio, which is relatively high with monthly rebalancing compared to an equity index like the S&P 500. The disadvantages of elevated turnover rates are high transaction costs, unfavourable taxation and more operational complexity. However, decreasing the turnover by moving to less frequent rebalancing than monthly leads to less attractive risk-return ratios as we highlighted in our recent report Factor Construction: Portfolio Rebalancing. Portfolio managers should evaluate the benefits of higher risk-adjusted returns on a post tax-basis assuming different transaction and market impact costs, which is a challenging analysis given the numerous inputs required.
ABOUT THE AUTHOR
Nicolas Rabener is the CEO & Founder of Finominal, which empowers professional investors with data, technology, and research insights to improve their investment outcomes. Previously he created Jackdaw Capital, an award-winning quantitative hedge fund. Before that Nicolas worked at GIC and Citigroup in London and New York. Nicolas holds a Master of Finance from HHL Leipzig Graduate School of Management, is a CAIA charter holder, and enjoys endurance sports (Ironman & 100km Ultramarathon).
Connect with me on LinkedIn or X.

