Factor Returns: Year-End Calendar Effects
Momentum in December versus Value & Size in January?
December 2017. Reading Time: 10 Minutes. Author: Nicolas Rabener.
SUMMARY
- Value & Size generate abnormally large positive returns in January, Momentum negative returns
- Abnormal returns are limited to the last week of December and first week of January
- Difficult to harvest these returns efficiently due to illiquidity of markets at these times
INTRODUCTION
At this time of the year investors tend to receive market outlooks for 2018 from a variety of service providers. These can be used by investors to contrast their own views and ultimately position their portfolios. The long-term returns for equities, bonds and real estate are unlikely to be attractive given high valuations from years of quantitative easing by the world’s central banks. However, economies around the globe are showing healthy growth and perhaps the next few years will continue to generate positive returns for investors. Aside from strategic allocation questions, investors can also consider more short-term tactical allocations. Factor returns are known to be influenced by year-end calendar effects, which can potentially be exploited over the next few weeks. In this short research note we will analyse factor returns and year-end calendar effects from a tactical trading perspective.
METHODOLOGY
We focus on Value, Size and Momentum and use Fama-French data, which is available for the US from 1926 to 2017 and for international markets from 1990 to 2017. Portfolios are created by taking the top and bottom 10% of the US stock market and top and bottom 30% in other markets. The long-short portfolios are dollar-neutral and exclude transaction costs (read Factor Construction: Beta vs $-Neutrality).
CALENDAR EFFECTS IN THE US
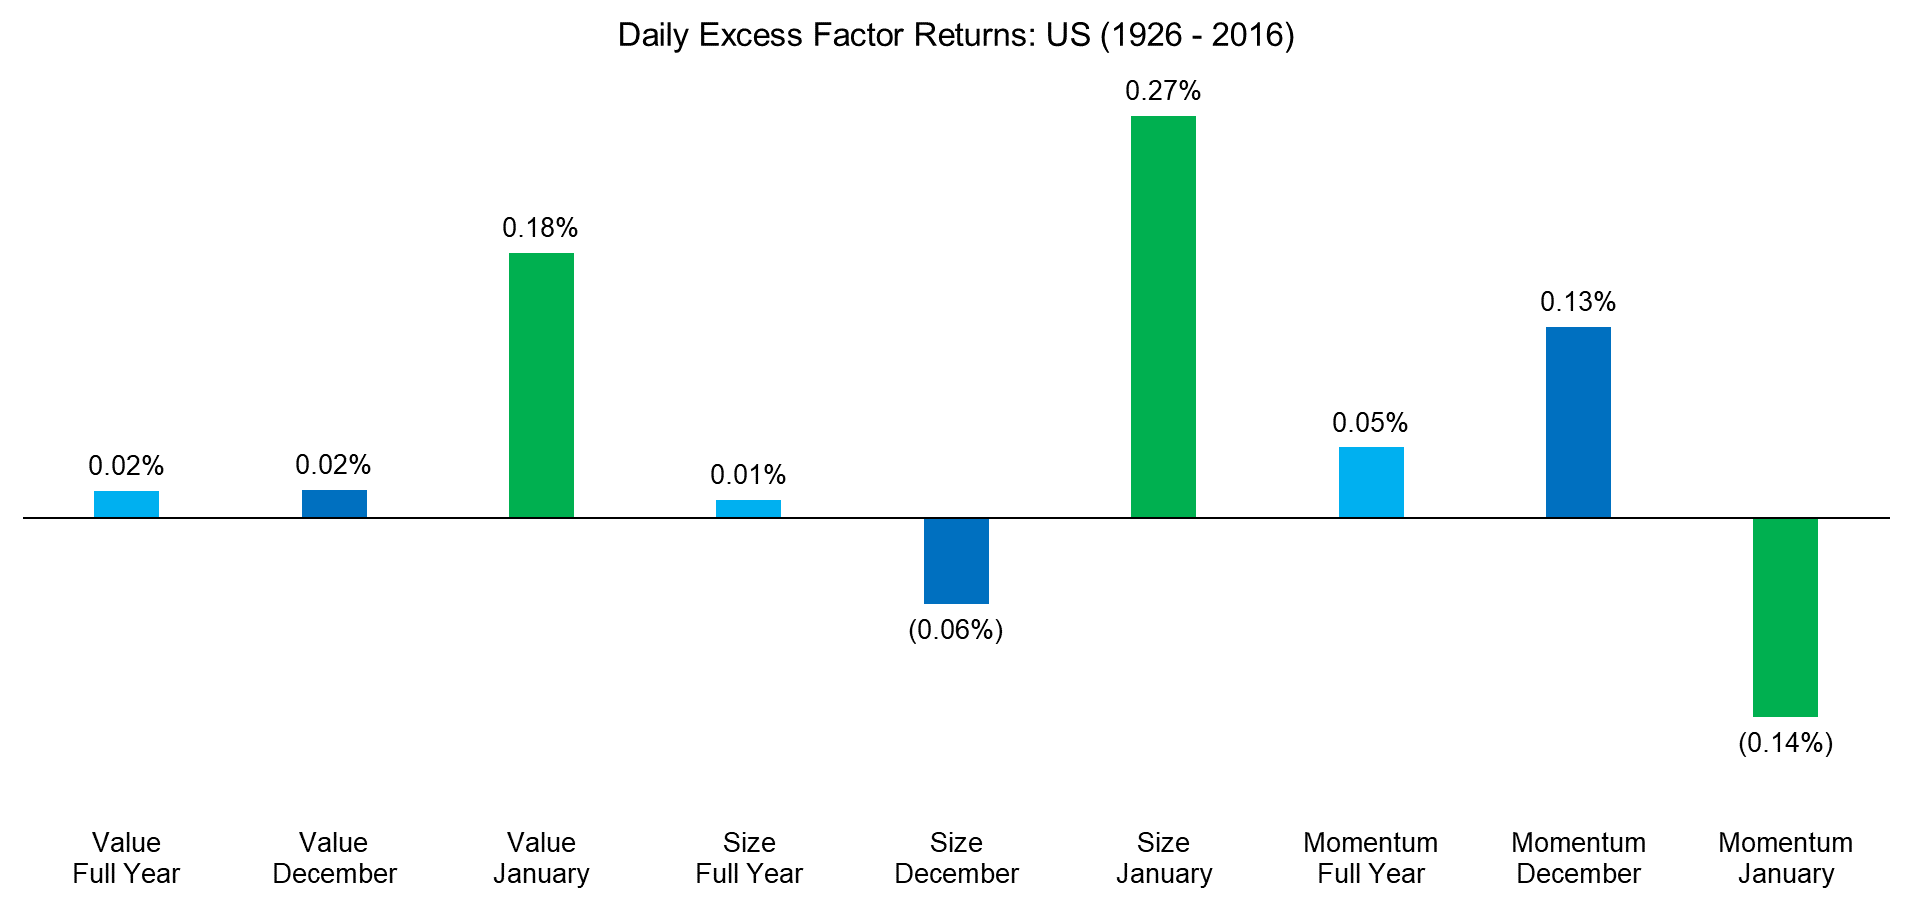
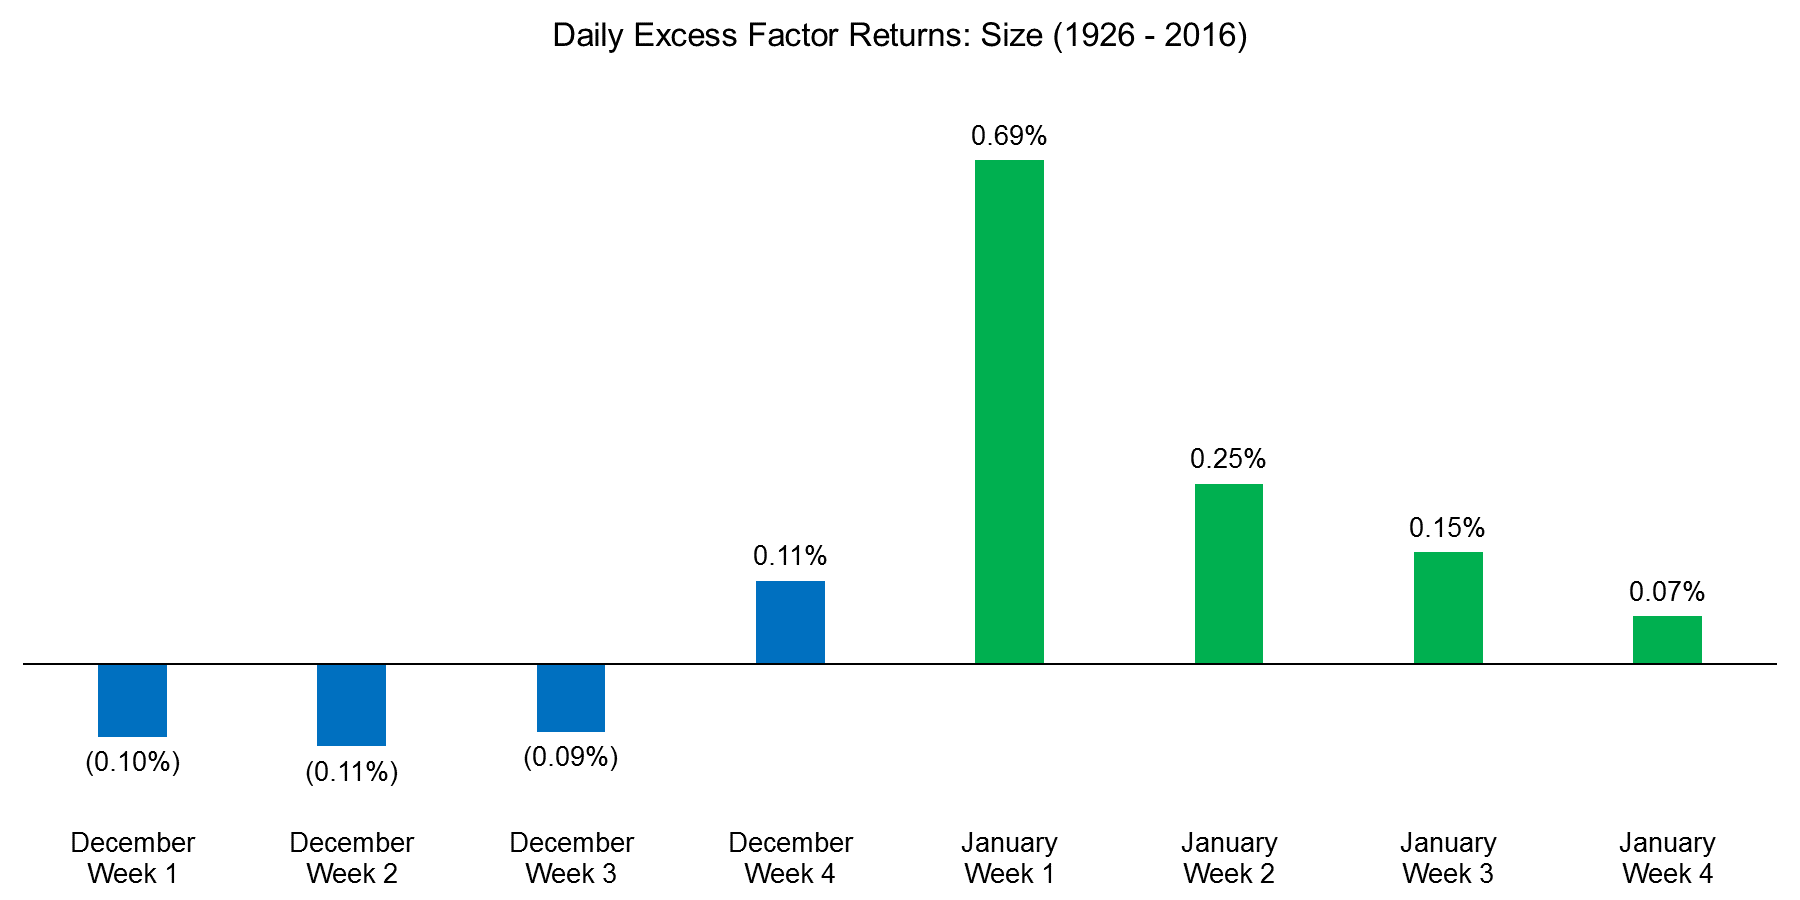
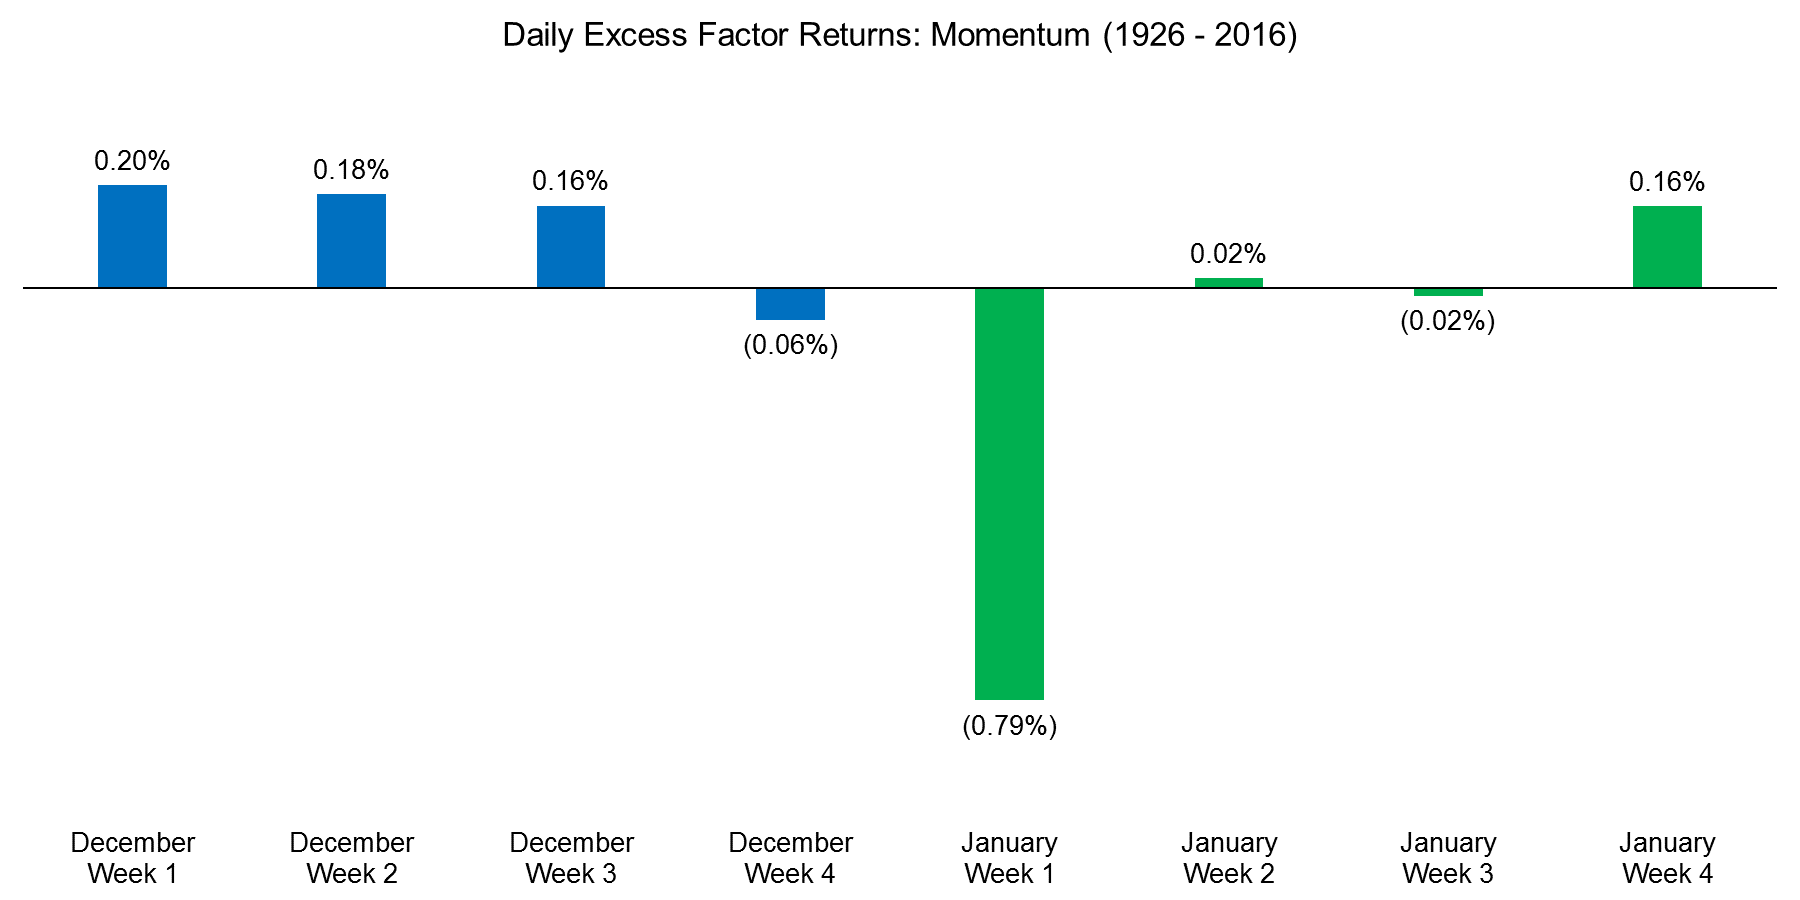
The chart below shows the daily excess returns for the Value, Size and Momentum factors for the period from 1926 to 2016. The analysis highlights that the returns in December were abnormally negative for Size and abnormally positive for Momentum. In January we can observe a reversal and the returns were abnormally large for Value and Size while abnormally negative for Momentum. There are several theories explaining these unusual return distributions; two key ones being window dressing and tax-loss selling. Window dressing refers to fund managers buying the top performing stocks for their year-end investor reports, which boosts Momentum in December and depresses the factor in January as the stocks are then sold again. Tax-loss selling refers to investors disposing stocks with significant losses, which are often stocks that became cheaper (Value) and smaller (Size) during the year, in order to lower or eliminate capital gains taxes on other investments (read There is Value in the Value Factor).
Source: Fama-French, FactorResearch
CALENDAR EFFECTS IN INTERNATIONAL MARKETS
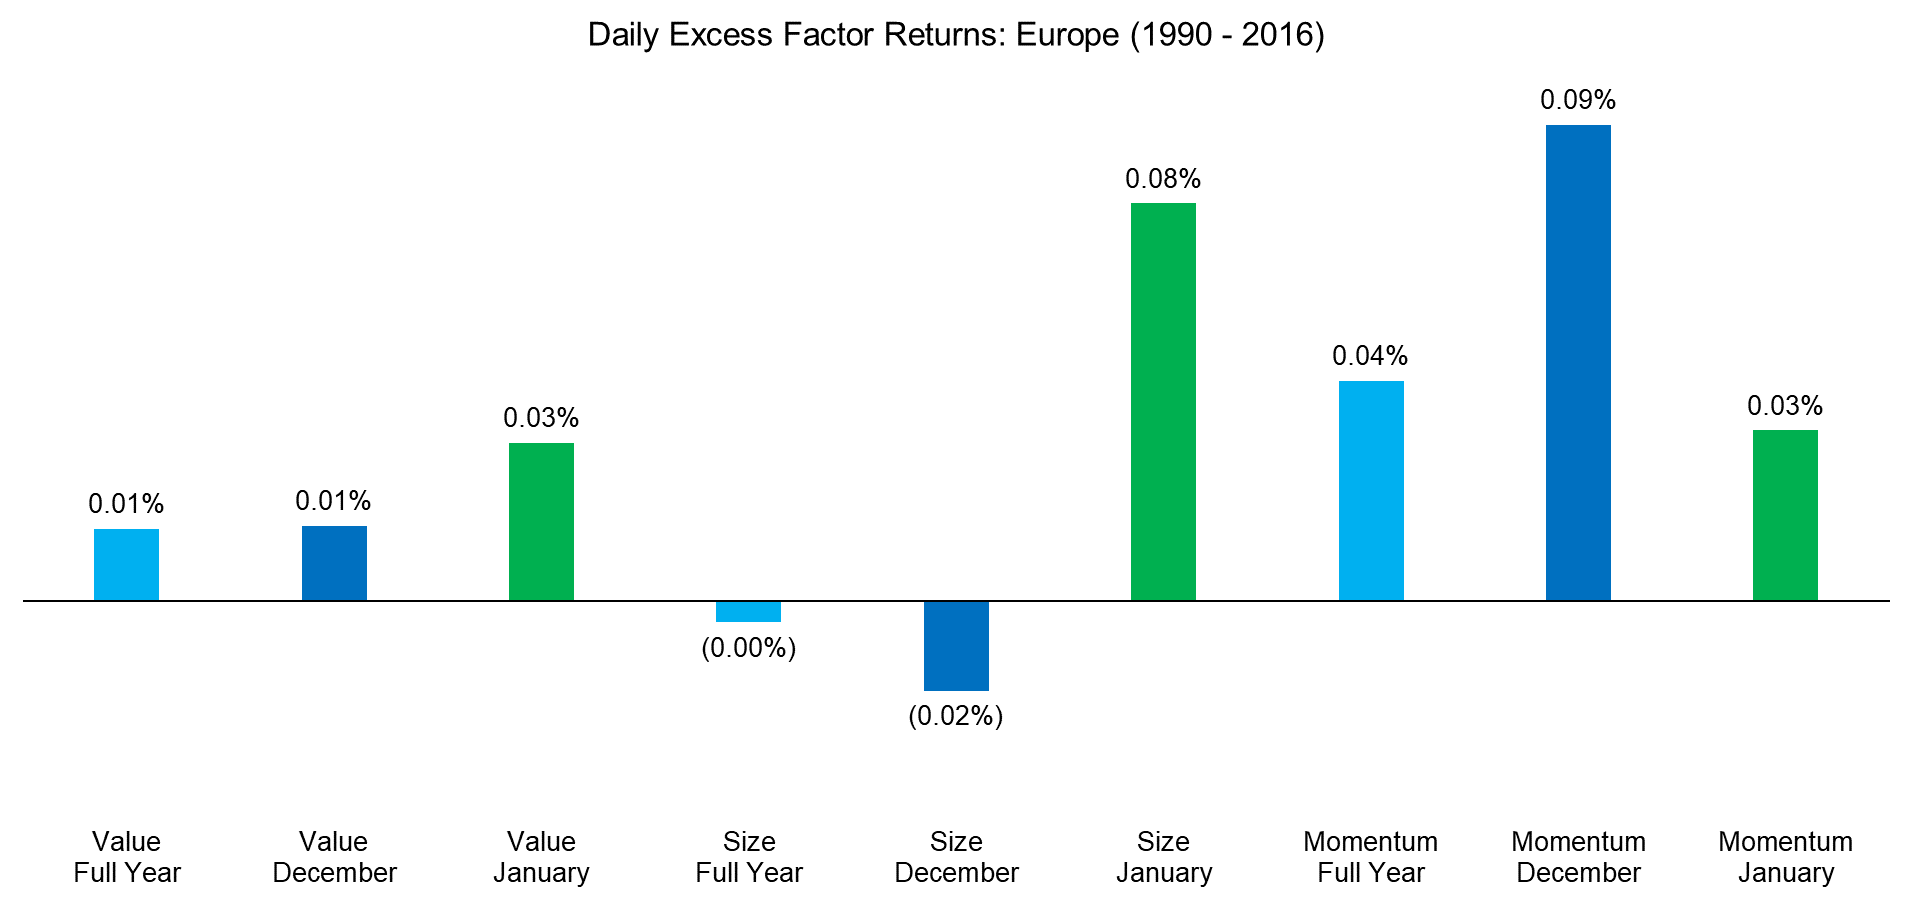
We can replicate the analysis in other markets, where data is available from 1990 onward. The chart below shows the excess returns for Europe, which also highlights strong returns for the Value and Size factors in January, but in contrast to the US, no negative returns for Momentum. The window dressing effect in Europe is likely as strong as in the US; however, tax-loss selling is likely different as the tax year-end does not coincide with the calendar year-end in every European country, e.g. in the UK investors end their tax year in April.
Source: Fama-French, FactorResearch
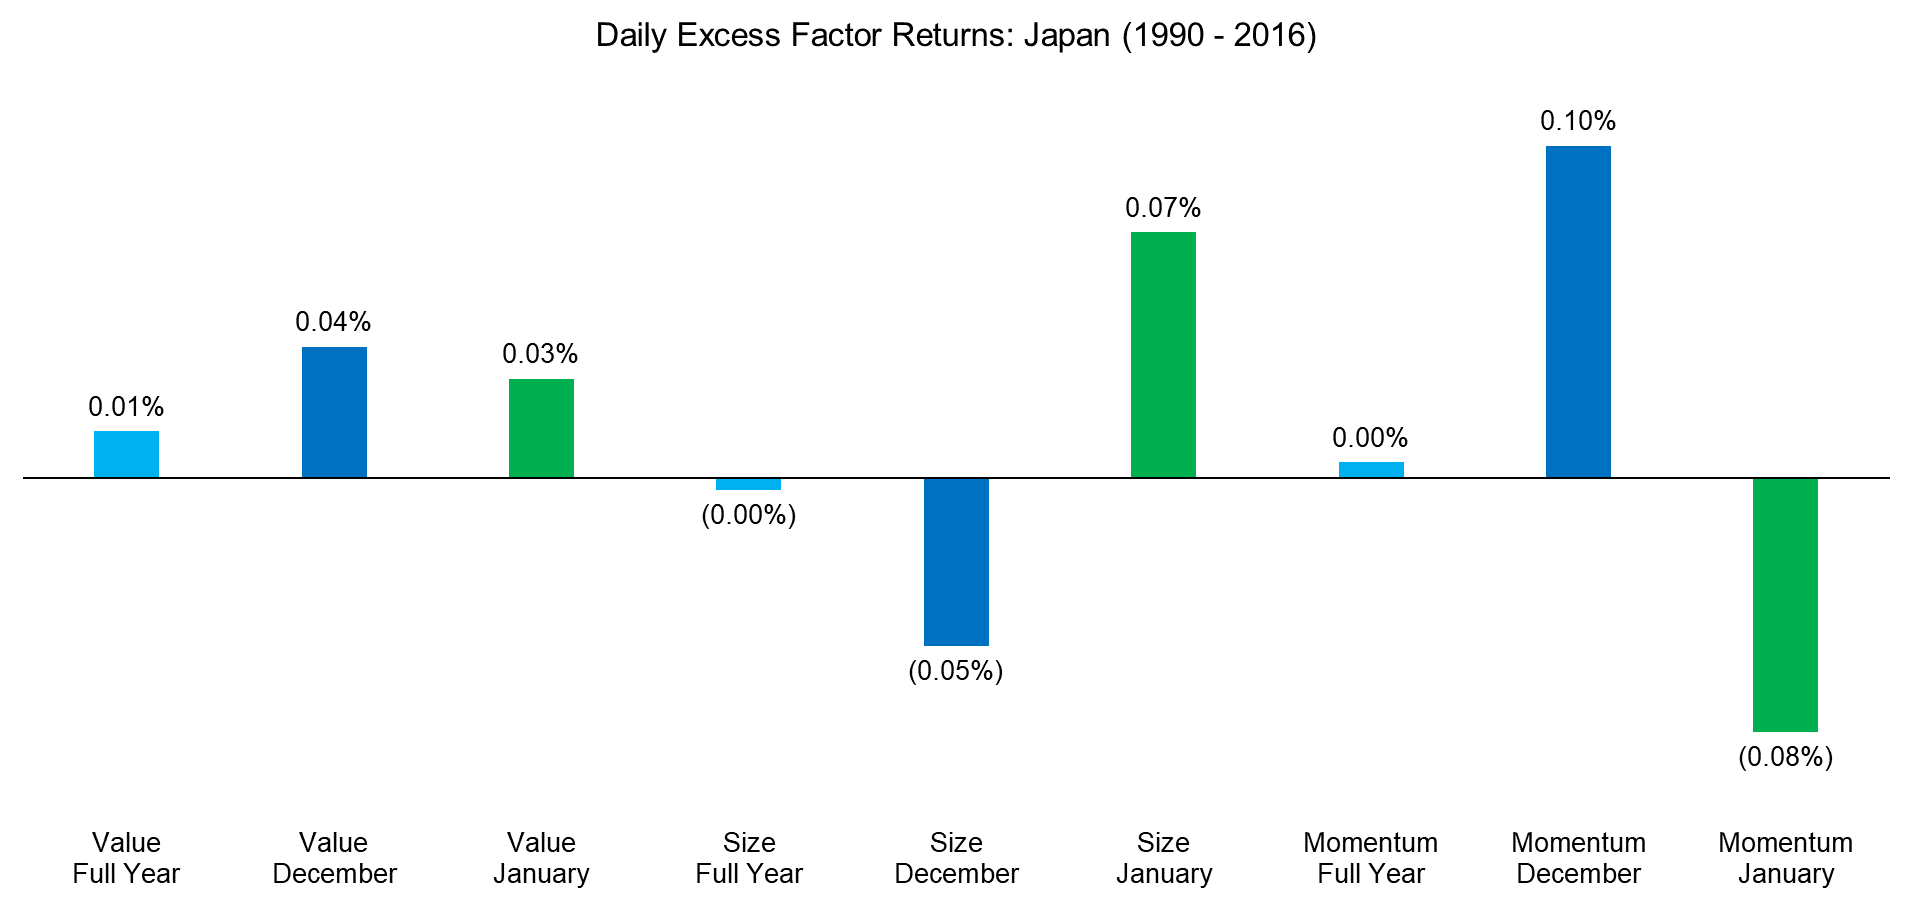
The calendar effects in Japan are similar to those of the US, i.e. Momentum gains in December and loses in January while Value and Size both gain in January. Japan is often considered an abnormality for most quantitative strategies as the returns for common strategies tend to be lower or non-existing compared to other countries, so it is interesting to observe the similarity and strength of the calendar effects.
Source: Fama-French, FactorResearch
PRACTICAL IMPLEMENTATION CHALLENGES
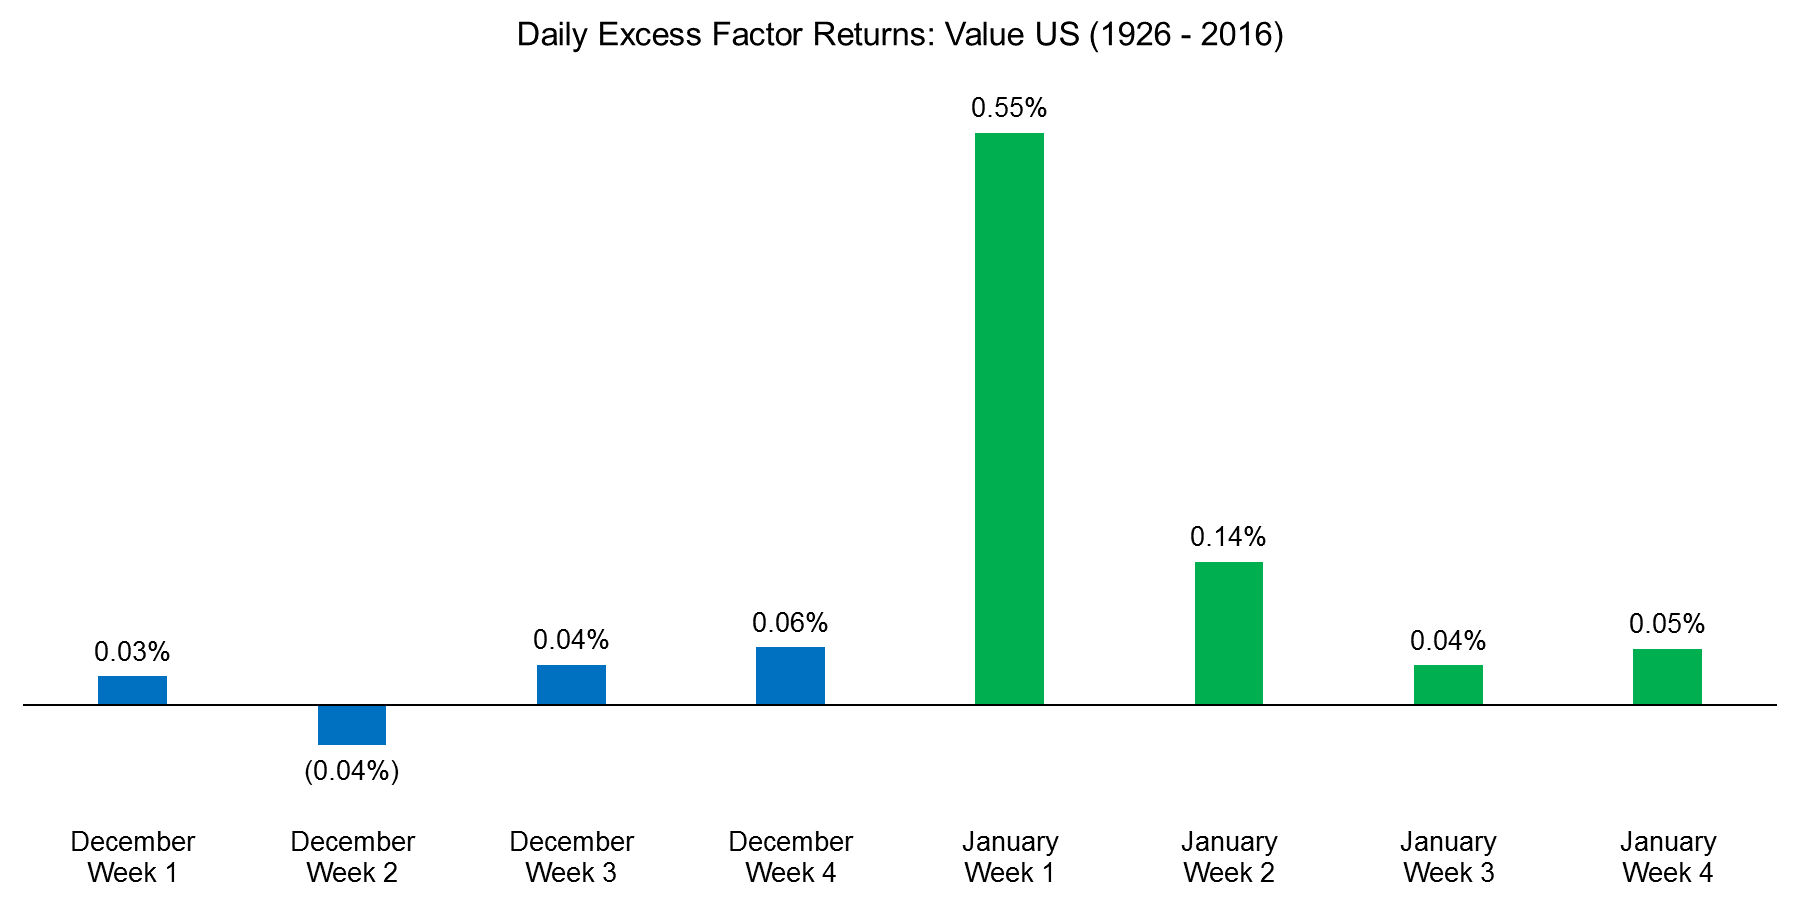
Given the results of the analysis, an investor might consider having exposure to Momentum in December and then switching to Value and Size in January. An even more extreme positioning would be to go long Momentum in December and short in January and implement the inverse positions for Value and Size, which would maximise the theoretical gains from the calendar effects. However, as the chart below shows, the abnormally high excess returns for the Value factor in the US in January are limited to the first week of the month. There is very limited liquidity in those days, which make crystallising these returns difficult, unless the portfolio was already created in December.
Source: Fama-French, FactorResearch
We can observe a larger practical implementation challenge for the Size factor in the US. December tends to be a negative month and most of the gains in January are limited to the first week. If an investor would want to avoid the negative returns of December, but capture the positive gains of January, it would imply that the investor would trade between Christmas and New Year’s Eve, where liquidity on stock markets is severely constrained.
Source: Fama-French, FactorResearch
Momentum shows almost the opposite return distribution of the Size factor. In order to capture the calendar effects, it would imply selling the Momentum portfolio after Christmas and before New Year’s, which would be challenging for institutional investors.
Source: Fama-French, FactorResearch
FURTHER THOUGHTS
This research note highlights year-end calendar effects for the Value, Size and Momentum factors. Although the excess returns are attractive, it is difficult realising the returns as it would imply trading between Christmas and New Year’s Eve, where liquidity on stock markets is exceptionally constrained. As in many other instances of empirical research in finance, it is challenging going from theory to practice.
ABOUT THE AUTHOR
Nicolas Rabener is the CEO & Founder of Finominal, which empowers professional investors with data, technology, and research insights to improve their investment outcomes. Previously he created Jackdaw Capital, an award-winning quantitative hedge fund. Before that Nicolas worked at GIC and Citigroup in London and New York. Nicolas holds a Master of Finance from HHL Leipzig Graduate School of Management, is a CAIA charter holder, and enjoys endurance sports (Ironman & 100km Ultramarathon).
Connect with me on LinkedIn or X.

