Factor Scoring Smart Beta ETFs
Measuring the Value-for-Money Proposition of ETFs
January 2020. Reading Time: 10 Minutes. Author: Nicolas Rabener.
SUMMARY
- The difference between the cheapest and most expensive smart beta ETF in the US is 59 bps on average
- Some smart beta ETFs offer negative factor exposure, which requires explanation
- Factor scores can be used to identify which smart beta ETFs offer the best ratio of factor exposure per dollar in fees
INTRODUCTION
Buying a Big Mac at McDonald’s in Basel, Switzerland, costs CHF6.50, compared with only CHF4.40 in Germany, which explains why the German McDonald’s locations close to the city are highly popular with Swiss nationals. Paying less for the same good is often worth the short drive across the border.
The same behaviour is observed in financial markets where investors typically choose the cheapest version when analyzing commodity-like products like indices. Somewhat unusual, investors have allocated $290 billion to the SPDR S&P 500 ETF Trust (SPY), which costs 5 basis points (bps) more than iShares Core S&P 500 ETF (IVV) and 6 bps more than the Vanguard S&P 500 ETF (VOO). Perhaps this is explained by SPY representing an extremely well-known ticker, which allows State Street, its issuer, to charge a premium that equates to approximately $100 million of fees per annum.
Further reasons might be that investors pay higher fees for better liquidity or simply consider the relatively minor fee differences marginal. However, although the price war in the ETF industry has reduced management fees significantly for many benchmark indices, there are still substantial differences in areas like smart beta.
We recently introduced the framework of factor scores, which measures the relationship between the factor exposure and expense ratio of a smart beta ETF. Our research note highlighted that Value-focused smart beta ETFs show a range of factor scores, some effectively representing better value-for-money propositions than others.
In this short research note, we will analyse the factor scores of the most popular smart beta strategies in the US.
SMART BETA ETFS IN THE US
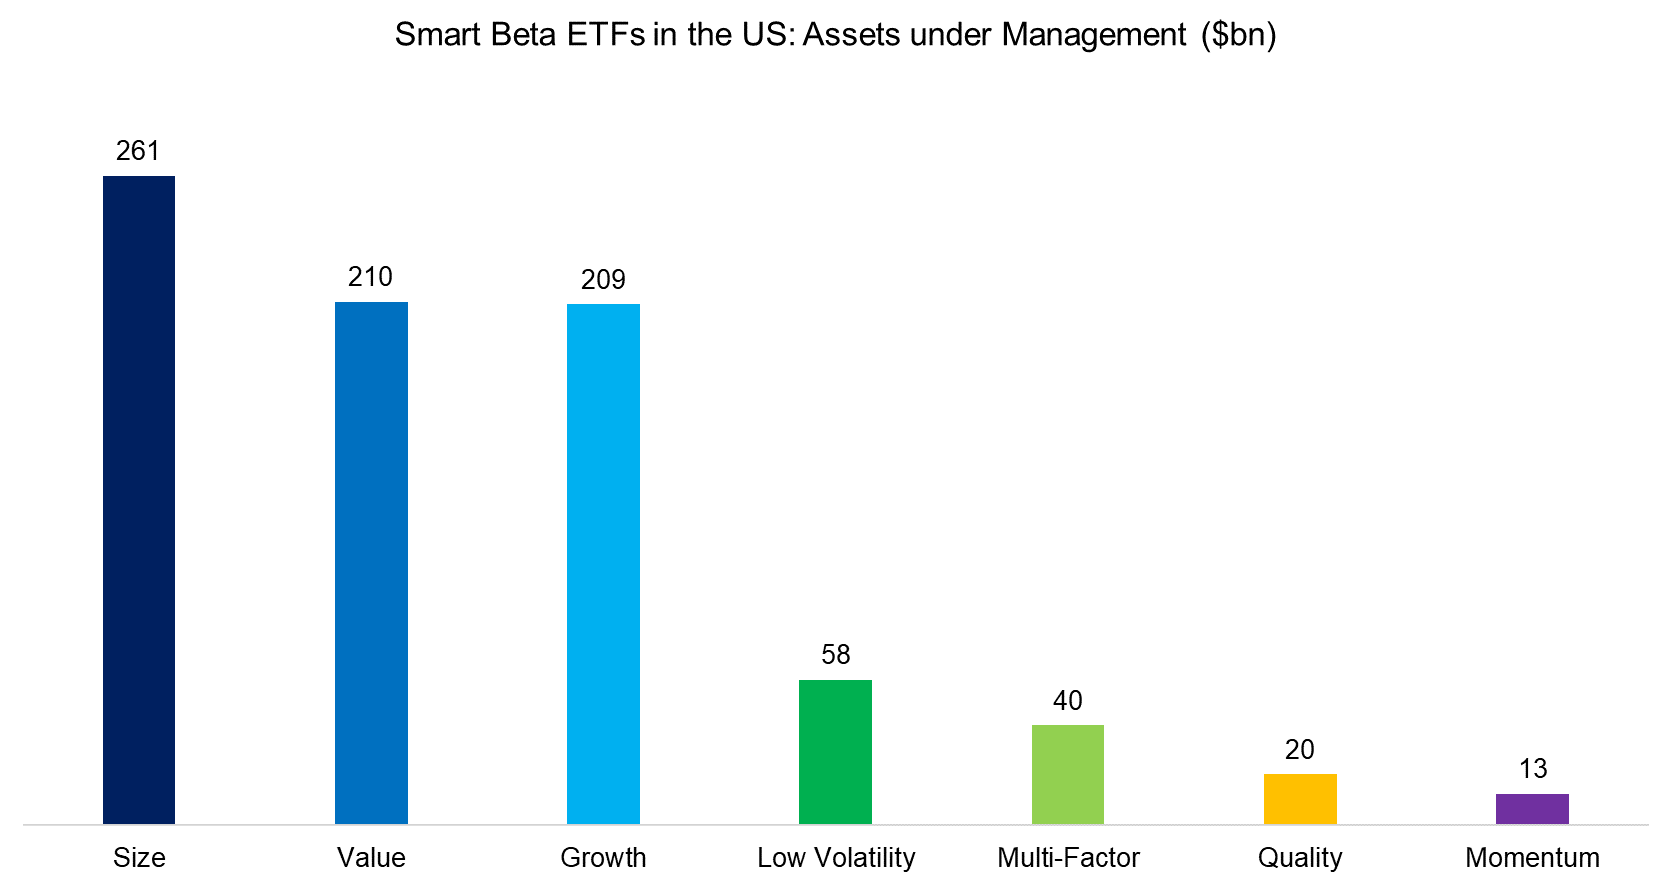
We create our universe of smart beta ETFs in the US by selecting products that clearly include the factor in their name. Multi-factor products are required to provide exposure to at least three factors. The resulting universe has a market capitalization of more than $800 billion, which represents approximately 25% of all equity ETFs in the US (read Multi-Factor Smart Beta ETFs).
It is interesting to note that there is a significant discrepancy between which factors are supported by research versus which investors favour in terms of allocations. Specifically, academic and practitioner research favours Value, Momentum, and Low Volatility, while Size has become less relevant and there is hardly any research that shows positive excess returns from the Growth factor. However, Size and Growth represent two of the three most popular smart beta strategies in the US while Momentum has received hardly any capital, which is challenging to explain.
Source: ETF.com, FactorResearch
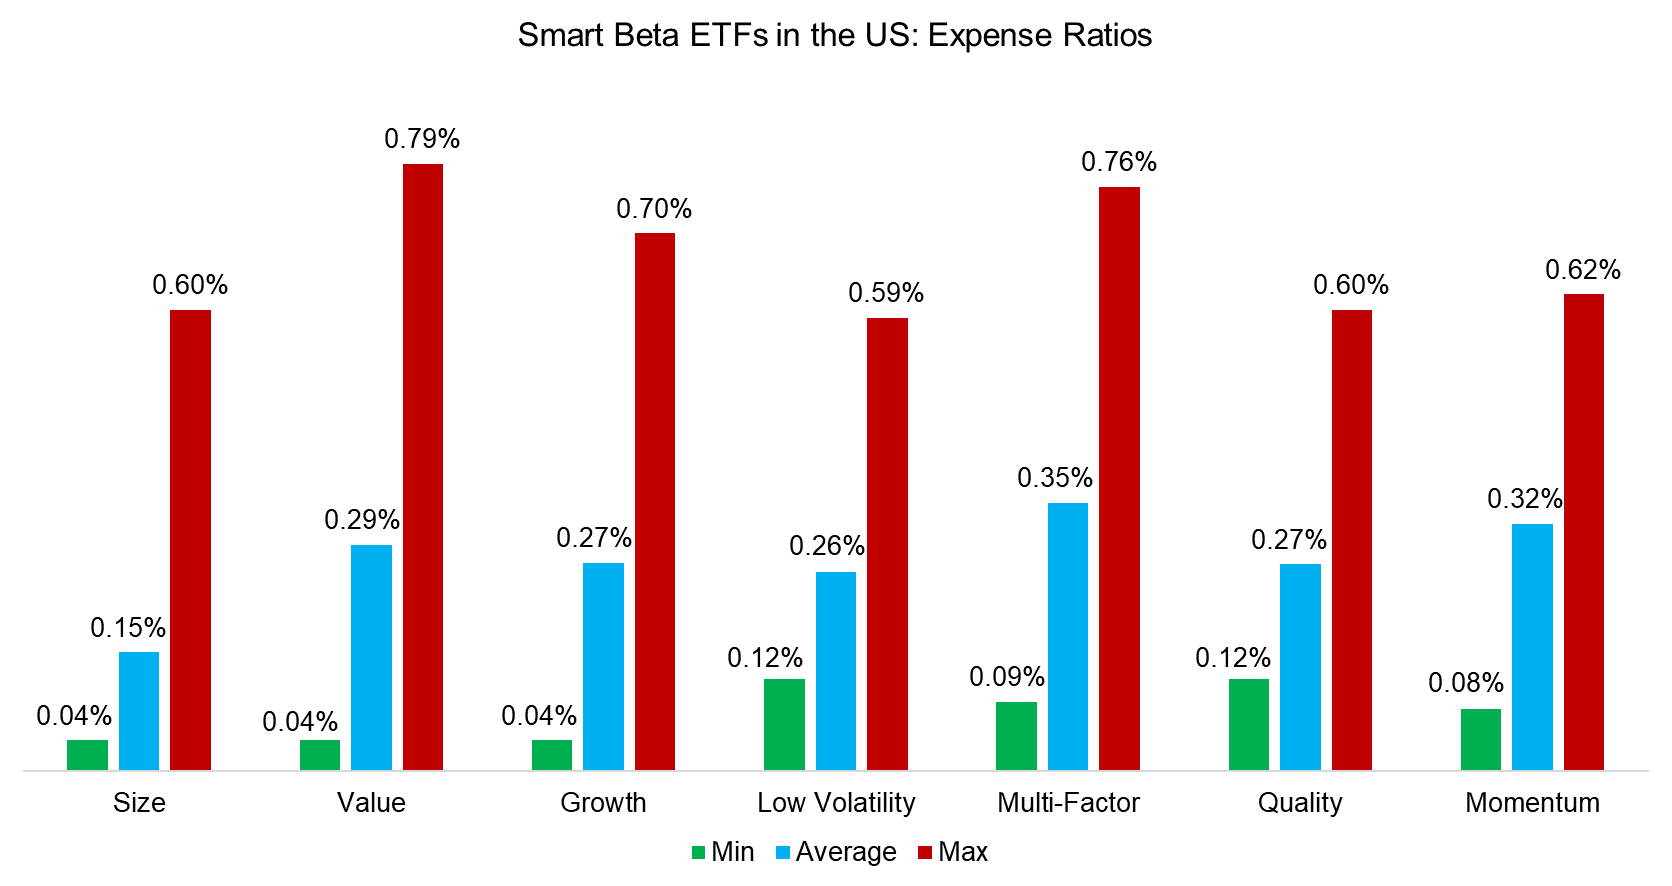
Comparing the expense ratios of popular smart beta strategies in the US highlights similar pricing characteristics. Specifically, the cheapest smart beta ETF in each category tends to charge 12 bps or less, the average fee is approximately 30 bps, and the most expensive one is between 60 and 70 bps. The difference between the cheapest and most expensive ETFs is significant for investors, considering the power of compounding over time.
Source: FactorResearch
FACTOR BETAS OF SMART BETA ETFS
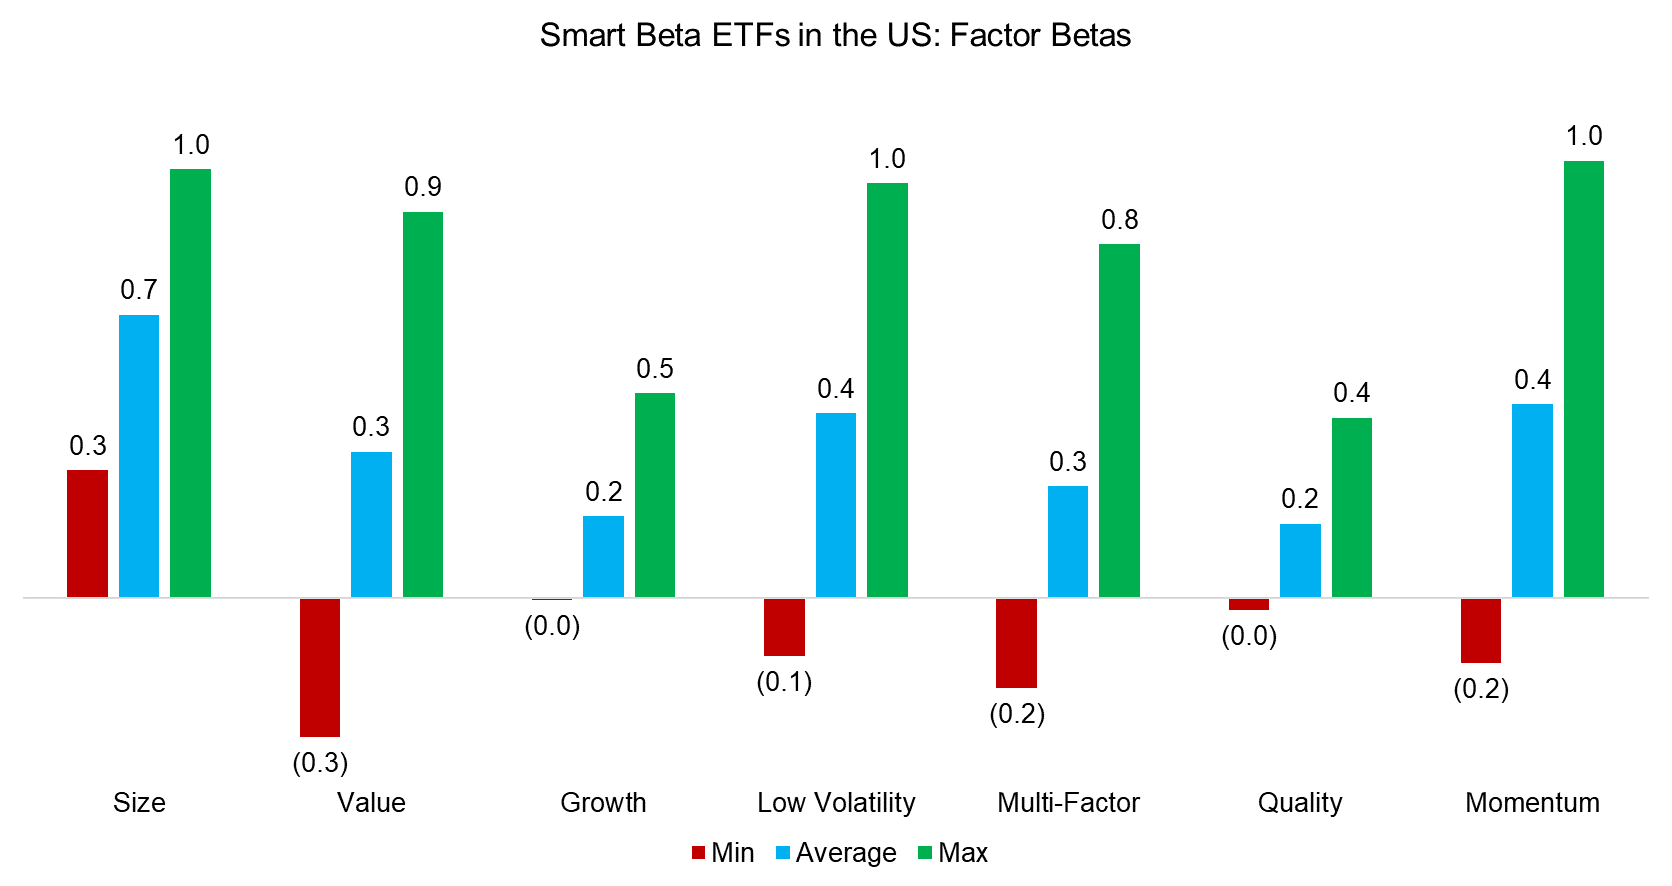
The popularity of smart beta ETFs is based on the factor investing literature, which highlights that certain strategies allow to outperform the market over time. Given this, investors should have a preference for products that offer high factor exposure (read ETFs, Smart Beta & Factor Exposure).
We calculate the factor betas via a regression analysis using daily data and factor definitions that are in line with academic and industry standards. We observe a wide range of betas and some products feature negative betas. Some ETF providers will use differentiated factor definitions that might lead to low betas, but negative betas tend to indicate products that are mislabeled as they provide exposure to different factors.
Source: FactorResearch
FACTOR SCORES
Although investors should seek smart beta ETFs that provide high factor exposures, these should be analysed in relation to their costs. A cheap smart beta ETF with low factor exposure might be less attractive than an expensive one with high factor exposure.
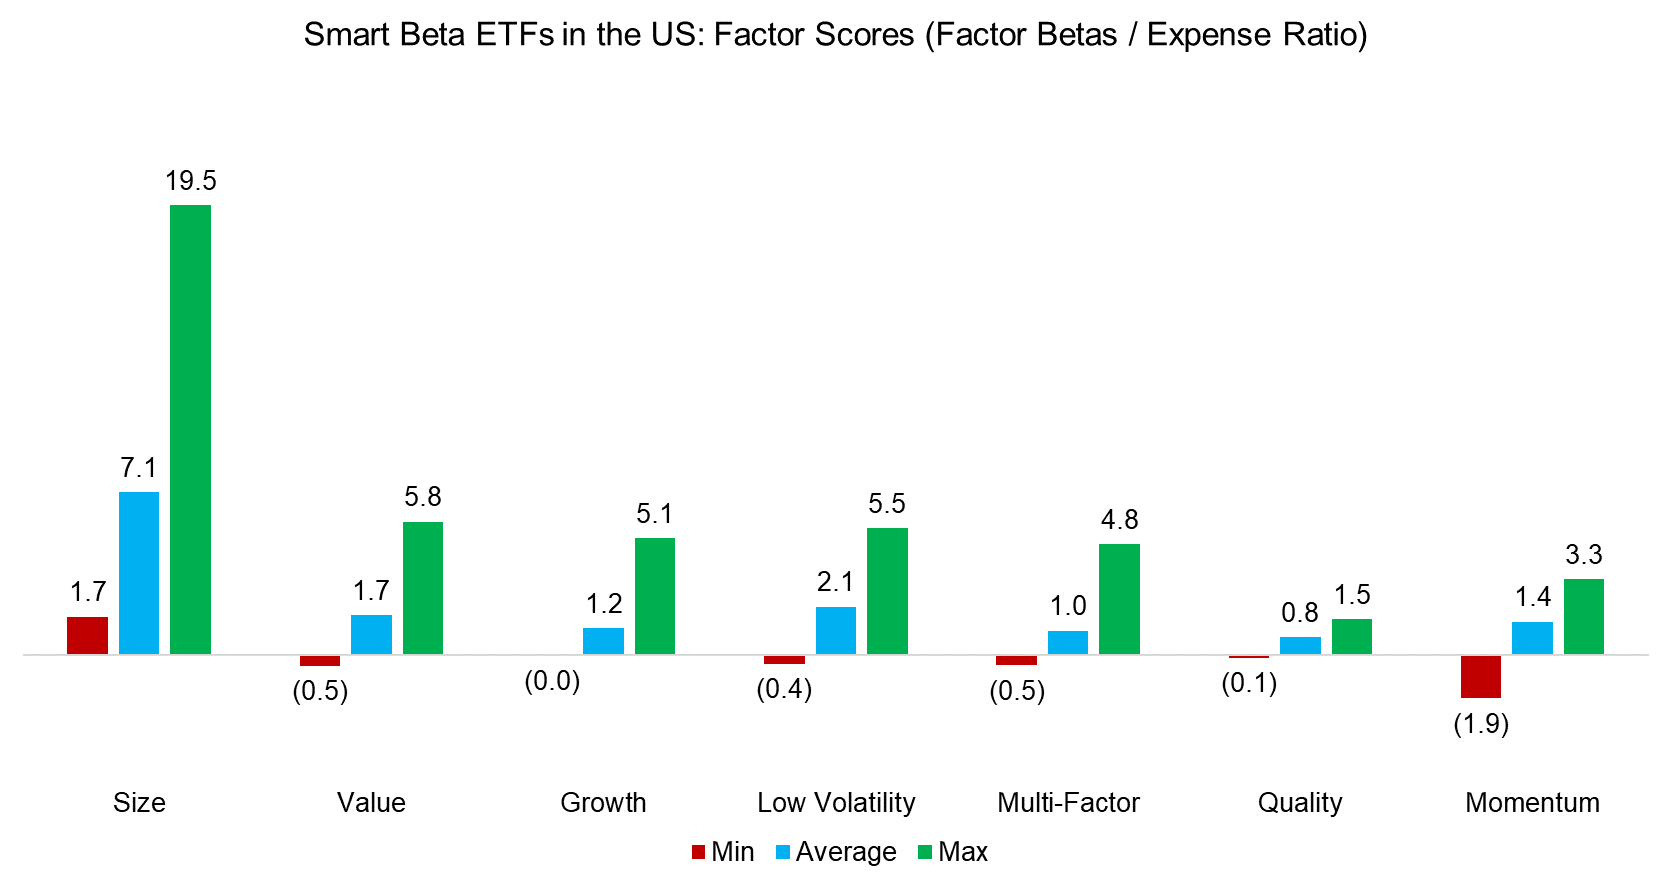
We calculate factor scores, which we define as the factor beta divided by the expense ratio, and observe a wide range across the smart beta strategies. The factor scores are not informative on an absolute basis, but useful on a relative basis. The higher the factor exposure, the better the value-for-money proposition of the ETF.
Standard ETF due diligence focuses on the assets under management, the track record of the issuer, index construction, liquidity, trading costs, among other criteria. Factor scores identify which smart beta ETFs are offering low factor exposure per dollar in management fees, which might be explained by a differentiated factor definition or excessive fees.
Source: FactorResearch
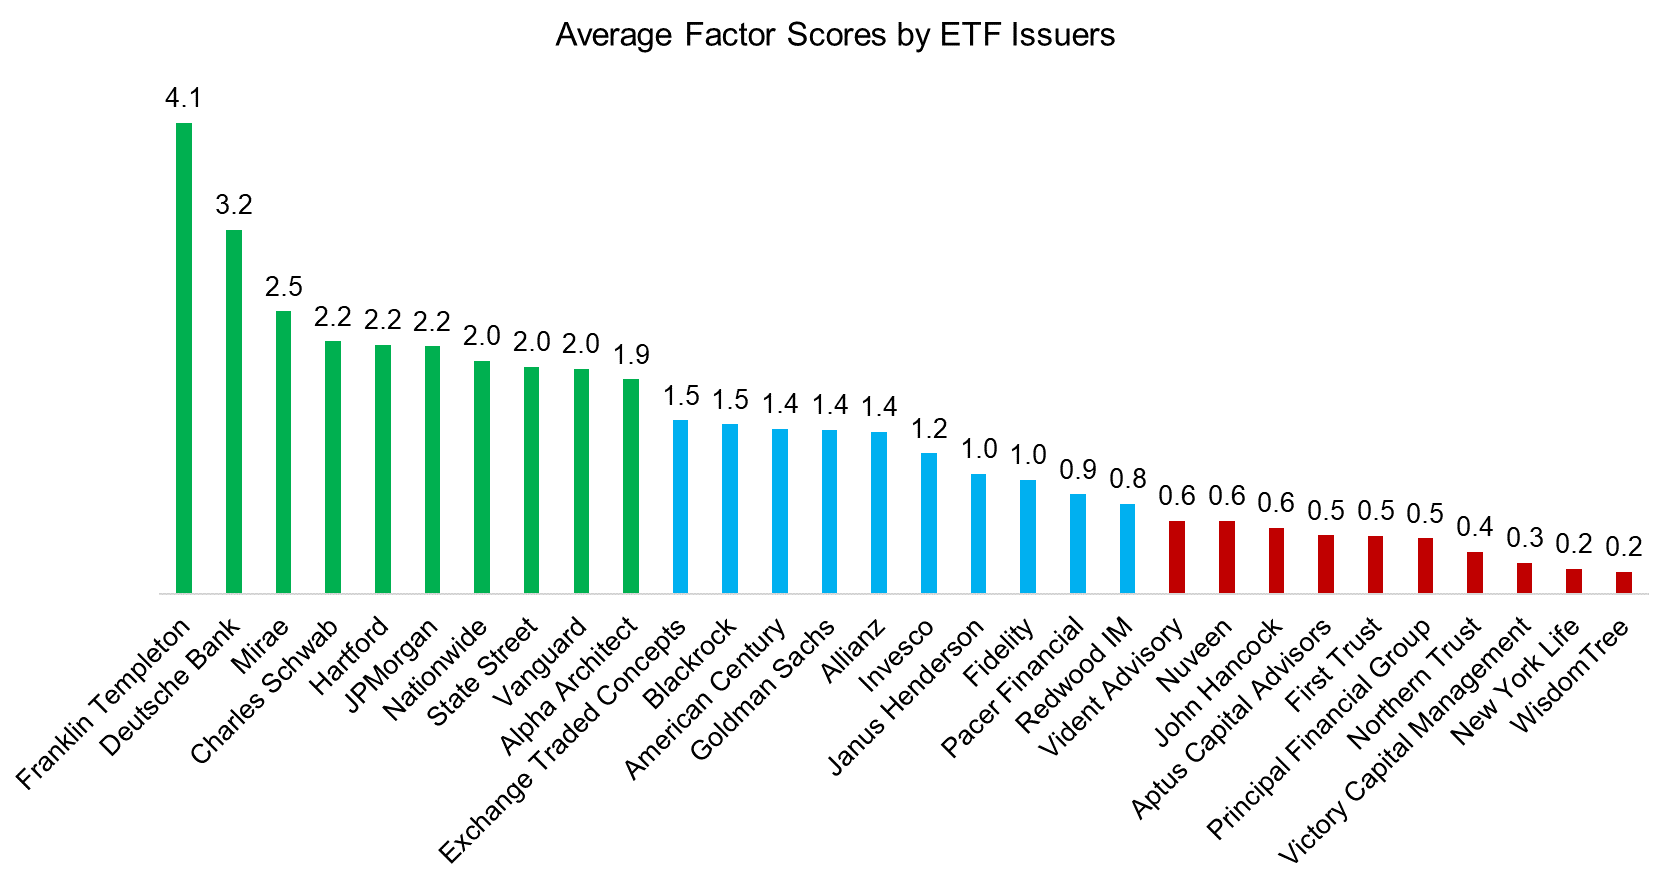
FACTOR SCORES BY ETF ISSUER
Finally, we compare the factor scores and betas aggregated by ETF issuers. It is difficult to conclude anything from this analysis as high factor scores are offered by large asset managers like Franklin Templeton, but also smaller ones like Alpha Architect. Similarly, large and small asset managers can be found among the firms that offer smart beta ETFs with low factor scores.
Source: FactorResearch
FURTHER THOUGHTS
Some countries in Europe introduced the “comply, or explain” regulatory approach for corporate governance and financial supervision. If a company does not fulfil the regulatory standards, they need to publicly explain why not.
Factor scores can be used investors in a similar fashion when conducting due diligence on smart beta ETFs. Product providers can be asked to comply, which effectively means reducing fees, or explain why the higher fees are justified.
ABOUT THE AUTHOR
Nicolas Rabener is the CEO & Founder of Finominal, which empowers professional investors with data, technology, and research insights to improve their investment outcomes. Previously he created Jackdaw Capital, an award-winning quantitative hedge fund. Before that Nicolas worked at GIC and Citigroup in London and New York. Nicolas holds a Master of Finance from HHL Leipzig Graduate School of Management, is a CAIA charter holder, and enjoys endurance sports (Ironman & 100km Ultramarathon).
Connect with me on LinkedIn or X.

