Factors & Volatility-Based Risk Management
Different Factor, Different Risk Management?
July 2017. Reading Time: 10 Minutes. Author: Nicolas Rabener.
SUMMARY
- A common approach to factor allocation is to scale exposure by factor volatility
- This approach improves the risk-return ratios of Momentum, but lowers them for Value and Size
- Factors have different underlying drivers, which require different risk management systems
INTRODUCTION
Factors, like equity markets, can have significant multi-year drawdowns. Investors therefore have been researching how to mitigate the drawdowns given substantial career risks. One common approach is to scale the exposure to a factor by its volatility. Although this might be a useful concept from a portfolio perspective (aka risk parity), we believe this approach does not work well for factor allocations as it does not improve the Sharpe ratios of factors on average. The relationship between return and volatility is not linear, which might be explained by factors having different drivers. In this short research note we will analyse factor volatility as a risk management tool for factor allocations (read Market Timing vs Risk Management).
METHODOLOGY
We will use Fama-French data for this analysis as it offers the longest data history. We will focus on the Value, Size, and Momentum factors and use the top and bottom 10% of the US stock universe, where data is available since 1926. Factor volatility is calculated over a 3-month period and the history is expanding over time in order to avoid any look-ahead bias. The risk management model is constructed as simple as possible: if factor volatility is in the top quartile, then go into cash, otherwise stay fully invested.
VALUE FACTOR (LONG / SHORT): PURE VS VOLATILITY-ADJUSTED
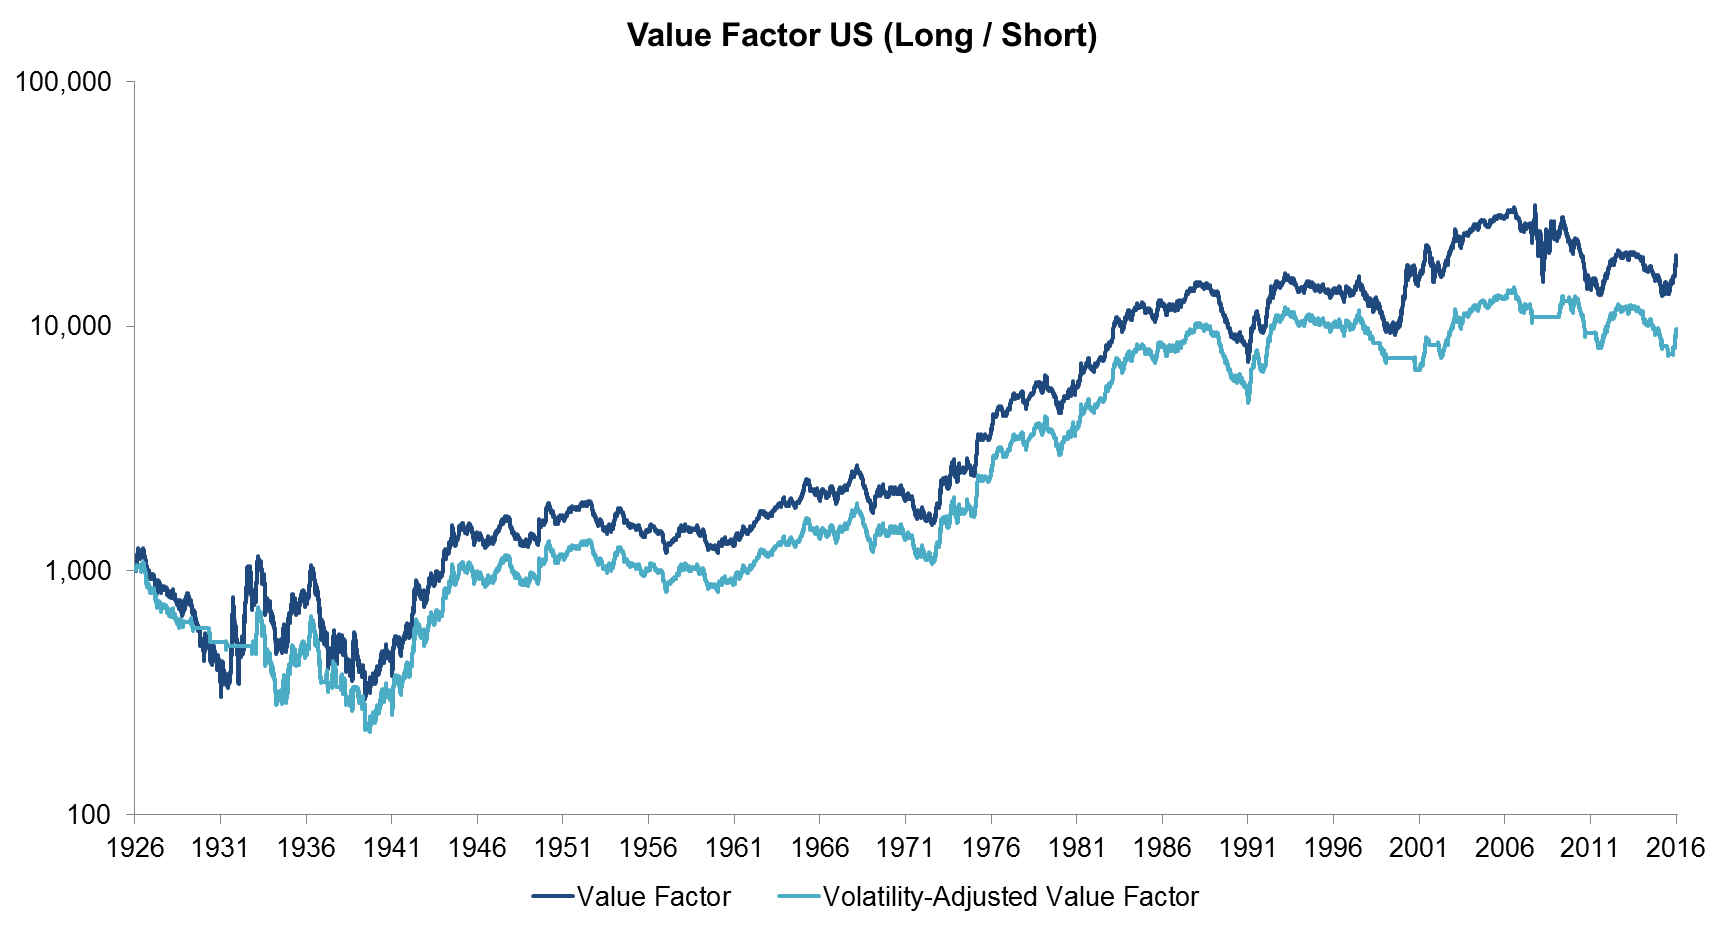
The chart below shows the performance of the Value factor in the US from 1926 to 2016, once pure and once volatility-adjusted. The flat lines of the volatility-adjusted factor represent periods where the factor volatility was high and the allocation was reduced to zero. The analysis shows that the risk management system led to a lower performance over the entire period. It’s worth highlighting that the volatility-adjusted factor is only invested 80% of the time and could earn interest on the cash, which slightly understates the performance.
Source: Fama-French, FactorResearch
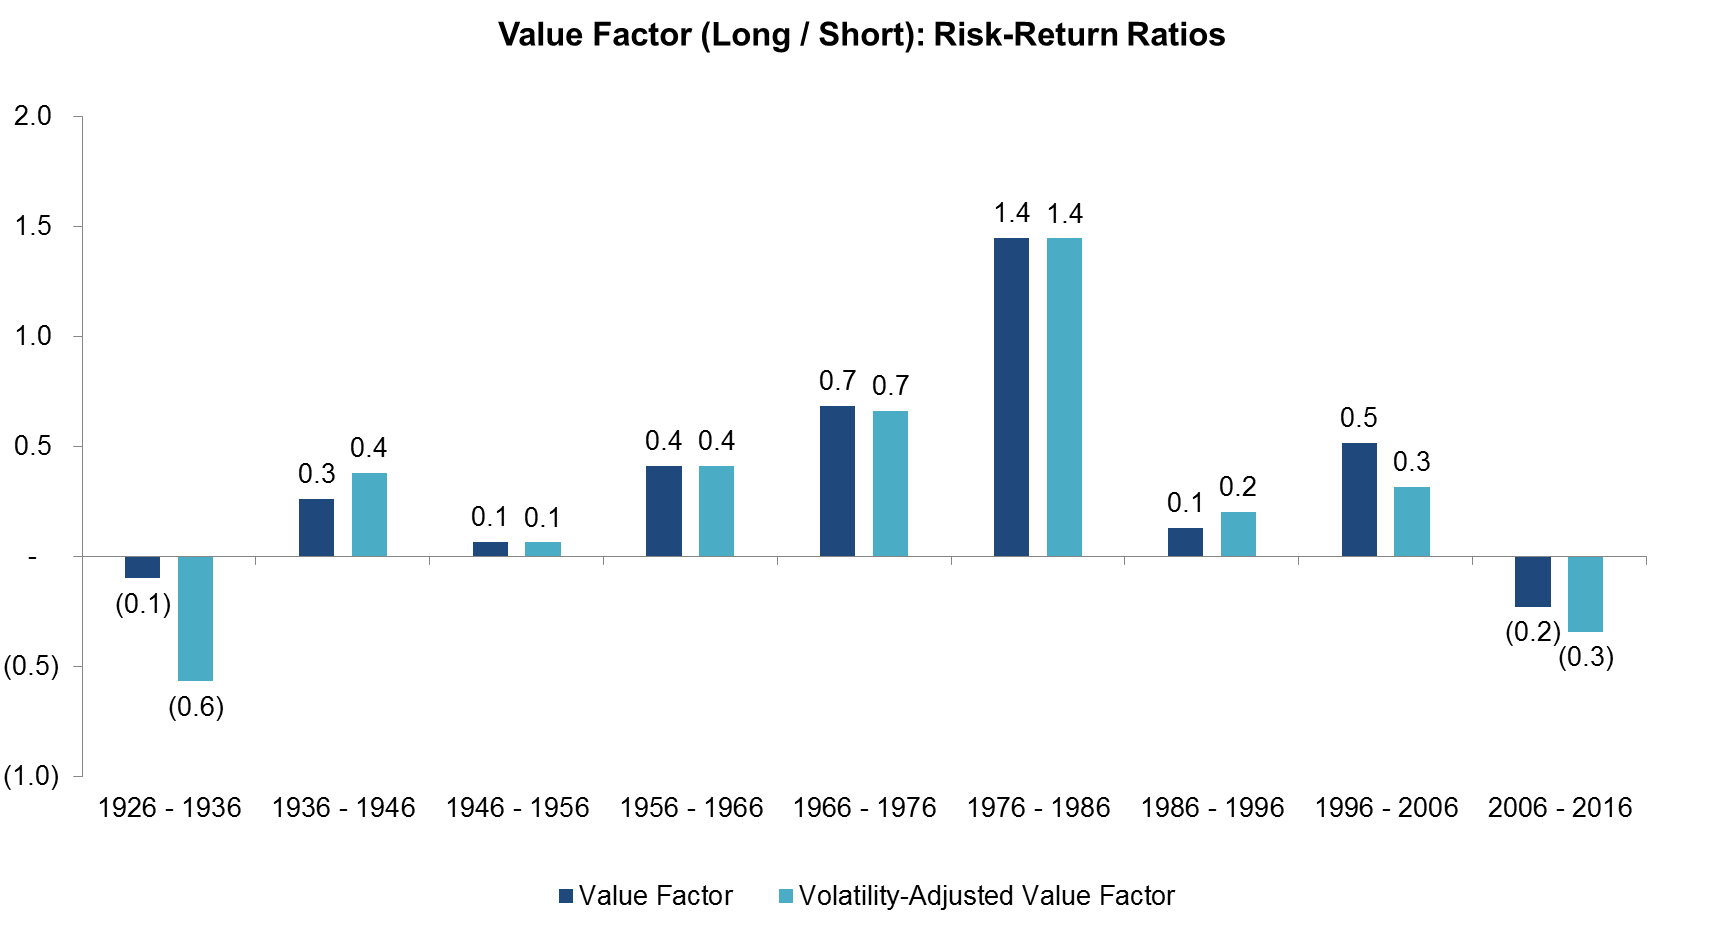
While it’s interesting to compare the performance of the pure vs volatility-adjusted Value factor, the objective of the risk management system is usually to improve the risk-return ratio, not necessarily the return. The chart below shows the risk-return ratios for each decade since 1926 and we can observe that avoiding periods of high factor volatility did not improve the ratios. We believe this is due to the intrinsic drivers of the Value factor, where higher volatility should not be regarded as undesirable or negative per se.
Source: Fama-French, FactorResearch
SIZE FACTOR (LONG / SHORT): PURE VS VOLATILITY-ADJUSTED
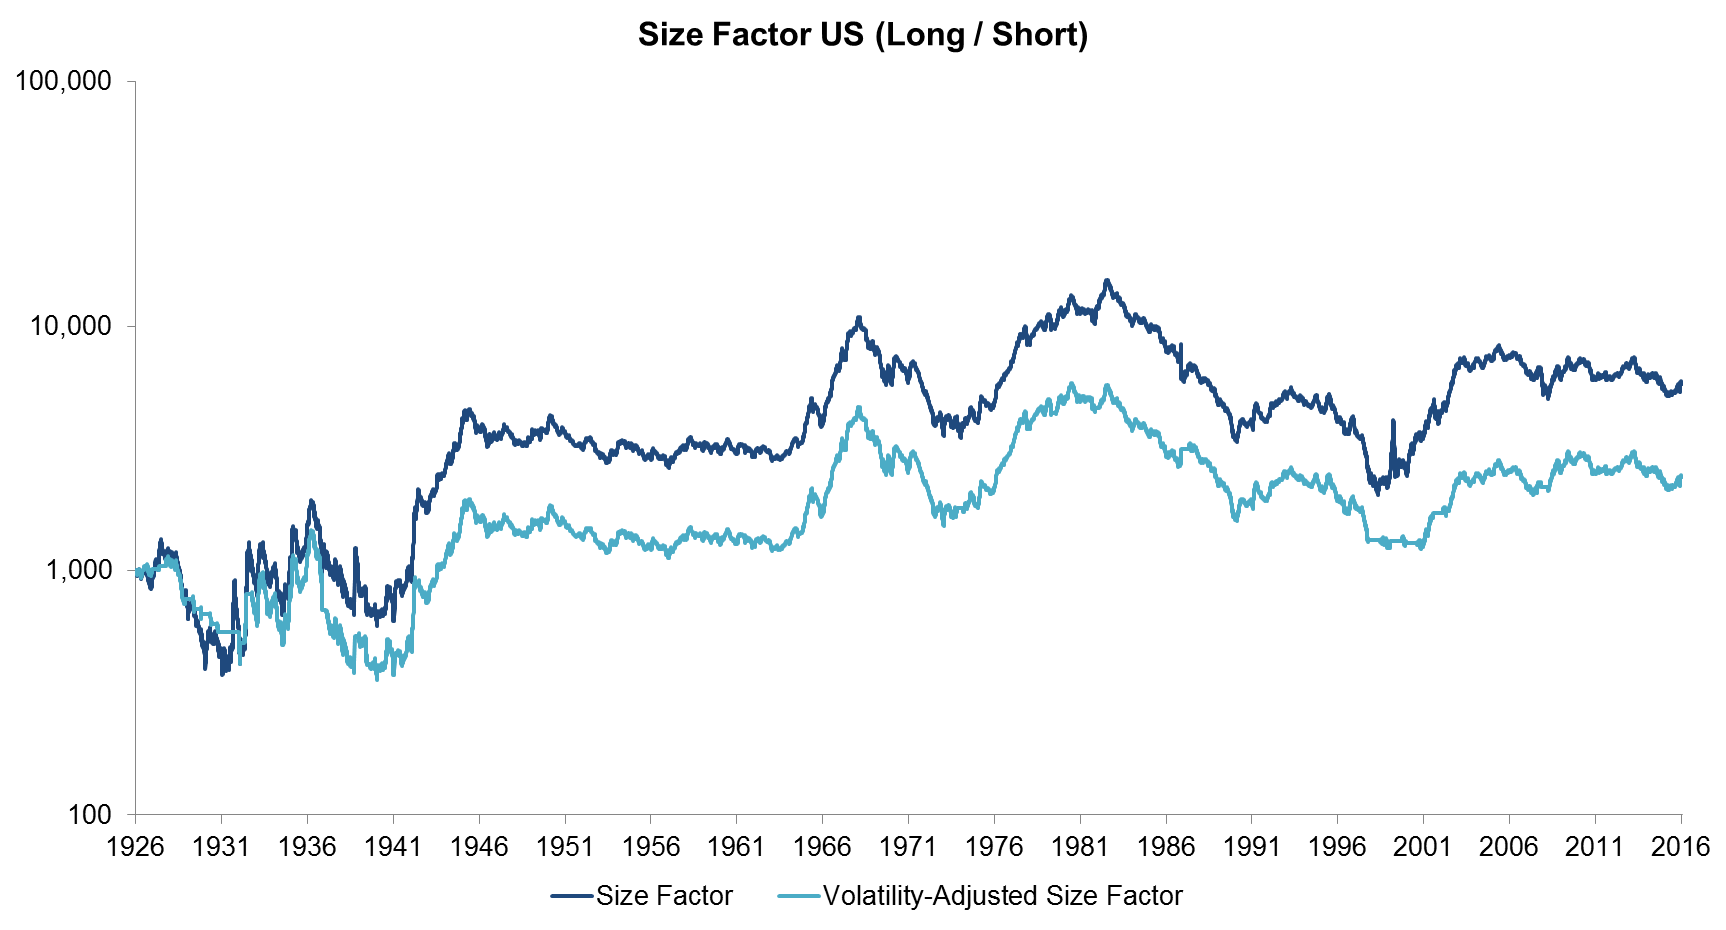
The next chart shows that the pure Size factor outperformed the volatility-adjusted Size factor, similar to the results of the Value factor. It’s interesting to note that the factor volatility was extremely high in the early years of the analysis, which includes the Great Depression, and therefore the volatility threshold for exiting the factor is set to a relatively high level. The volatility-adjusted factor is invested 81% of the time.
Source: Fama-French, FactorResearch
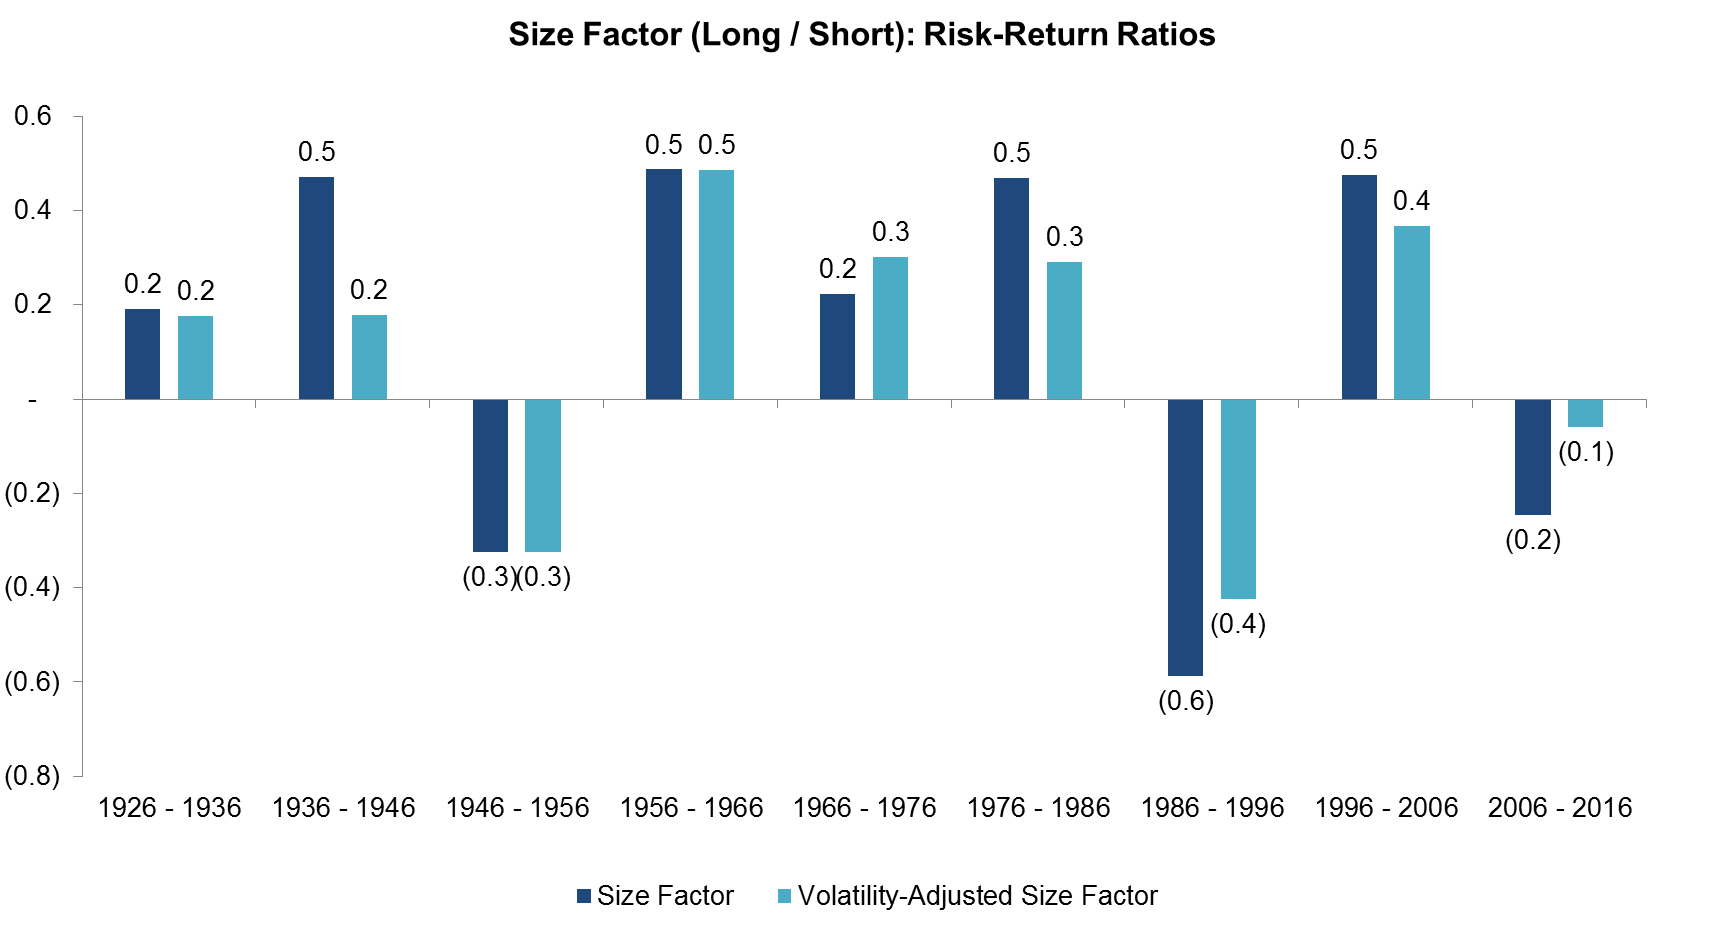
The results below show that the risk-return ratios of the Size factor are not as consistently positive as for the Value factor. They also highlight that the ratios are lower for the volatility-adjusted Size factor than for the pure factor.
Source: Fama-French, FactorResearch
MOMENTUM FACTOR (LONG / SHORT): PURE VS VOLATILITY-ADJUSTED
The next chart shows that the volatility-adjusted Momentum factor outperformed the pure factor throughout most of the observation period, so the volatility risk management system works well for this factor. We believe Momentum has different drivers, which are mainly behavioural biases, than Value or Size. Momentum is unique that it has rare, but severe crashes, where the factor experiences drawdowns of >70% in a few months. These drawdowns occurred in 1932 and 2009, when equity markets recovered from the Great Depression and the Global Financial Crisis respectively. The volatility-adjusted factor managed to avoid these crashes (read Momentum Factor: Intra vs Cross-Sector) .
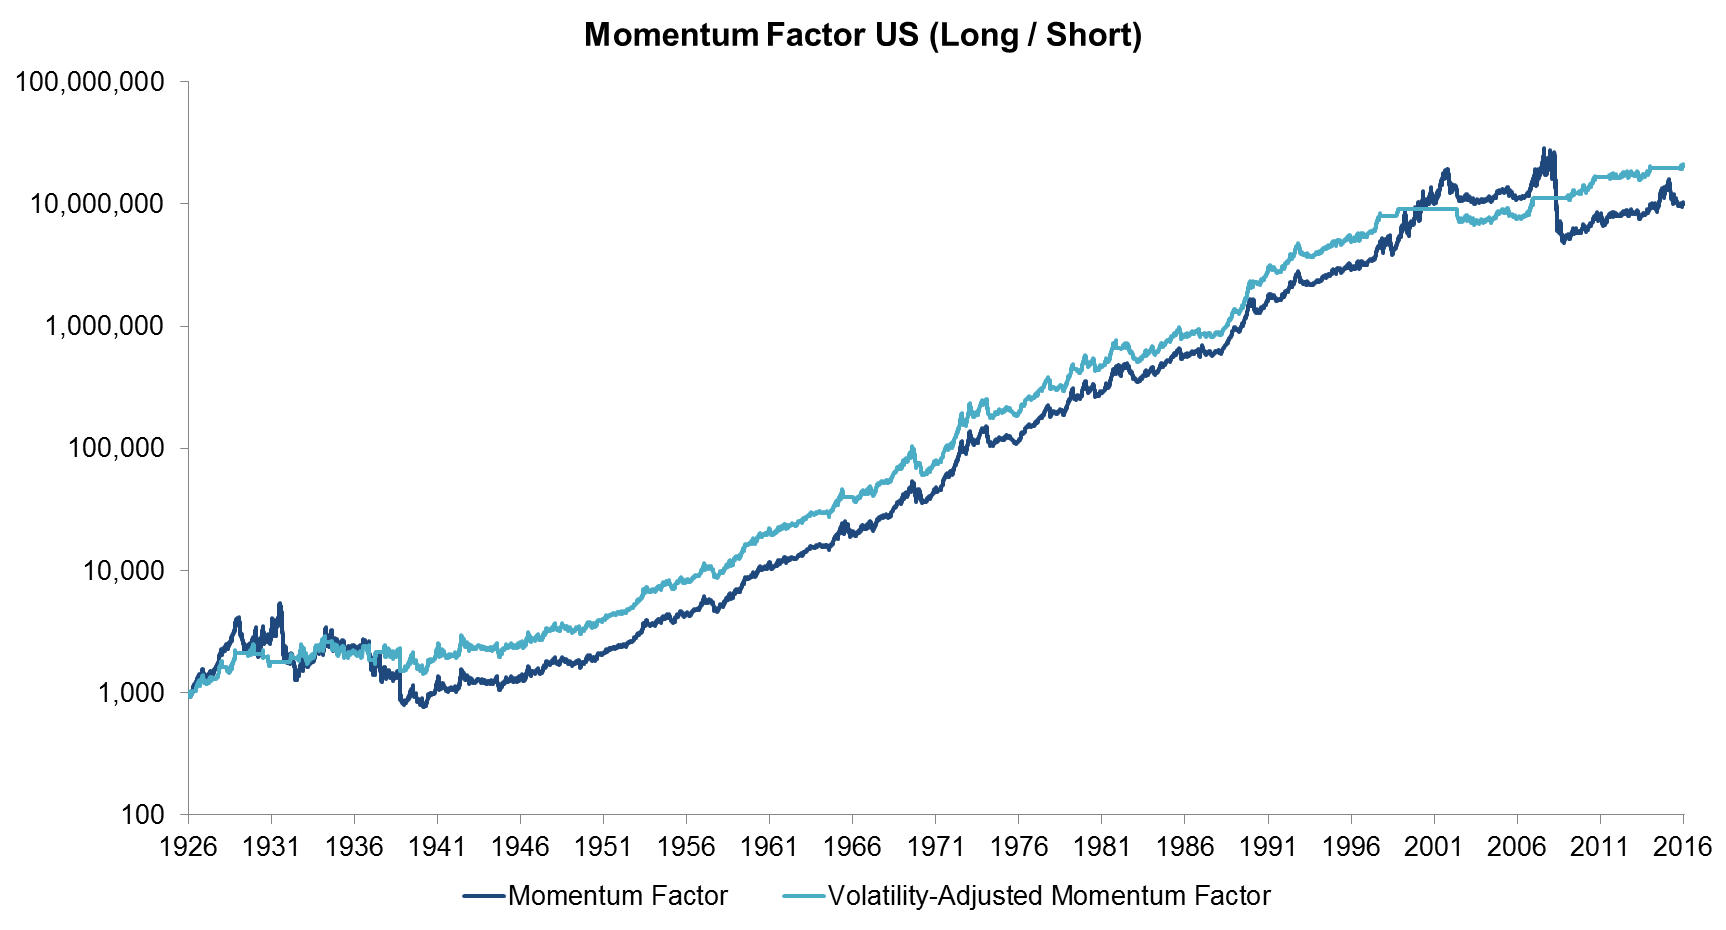
Source: Fama-French, FactorResearch
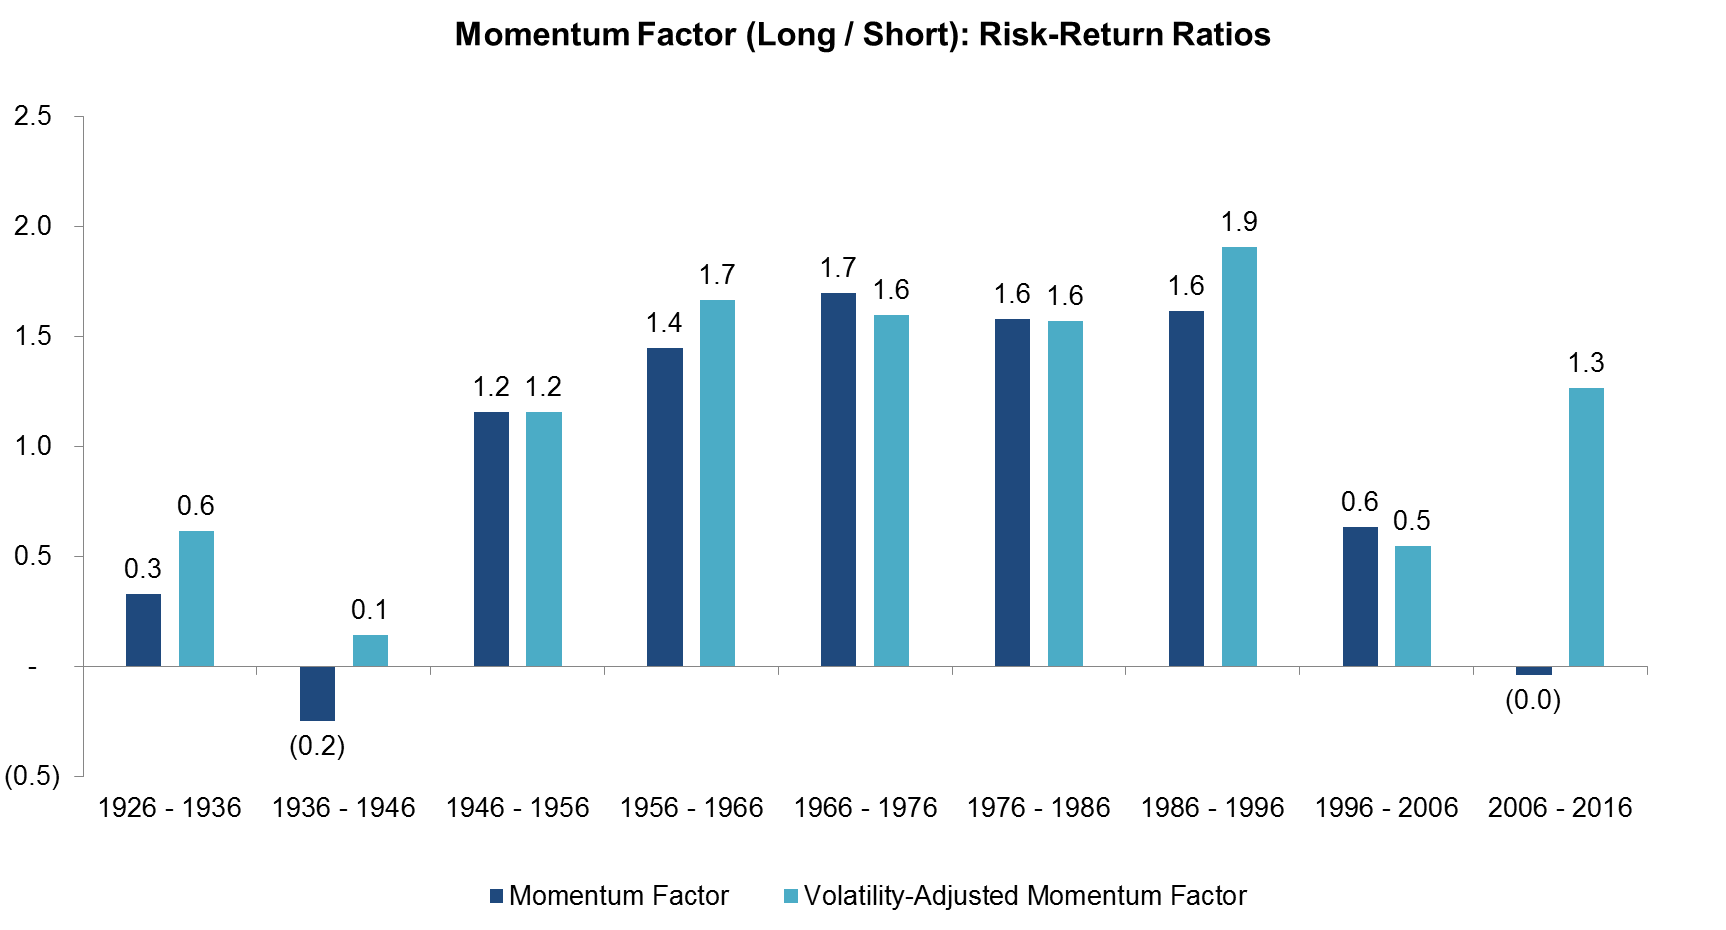
The analysis below shows that the risk-return ratios are higher for the volatility-adjusted factor most of the time, especially in the decades that include the Momentum crashes (1926 – 1936 & 2006 – 2016).
Source: Fama-French, FactorResearch
INTERNATIONAL FACTORS & VOLATILITY-BASED RISK MANAGEMENT
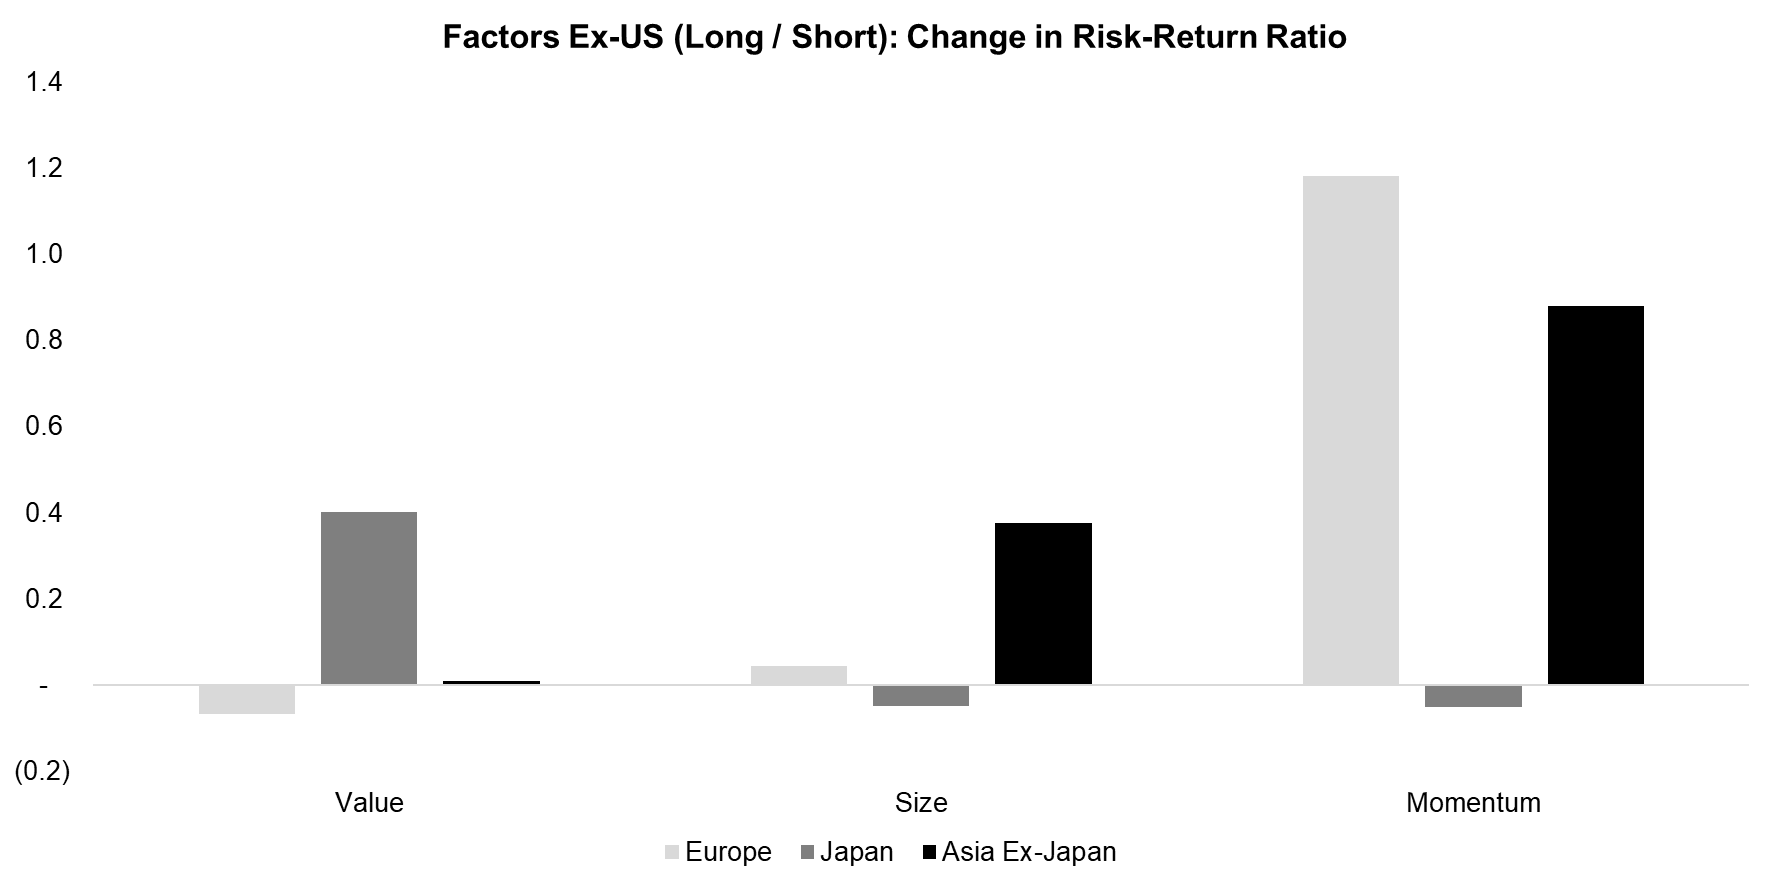
We can expand our analysis to other countries, where Fama-French data is available since 1990. The graphic below shows the change in the risk-return ratios of the Value, Size, and Momentum factors in Europe, Japan, and Asia ex-Japan with volatility-based risk management. We can observe results that are slightly better than the outcome for the US over the 90-year period. However, similar to the US, only Momentum shows a clear improvement and in general there is no consistency across countries.
Source: Fama-French, FactorResearch
FURTHER THOUGHTS
This short research note shows that the volatility-based risk management did improve the risk-return ratios for the Momentum factor, but not for Value or Size. The analysis can be challenged for the volatility threshold we defined, but running different thresholds does not change the results significantly. We believe factors have different drivers, which do require different risk management systems. These don’t need to be optimised for each factor, just aligned with the underlying factor drivers.
Naturally we should highlight that these observations focus on factors on a stand-alone basis from an investment perspective. Volatility-based risk management might well be beneficial from a portfolio management perspective, which is a topic for another research note.
ABOUT THE AUTHOR
Nicolas Rabener is the CEO & Founder of Finominal, which empowers professional investors with data, technology, and research insights to improve their investment outcomes. Previously he created Jackdaw Capital, an award-winning quantitative hedge fund. Before that Nicolas worked at GIC and Citigroup in London and New York. Nicolas holds a Master of Finance from HHL Leipzig Graduate School of Management, is a CAIA charter holder, and enjoys endurance sports (Ironman & 100km Ultramarathon).
Connect with me on LinkedIn or X.

