Factors: Shorting Stocks vs the Index
Do Short Stock Positions Contribute to Factor Returns?
July 2018. Reading Time: 10 Minutes. Author: Nicolas Rabener.
SUMMARY
- Most factor investing research is based on long-short stock portfolios
- Investible risk premia strategies often feature a short index position
- Trade-off between theoretical alpha and implementation costs & efficiency
INTRODUCTION
Amundi, a French asset manager, was the first institution to launch a European multi-factor ETF that was market neutral, the Amundi ETF iSTOXX Europe Multi-Factor Market Neutral UCITS ETF (MKTN:FP). MKTN harvests factor returns from European equities and achieves market-neutrality by buying exchange-traded factor futures while shorting the Stoxx Europe 600 index future. This portfolio construction not only differs from competing funds, but also from academic research, which created the foundation of factor investing. This article investigates the difference between constructing a factor portfolio by shorting stocks on the one hand, and constructing a factor portfolio that shorts an index on the other. It proceeds as follows. First, it outlines the key differences between shorting stocks versus an index. Second, it analyses the impact of replacing stocks with the index for one factor in detail, specifically the value factor in the US. Finally, it highlights the impact for various factors in the US, Europe and Japan.
SHORTING STOCKS VERSUS SHORTING AN INDEX
Factor investing has its origin in the work of Fama and French (1993) who explained stock returns by the market risk and the value and size factors. In academic research factor portfolios are created by ranking the top and bottom stocks of a stock market by a factor and then rebalancing these on a regular basis. Nearly all academic research is based on selecting single stocks for the long and short portfolios and indices are rarely featured.
However, when undertaking fund management in practice, shorting a portfolio of stocks is much more complex and expensive than shorting an index. In order to short stocks, stocks first must be available for shorting, which requires confirmation from a broker as naked shorting is banned in most countries. Shorting an index can be done efficiently via futures or ETFs, which requires little up-front work and portfolio maintenance thereafter, aside from occasionally rolling the future forward at expiry and adjusting the trade size. The transaction and impact costs when executing trades are significantly lower when shorting an index as futures and ETFs are amongst the most liquid products traded on financial markets.
There is also the risk of short stock positions being recalled, which is at the lenders discretion and often occurs at inopportune moments for the short-seller, e.g. during a short squeeze. The ultimate owners of shares need to be compensated for lending the stocks to short-sellers, which results in annual borrowing fees of 30 to 40 basis points for liquid stocks to much higher rates for less liquid stocks. Shorting an index incurs a fraction of these costs (read Impact of Single Stocks on Factor Returns).
VALUE FACTOR IN THE US: SHORTING STOCKS VERSUS SHORTING AN INDEX
From an operational and cost perspective, it is far more efficient to short an index than a portfolio of stocks. But choosing to short an index will likely have an impact on the factor performance. An index typically represents the free-float market capitalisation-weighted average of all constituents of a stock market, which is fundamentally different from a portfolio of stocks ranked by a factor.
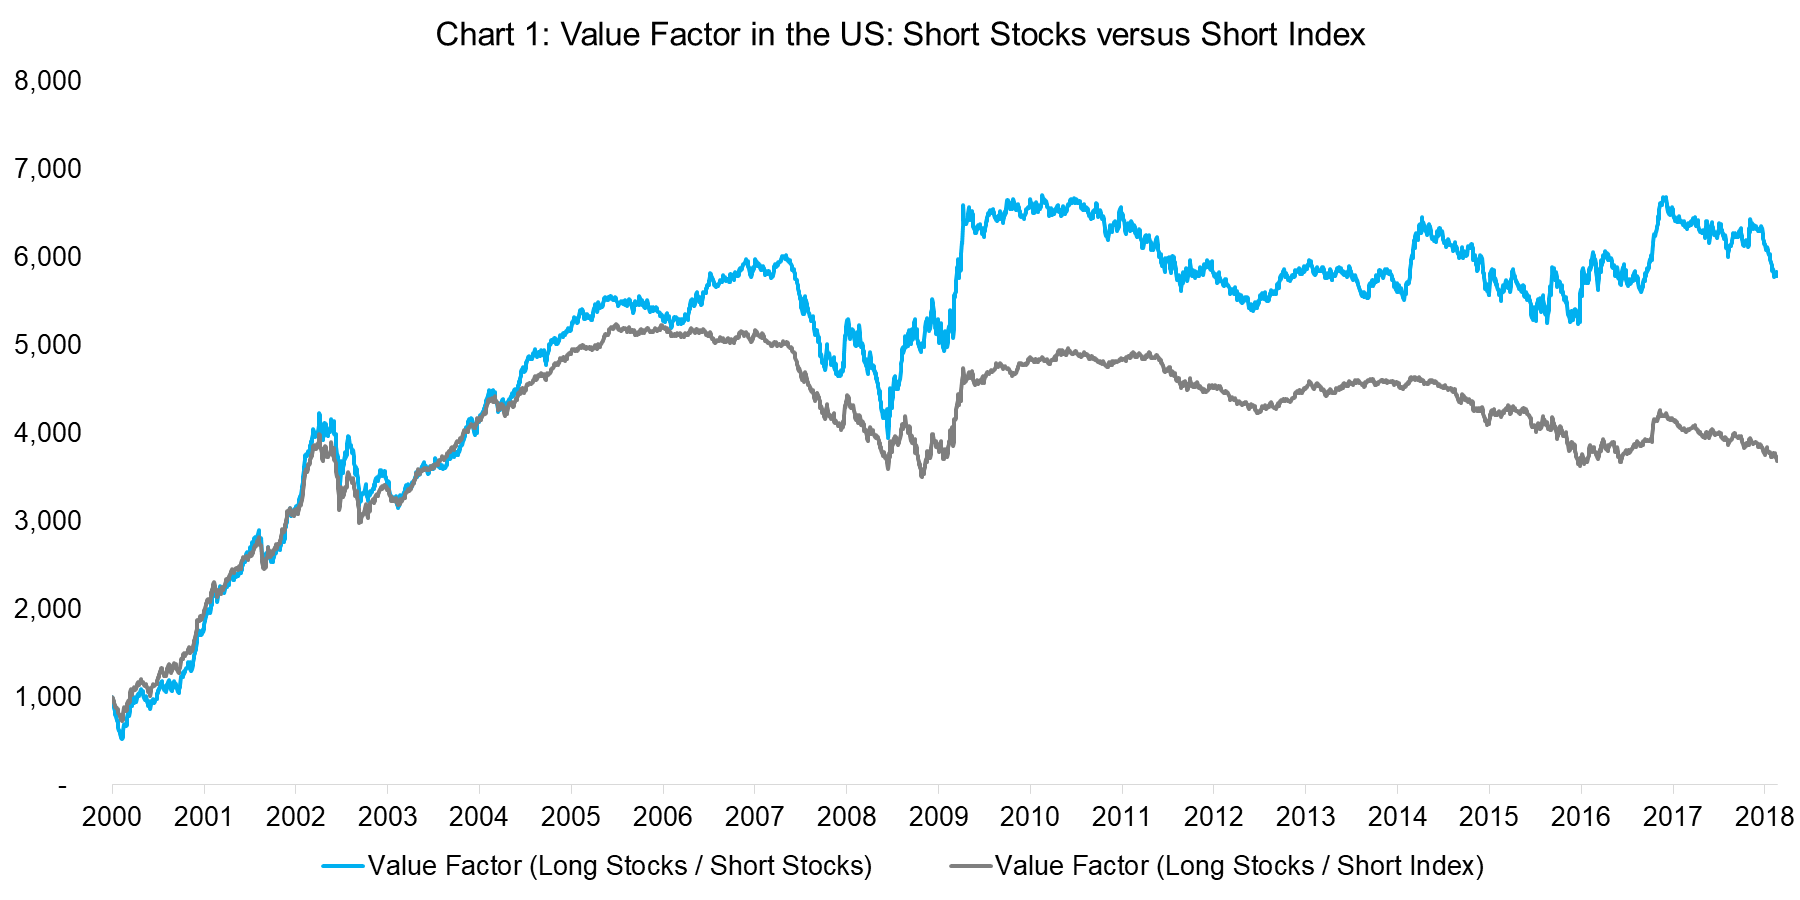
Chart 1 shows the performance for the value factor in the US, which is defined by an equal-weight combination of price-to-earnings and price-to-book multiples. The blue line shorts the most expensive 10% of stocks, while the grey line takes a short position in the index (the S&P 1500). The long portfolio is the same for both: selecting the cheapest 10% of stocks. The stock universe is defined as all US stocks with a market capitalisation of larger than $1 billion, which currently comprises approximately 1700 stocks. Portfolios are rebalanced monthly, reflect borrowing fees and include transaction costs of 10 basis points.
Source: FactorResearch
The performance of the long-short value factor was strong from 2000 to 2008, but has effectively been flat since then, causing difficult years for Value-oriented fund managers. The analysis also highlights that the performance of short-stocks value factor is almost identical to the short-index factor from 2000 to 2006, but superior thereafter.
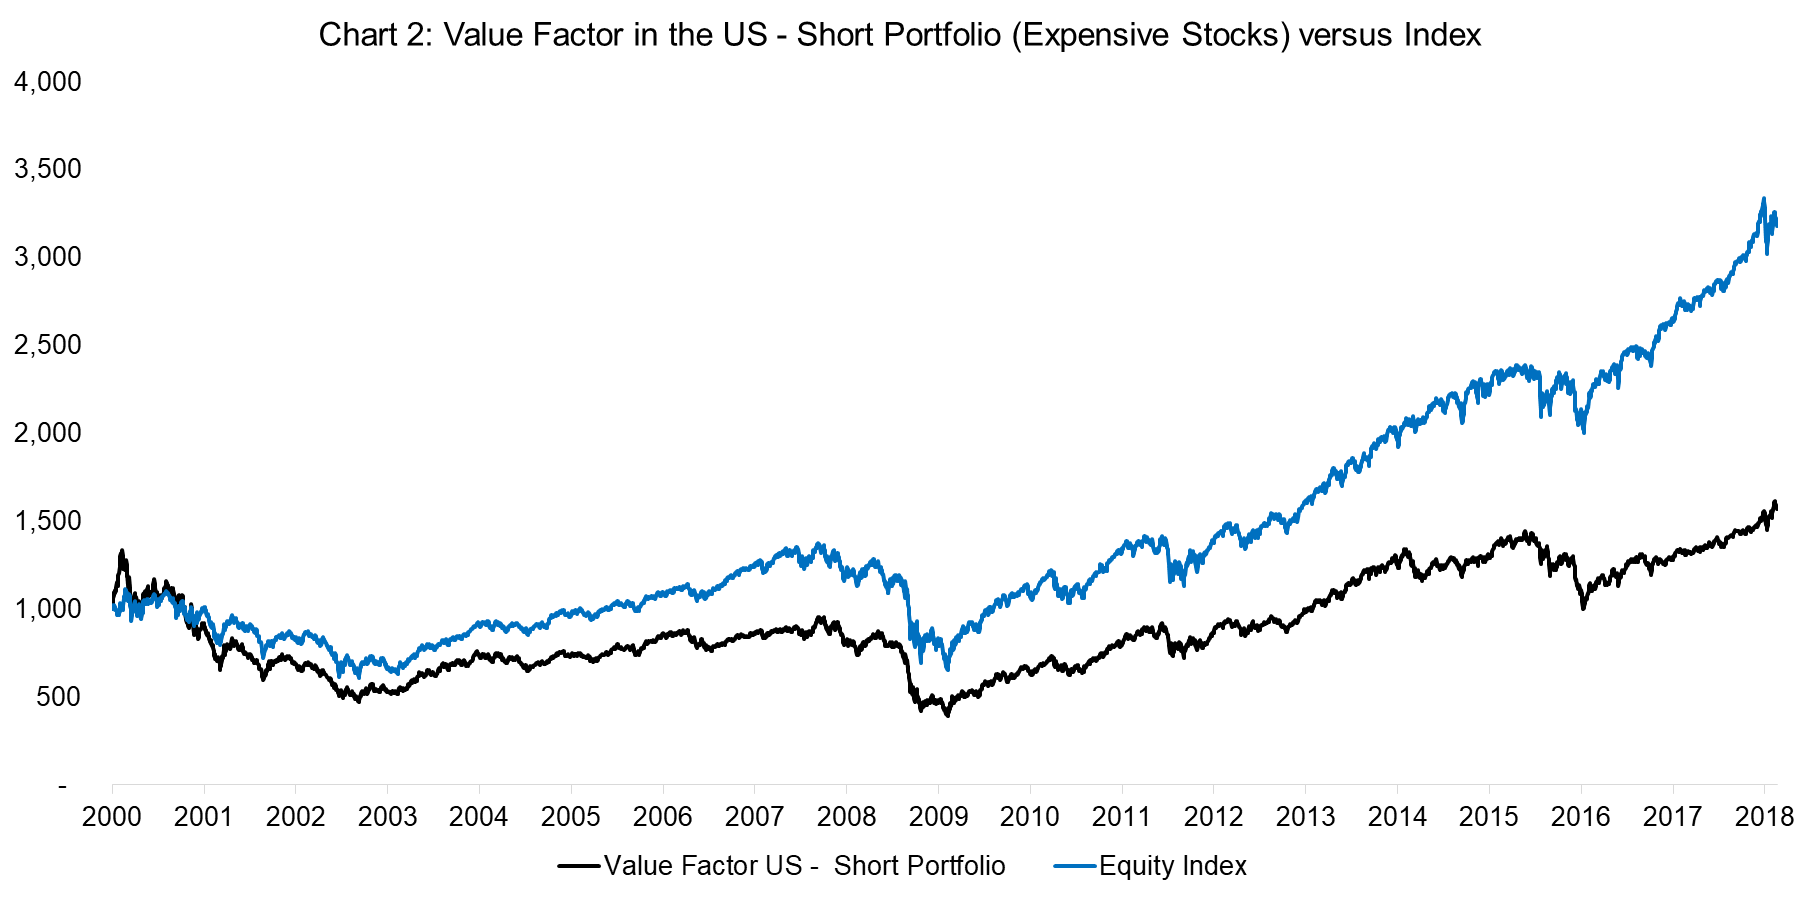
Given that the short-index value factor underperformed the short-stocks factor during the period from 2000 to 2018, this would imply that the index has outperformed the portfolio of expensive stocks. This is in evidence in Chart 2.
The black line in Chart 2 compares the performance of the short value portfolio (i.e. long the most expensive 10% of stocks) with the index, which is the blue line. The chart shows that the portfolio of expensive stocks indeed underperformed the index, which benefited the short-stocks value factor in terms of returns.
Source: FactorResearch
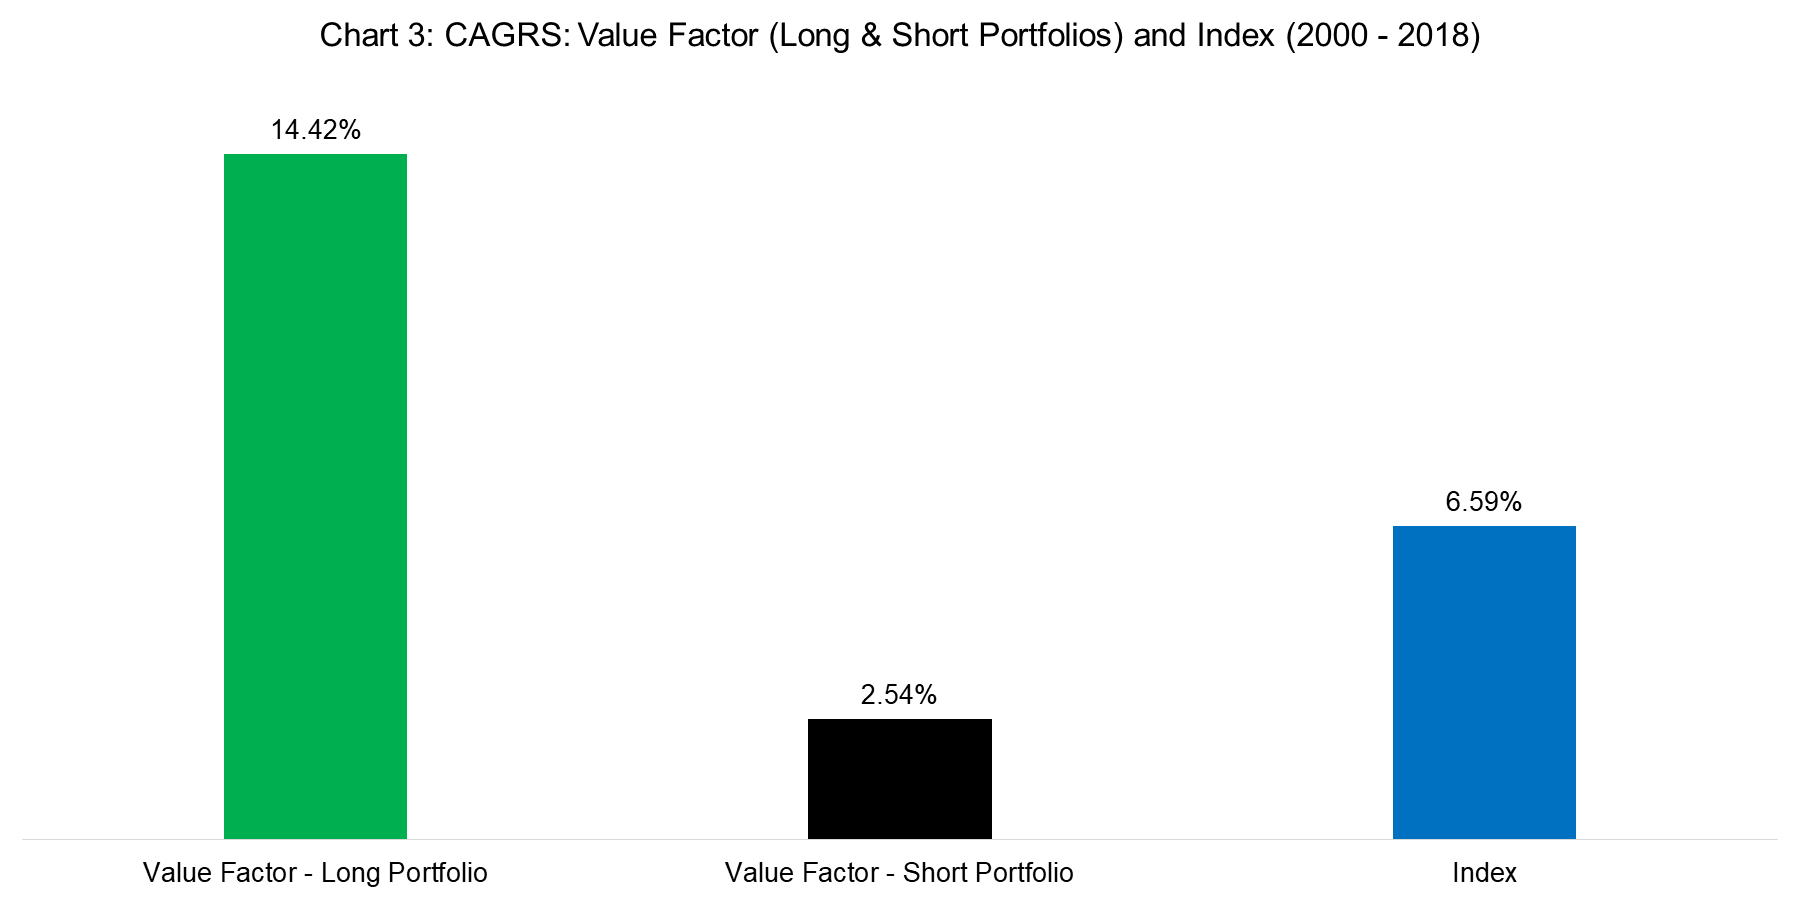
The US equity market has generated attractive returns over the last two decades, despite two severe market crashes (2000 tech bubble and the 2008 financial crisis). However, the long portfolio of the value factor, i.e. the cheapest stocks, has generated significantly higher returns than the index as can be seen in Chart 3.
Source: FactorResearch
It is worth noting that the value factor in the US and globally experienced a large drawdown during the tech bubble as investors disregarded fundamental valuations when buying exciting technology stocks between 1996 and 2000, therefore the high returns of the long portfolio of the value factor include a significant recovery of the factor performance.
WHAT THE VALUE SHORT PORTFOLIO IS MADE OF
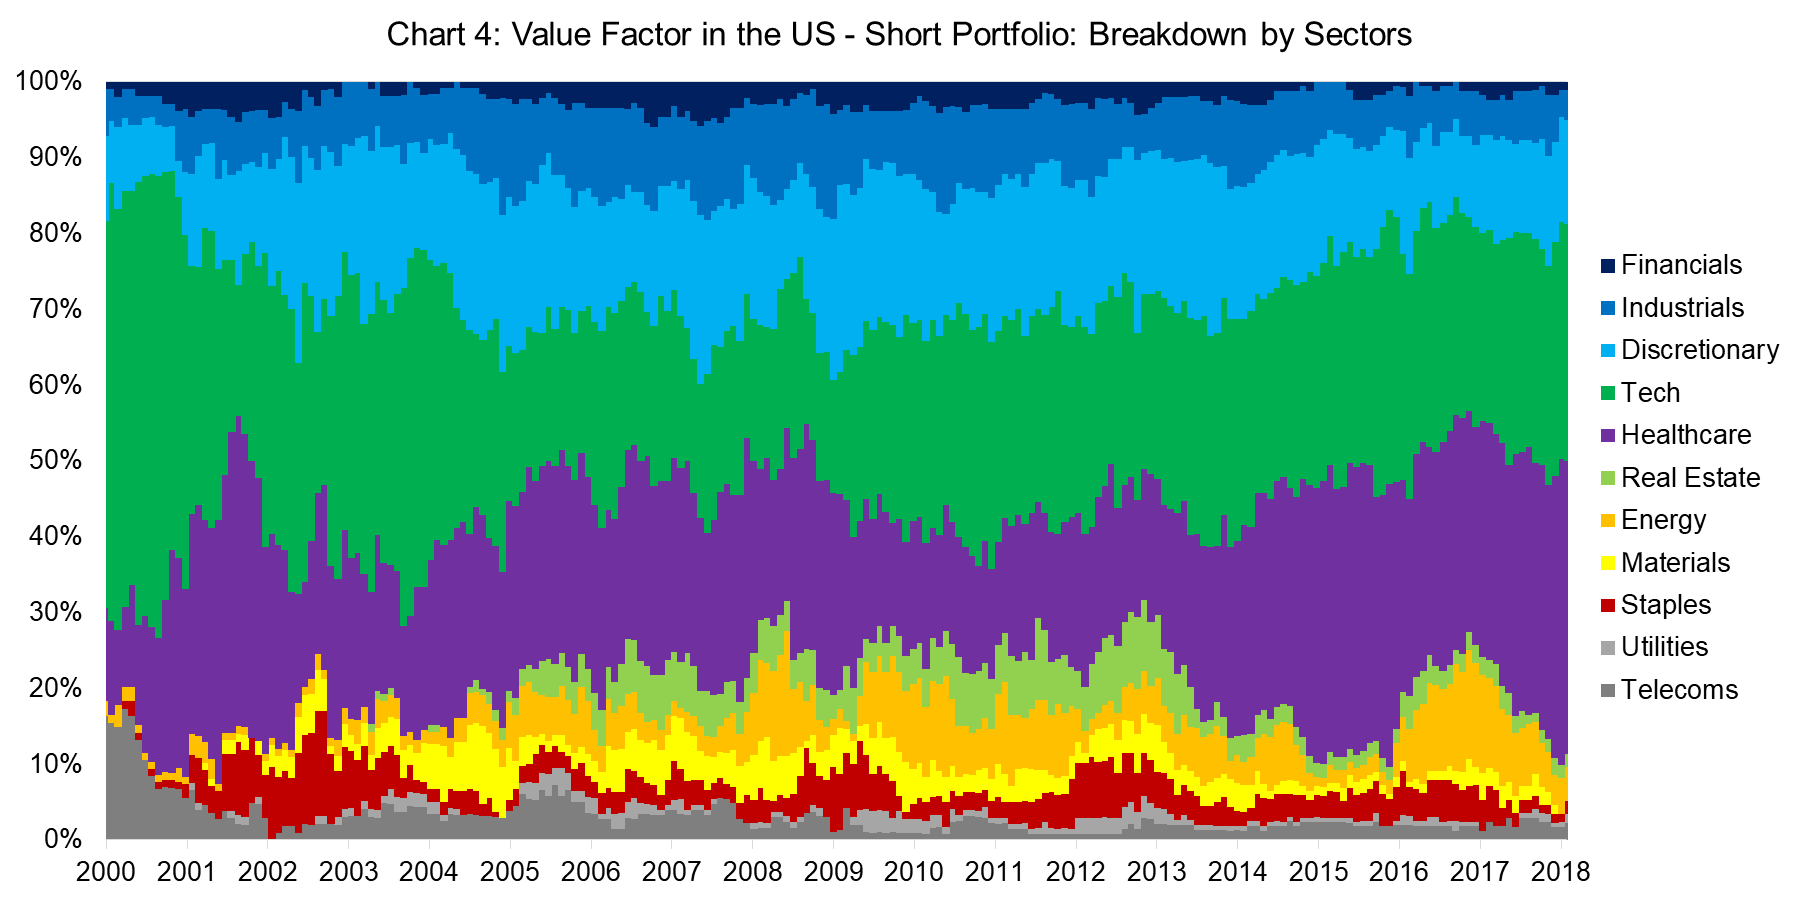
In addition to showing performance data, it is interesting to analyse what the short portfolio of the value factor is comprised of, which can be highlighted by a breakdown by sectors. The analysis in Chart 4 highlights the sectoral composition of that portfolio from 2000 to 2018. We can observe that there were significant biases toward the technology and healthcare sectors, which currently contribute approximately 70% of the short positions. It seems that these two sectors are structurally expensive compared to other sectors when measured on a combination of price-to-earnings and price-to-book multiples. The index is naturally more diversified across sectors, which explains the difference in performance when replacing the stocks with an index in the short portfolio of the value factor (read There is Value in the Value Factor).
Source: FactorResearch
It is worth noting that the long portfolio of the value factor has similar sectoral biases, specifically toward financial and consumer discretionary stocks, which are structurally cheap and currently make up approximately 50% of the portfolio.
MULTI-FACTOR PORTFOLIOS: SHORT STOCKS VERSUS SHORTING THE INDEX
The case study of the value factor has highlighted that there is a significant difference when constructing a factor by shorting stocks versus an index. Naturally these results are for one factor in a single market and therefore not sufficient for a sound conclusion on this research question.
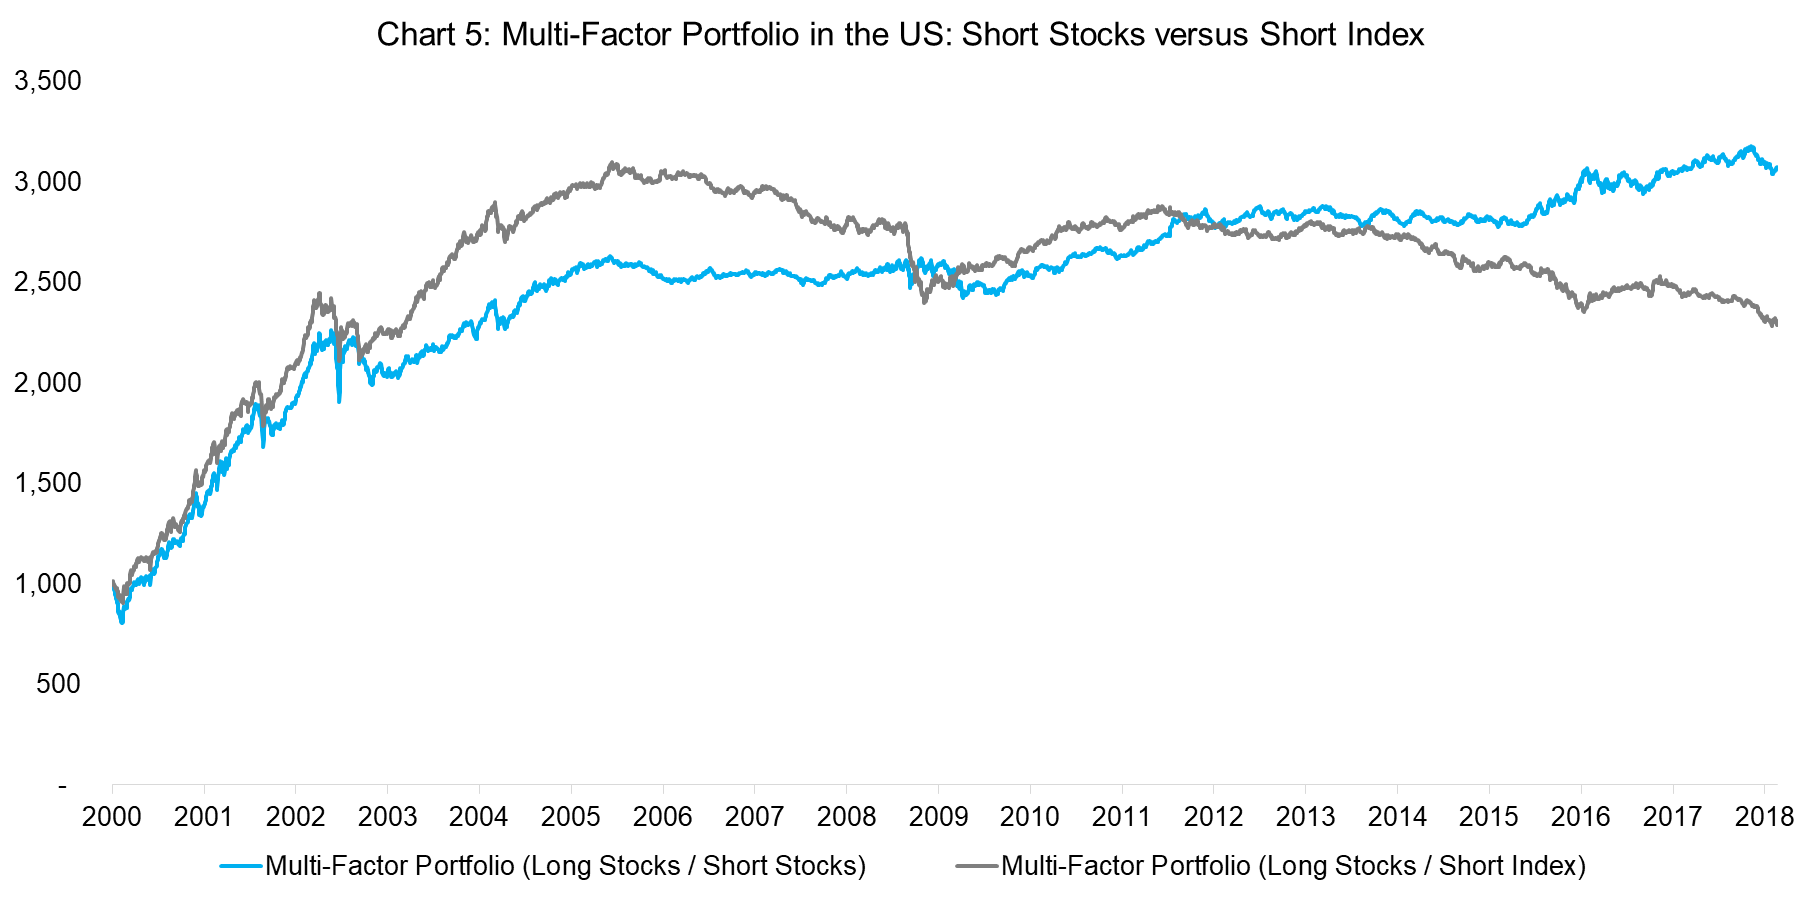
Therefore we construct a multi-factor portfolio, which comprises seven factors. They are: value, size, momentum, low volatility, quality, growth and dividend yield. The factors are defined in line with academic and industry standards, receive equal allocations and are rebalanced monthly.
Chart 5 displays the performance of a multi-factor portfolio in the US, once with stocks and alternatively with an index for the short portfolio. We can observe a strong performance between 2000 and 2006, which can be explained primarily by the performance of the value, size and dividend yield factors, and then flat returns thereafter. The analysis highlights that in the first few years the short-index portfolio generated a higher return, but over the entire observation period the short-stocks portfolio was more consistent in performance generation.
Source: FactorResearch
Analysing the outperformance of the multi-factor portfolios in the US reveals that this can be attributed to all seven factors and that there is not one of the seven factors where the short-index portfolio generated consistently higher returns. Over some years shorting the index did lead to a superior performance; however, over the full observation period from 2000 to 2018 the performance was higher for each factor when constructed with stocks in the short portfolio.
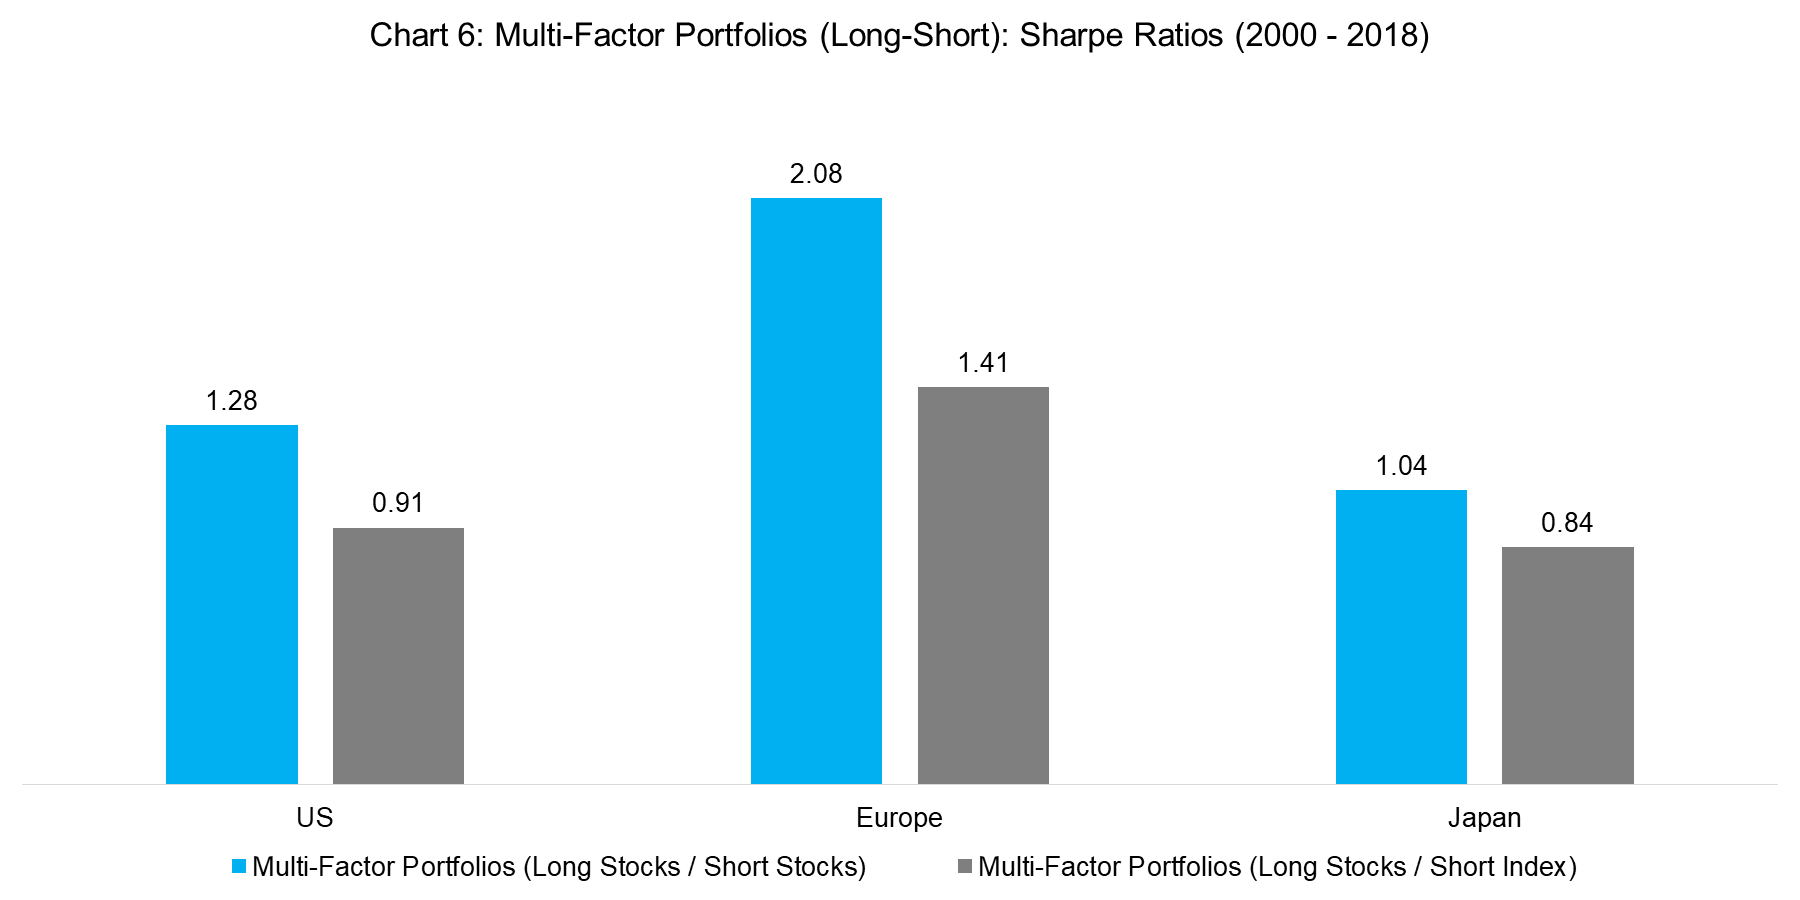
The analysis can be extended to Europe and Japan and highlight the difference in terms of risk-adjusted returns. Chart 6 shows that in each of the three regions the Sharpe ratios of the long-short multi-factor portfolios are higher when shorting stocks instead of the index.
Source: FactorResearch
CONCLUSION
This article highlights that factor portfolios can be constructed by shorting stocks or an index. The latter has significant benefits from an operational and cost perspective; however, leads to lower risk-adjusted returns across factors and regions.
The analysis can be challenged that it is entirely based on backtesting, as is nearly all research in factor investing, which should be viewed with caution. From this perspective the short-index portfolio can be seen as slightly advantageous as there is likely to be a smaller difference between backtested and realised returns. Stocks selected for the short portfolio might not be available for shorting or only at significant borrowing costs, which are not issues when considering shorting an index as this will always be available with relatively low fees. Naturally none of these risks of real life fund management are reflected in the backtesting.
In summary, factor investing is based on academic research that uses stocks for the construction of the long and short portfolios while some investible products replace the stocks with a short position in an index. Although the results presented in this article highlight that using stocks is significantly more attractive, the difference is likely smaller in realised compared to theoretical returns.
FURTHER THOUGHTS
Although replacing the stocks with an index in the short portfolio did lead to lower returns in this article, the performance profiles are still comparable, which indicates that a large part of the returns were contributed by the long portfolio. The distribution of returns by long and short portfolios across factors and geographies represents another interesting research topic.
ABOUT THE AUTHOR
Nicolas Rabener is the CEO & Founder of Finominal, which empowers professional investors with data, technology, and research insights to improve their investment outcomes. Previously he created Jackdaw Capital, an award-winning quantitative hedge fund. Before that Nicolas worked at GIC and Citigroup in London and New York. Nicolas holds a Master of Finance from HHL Leipzig Graduate School of Management, is a CAIA charter holder, and enjoys endurance sports (Ironman & 100km Ultramarathon).
Connect with me on LinkedIn or X.

