Failing to Build High Sharpe Ratio-Portfolios
A Sharpe ratio of 1 should be easily achievable, right?
- High Sharpe ratios are attractive given consistent returns
- However, the traditional 60/40 portfolio generated a Sharpe ratio of well below 1
- Achieving a sustainable 1+ Sharpe ratio is challenging
INTRODUCTION
Maven Search, a headhunter, is currently looking for an experienced portfolio manager to run quantitative strategies at a multi-strategy hedge fund based in New York. The right candidate should have at least three years of trading experience, can code in Python and C+, has a Ph.D. or Master’s degree, and a track record with a 1.5+ Sharpe ratio.
Oxford Knight, another recruiter, is looking for “ambitious and driven PMs/Quants” that have a Sharpe ratio of at least 5 for another hedge fund. Essentially this means for a 10% return the annual volatility would only be 2%, which is not much at all considering that the S&P 500 often rises or falls by 2% per day.
Unfortunately, most investors do not have the flexibility and infrastructure of a multi-strategy hedge fund, so need to constrain themselves to simpler portfolios.
In this research note, we will explore if the average investor can achieve a Sharpe ratio of at least 1.
SHARPE RATIOS OF THE US STOCK MARKET
Almost all investors’ portfolios are dominated by exposure to the stock market, which typically reduces as investors age and need more certainty for their retirement. If someone had a 100% exposure to the stock market, what would have been the risk-adjusted returns?
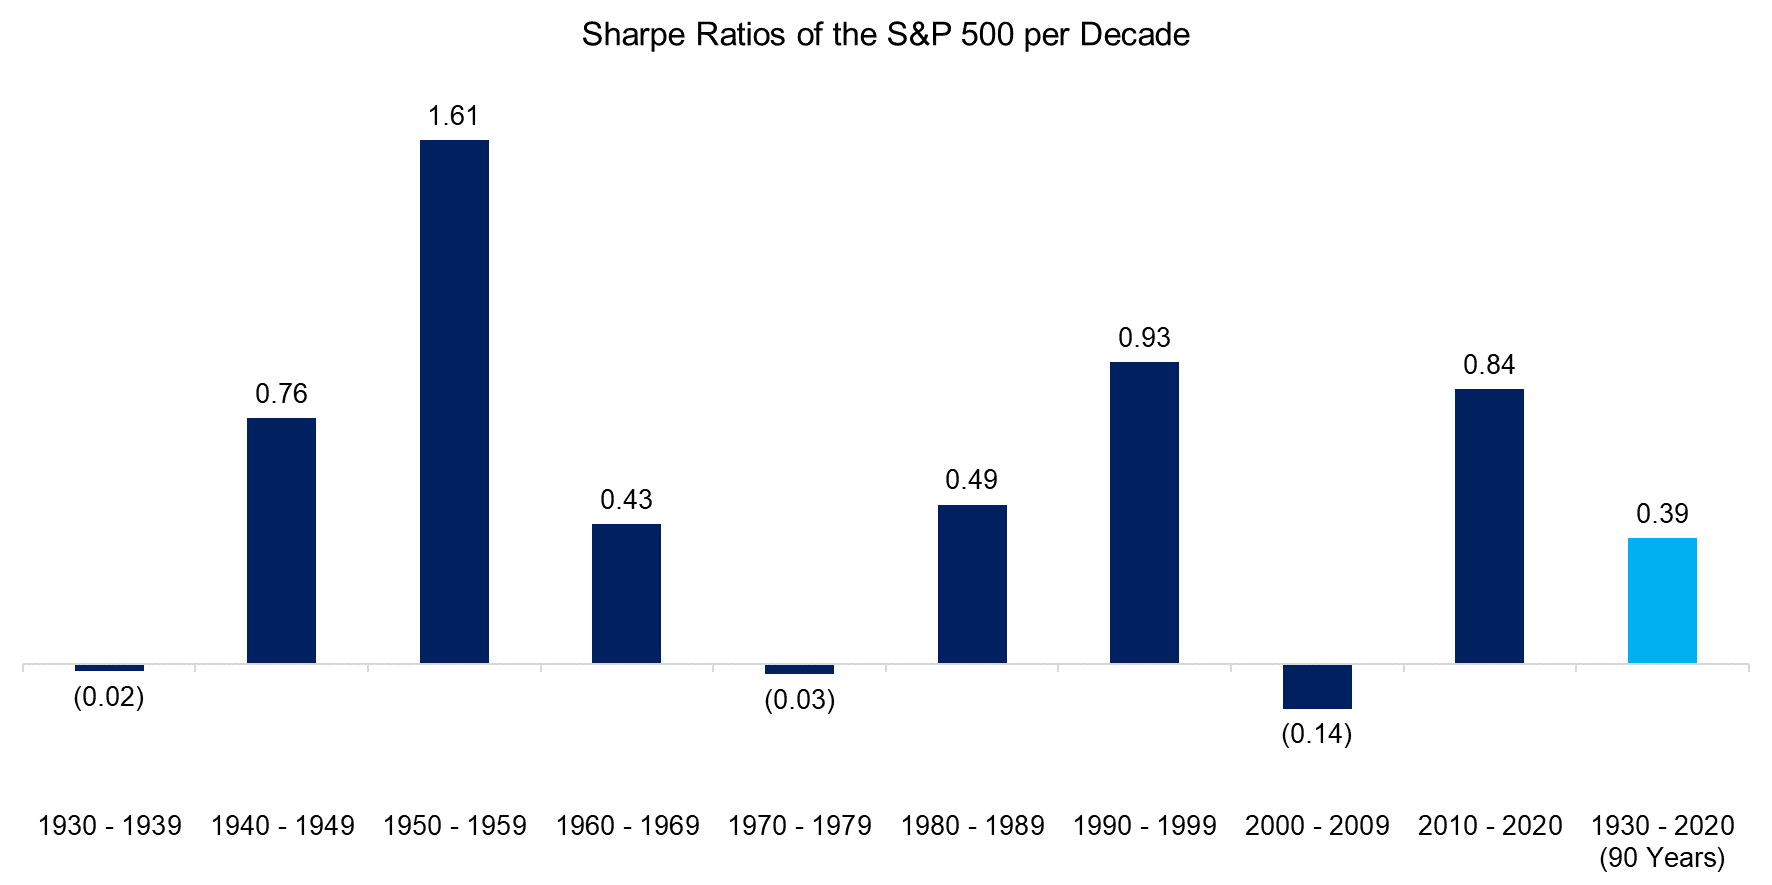
We use returns from the Kenneth R. French data library and compute the Sharpe ratio for the U.S. stock market for each decade since 1930. We observe that the ratio ranged widely with three periods of slightly negative Sharpe ratios and one decade with a stellar ratio of 1.61 between 1950 and 1959, which reflects the economic recovery after World War II. However, the Sharpe ratio for the entire 90-year period was a mere 0.39.

Source: Kenneth R. French Data Library, Finominal
SHARPE RATIOS OF 60/40 PORTFOLIOS
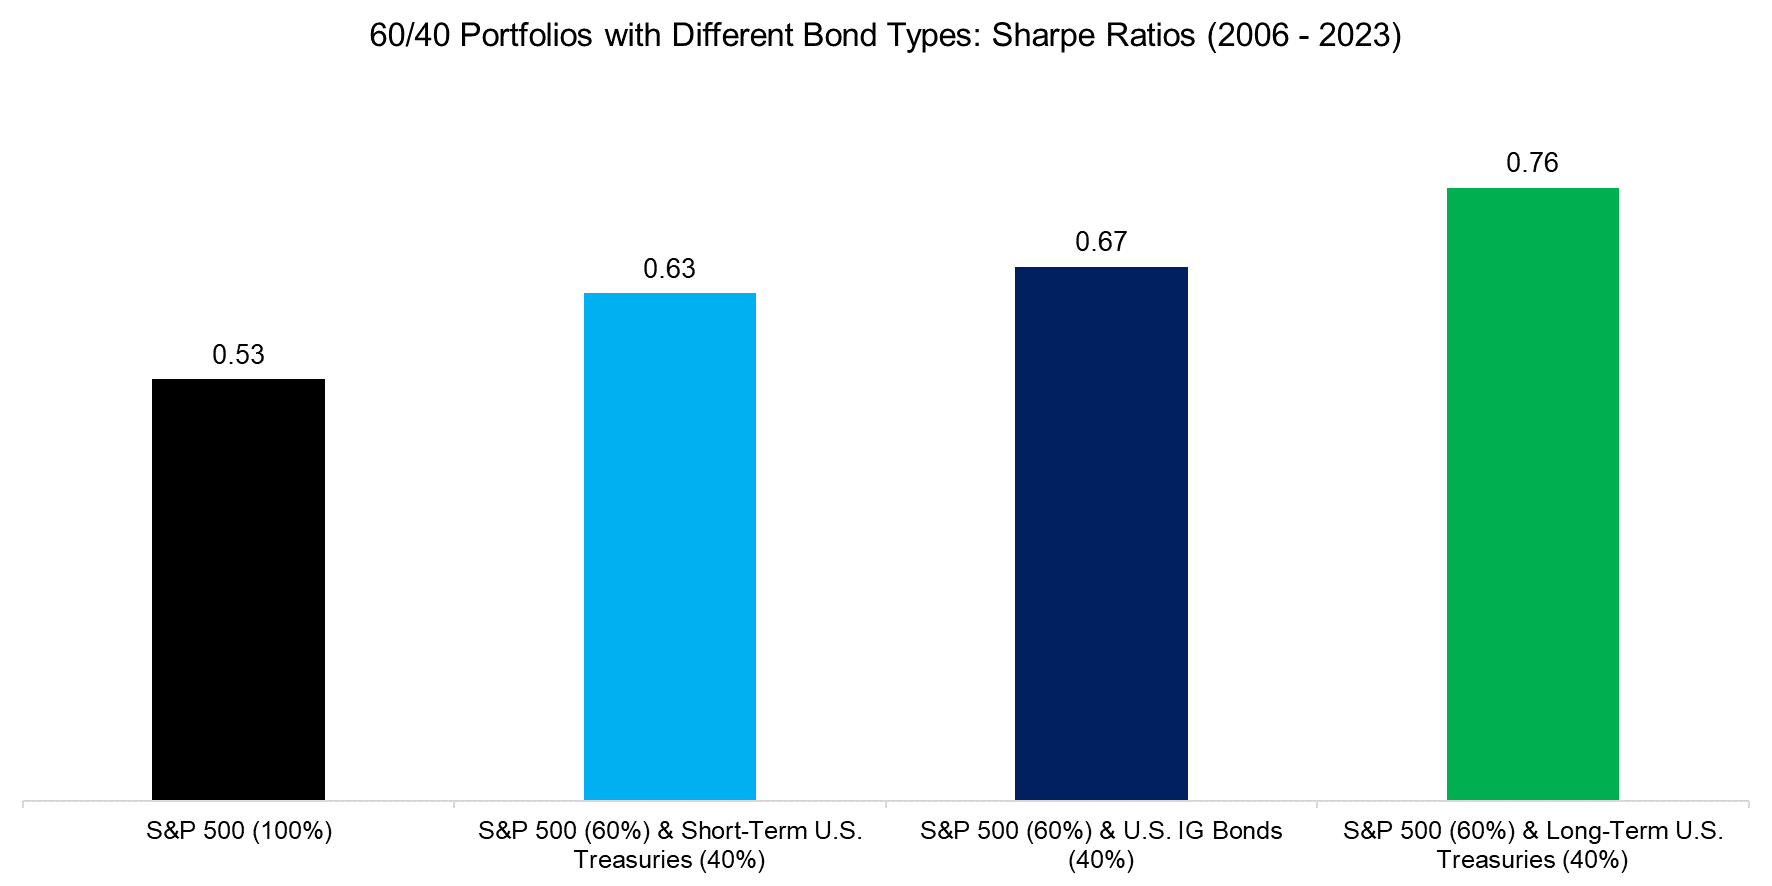
The low Sharpe ratio of the U.S. stock market and especially the three decades with negative returns outline the need for diversification. Most investors simply add bonds, but there is a wide choice of fixed-income instruments. We backtest a 60% allocation to the S&P 500 and a 40% allocation to three different bond types for the period from 2006 to 2023.
Given that interest rates mostly declined and bonds were largely uncorrelated to stocks, diversification worked exceptionally well during this period. We observe that long-term U.S. Treasuries would have increased the Sharpe ratio by the most. These long-term bonds were more volatile than short-term U.S. Treasuries and investment-grade bonds, but generated a higher return and were most negatively correlated to the S&P 500, therefore led to the largest diversification benefits.

Source: Finominal
SHARPE RATIOS OF DIVERSIFIED PORTFOLIOS
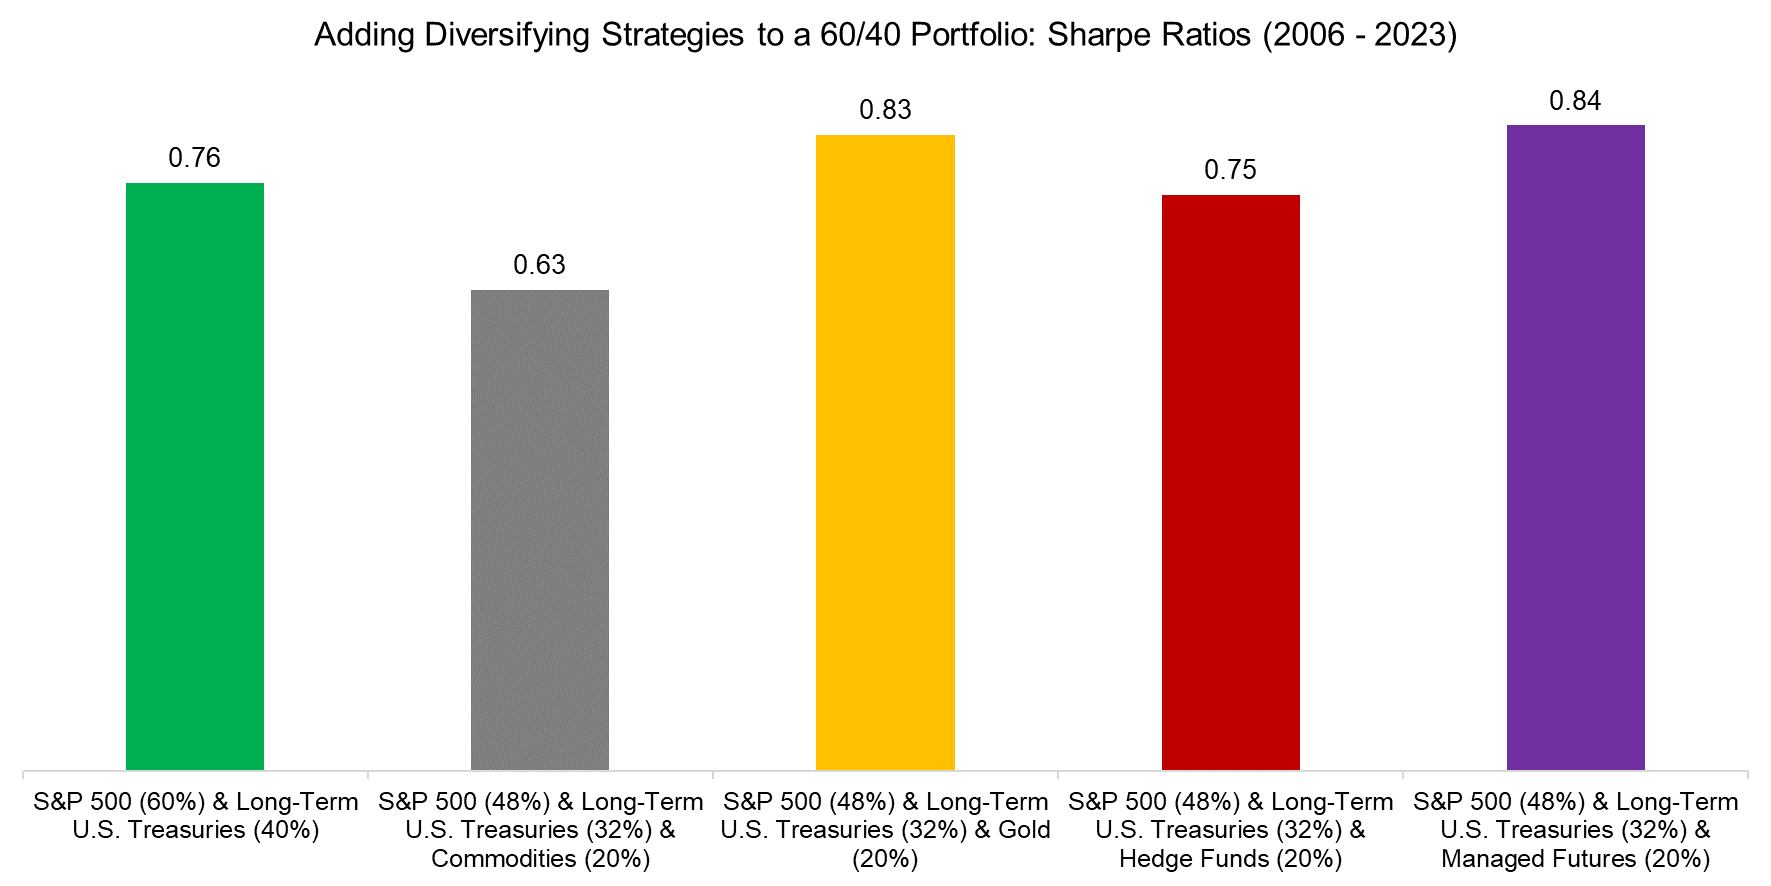
However, although bonds added diversification benefits over the last 15 years, the Sharpe ratio of the best 60/40 portfolio was only 0.76.
Next, we consider adding a 20% allocation to other diversifying strategies that are easily available for the average investor via ETFs or mutual funds. We do not focus on single managers, but rather on asset classes like commodities and strategies like managed futures. Real estate, private equity, and venture capital are excluded as these are largely proxies for the stock market (read Private Equity: The Emperor has No Clothes and The Case Against REITS).
Backtesting these diversified portfolios highlights that adding commodities and hedge funds, represented by the HFRX Global Hedge Fund Index, would not have generated any diversification benefits in the period from 2006 to 2023. In contrast, adding gold or managed futures would have increased the Sharpe ratio of a 60/40 portfolio from 0.76 to 0.83 and 0.84 (read CTAs vs Global Macro Hedge Funds).

Source: Finominal
The lack of diversification benefits from commodities and hedge funds can be explained by these exhibiting poor returns and moderately positive correlations to stocks. Commodities lost -4.5% per annum while hedge funds generated a paltry annual return of 0.9% in the period between 2006 to 2023, compared to 9.7% for the S&P 500. The correlations to the S&P 500 were 0.60 and 0.41 respectively.

Source: Finominal
SHARPE RATIOS OF SHARPE RATIO-OPTIMIZED PORTFOLIOS
Although gold and managed futures increased the Sharpe ratio of a 60/40 portfolio, it was still below our target of at least one. Given this, we feel forced to venture into the dark art of overfitting.
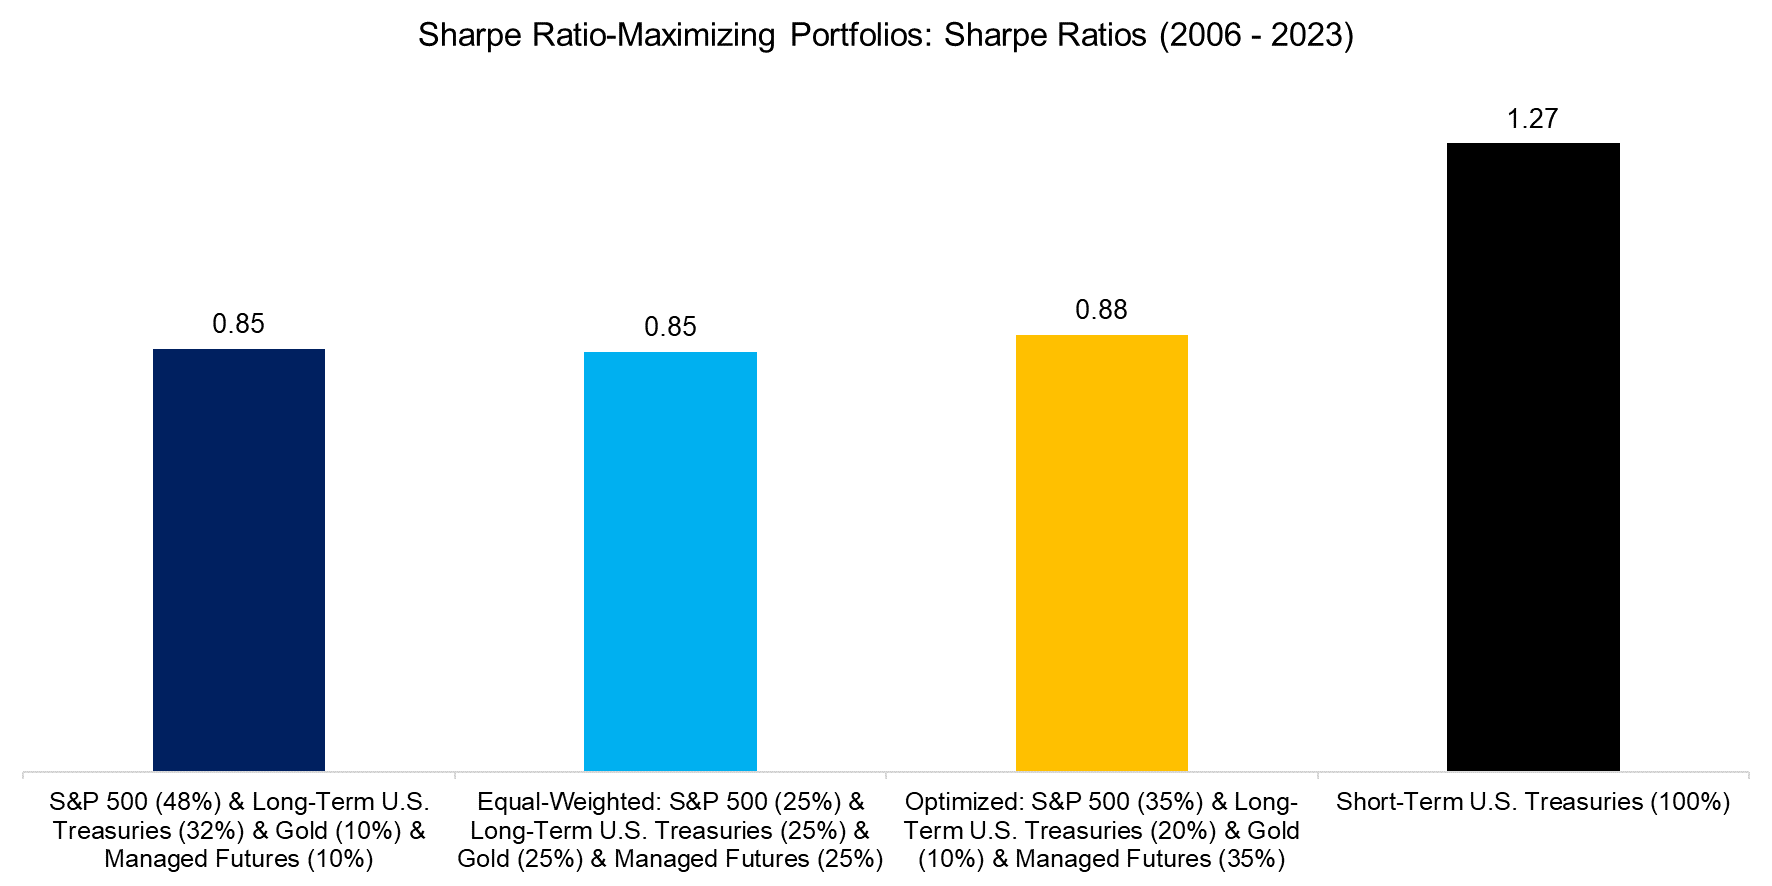
We know that gold and managed futures worked, so we created three additional portfolios with the final one representing a purely Sharpe ratio-optimized portfolio, which allocates 35% to the S&P 500, 20% to long-term U.S. Treasuries, 10% to gold, and 35% to managed futures. Most investors would likely feel uncomfortable allocating as much to managed futures as to equities, but even this combination would have only resulted in a Sharpe ratio of 0.88 in the period from 2006 to 2023.
We could have achieved a Sharpe ratio above one, but only if we would have allocated 100% to short-term U.S. Treasuries. Although such a concentrated portfolio would feature a Sharpe ratio of 1.27, investors would likely have been disappointed by the low return of 1.6% return, especially given the high levels of inflation over the last few years.

FURTHER THOUGHTS
It seems that achieving a Sharpe ratio above 1 is quite difficult, despite having multiple diversifying asset classes and strategies at hand. Furthermore, although the lookback period did include two major stock market crashes, we included one of the best-performing stock markets and a bond market that was mostly bullish. Replicating this in other markets like Europe or Japan would likely have resulted in worse risk-adjusted returns.
Many strategies manage to achieve high Sharpe ratios over a short time period, but very few, if any, over the long term. The exceptions are fraud like Madoff, private market strategies like private credit that ignore mark-to-market accounting (read A Crescendo in Private Credit?), high frequency and market-making strategies.
Asking for 5+ Sharpe ratios for hedge fund roles seems to be at odds with reality, especially when considering that the ratio of the HFRX Global Hedge Fund Index was a mere 0.26 over the last 15 years.
RELATED RESEARCH
Smart Beta vs Alpha + Beta
Myth Busting: Alts’ Uncorrelated Returns Diversify Portfolios
Private Equity: The Emperor has No Clothes
The Case Against REITS
60/40 Portfolios Without Bonds
A Crescendo in Private Credit?
How Much Can You Lose with Bonds?
CTAs vs Global Macro Hedge Funds
Multi-Strategy Hedge Funds: Equity in a Different Shade?
ABOUT THE AUTHOR
Nicolas Rabener is the CEO & Founder of Finominal, which empowers professional investors with data, technology, and research insights to improve their investment outcomes. Previously he created Jackdaw Capital, an award-winning quantitative hedge fund. Before that Nicolas worked at GIC and Citigroup in London and New York. Nicolas holds a Master of Finance from HHL Leipzig Graduate School of Management, is a CAIA charter holder, and enjoys endurance sports (Ironman & 100km Ultramarathon).
Connect with me on LinkedIn or X.

