Good versus Bad Value Stocks
Trying to avoid value traps
March 2021. Reading Time: 10 Minutes. Author: Nicolas Rabener.
SUMMARY
- Value stocks can be easily filtered by applying quality metrics in order to sort out value traps
- Value & High Quality generated higher returns than Value in Europe and Japan, but not in the US
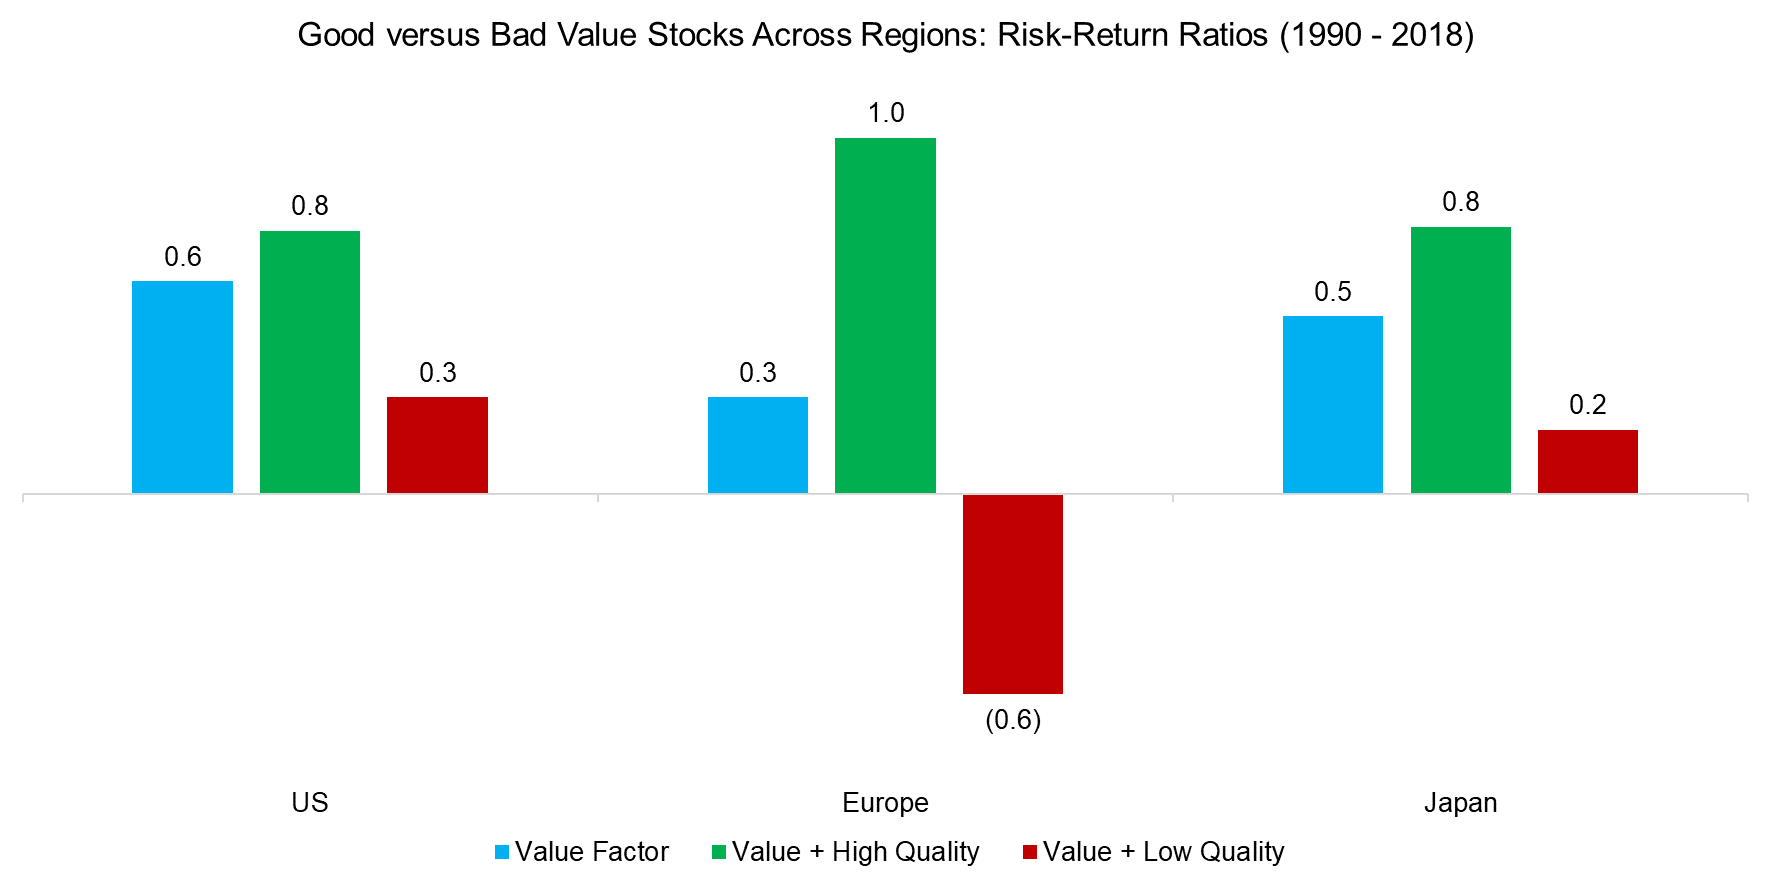
- However, from a risk perspective, metrics improved across all markets
INTRODUCTION
Running a marathon is similar to being a Value investor, especially in recent years where it seems more like an ultra-marathon. Both activities are painful experiences that require the ability to suffer and persist through physically and emotionally straining times. And there is the fear of being attacked by mountain lions or unleashed dogs. The former is only relevant when running in certain US states like Utah, but the latter a global problem, especially in emerging markets.
In the value investing world, there are no mountain lions, but there are value dogs, which are stocks that are cheap and stay cheap. When a novice value investor stumbles across these, they seem like incredible bargains. A price-to-earnings ratio below 10, what is not to like?
However, after years of holding such stocks without much performance to show for, the realization sets in that these are structurally impaired businesses. The stock is not mispriced and market expectations are not wrong, it is simply a dying business. Another name for these stocks is value traps.
Investors have several tools at hand to avoid these siren stocks and one common approach is to rank cheap stocks by another metric, effectively creating a multi-factor portfolio. Ideally, these other factors feature low or negative correlations to Value, where Momentum and Quality represent the most popular choices.
In this short research note, we will contrast Value & High Quality versus Value & Low Quality across stock markets (read Value+Quality or High Quality Value Stocks).
GOOD VERSUS BAD VALUE STOCKS
We focus on all stocks in the US, Europe, and Japan with a market capitalization larger than $1 billion. We utilize a sequential model to first rank all stocks by an equal-weight combination of price-to-book and price-to-earnings multiples and then rank the residual universe by a combination of debt-over-equity and return-on-equity ratios. At each step, 30% of the stocks are selected, which results in concentrated portfolios on the long and short side. Given that we rank for high and low quality, this approach generates four portfolios: cheap and high quality, cheap and low quality, expensive and high quality, and expensive and low quality.
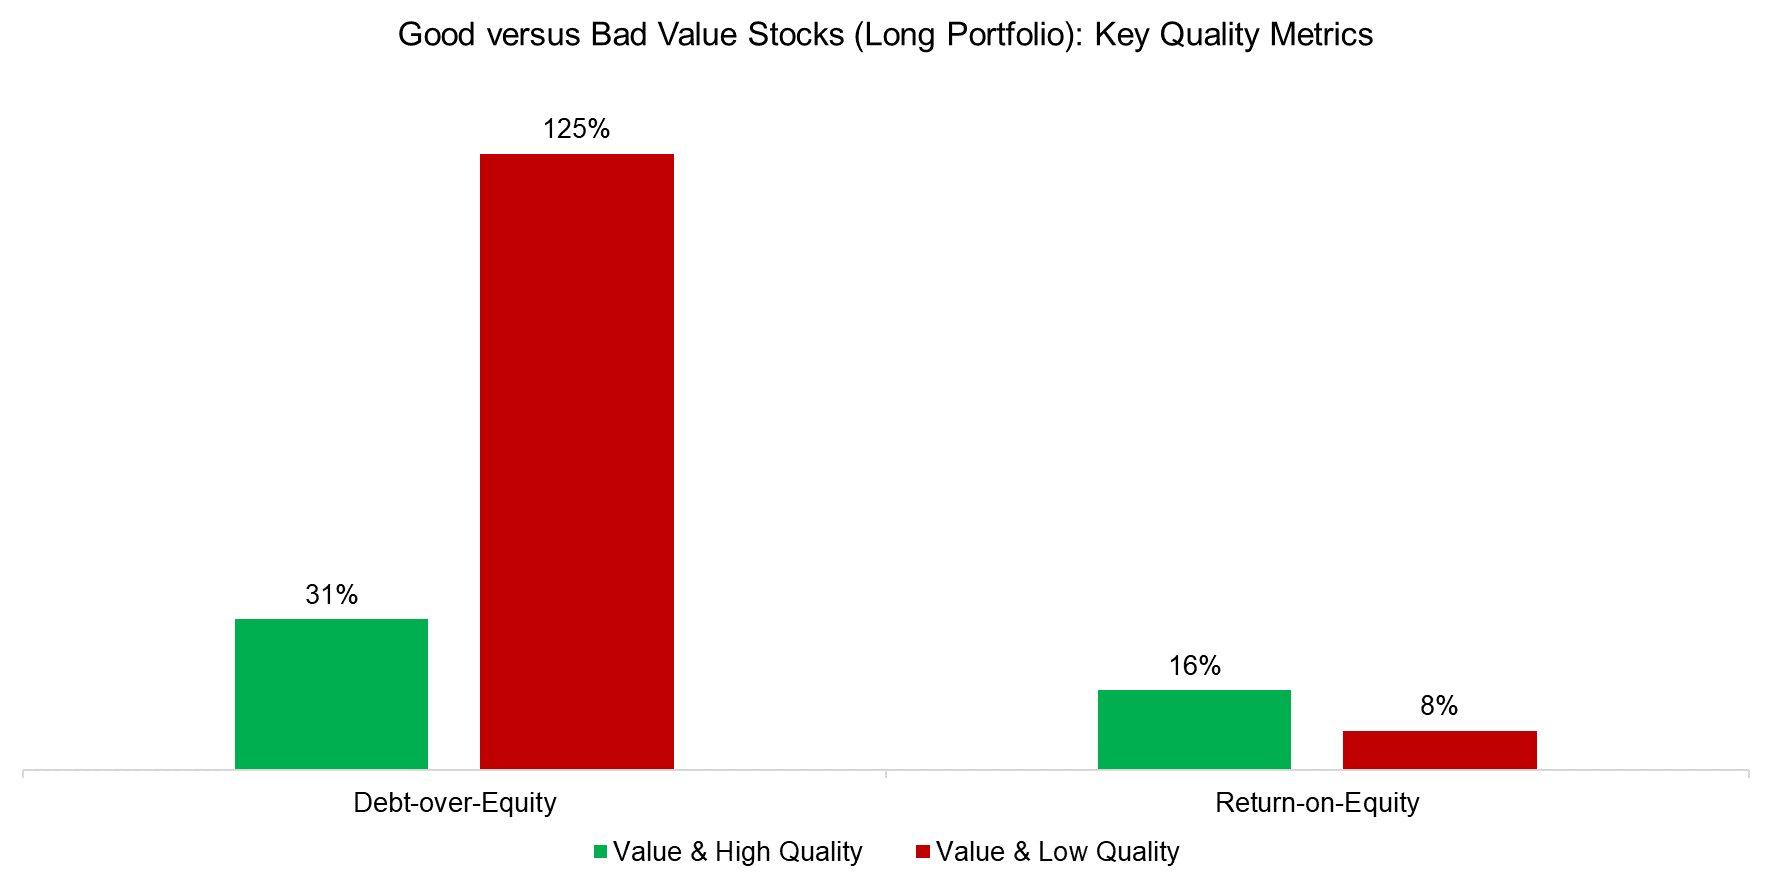
We can highlight the fundamental differences by contrasting the long portfolio of the multi-factor combinations, which shows a lower debt-over-equity and a higher return-on-equity ratio for the cheap and high-quality stocks, as per definition.
Source: FactorResearch
VALUATIONS
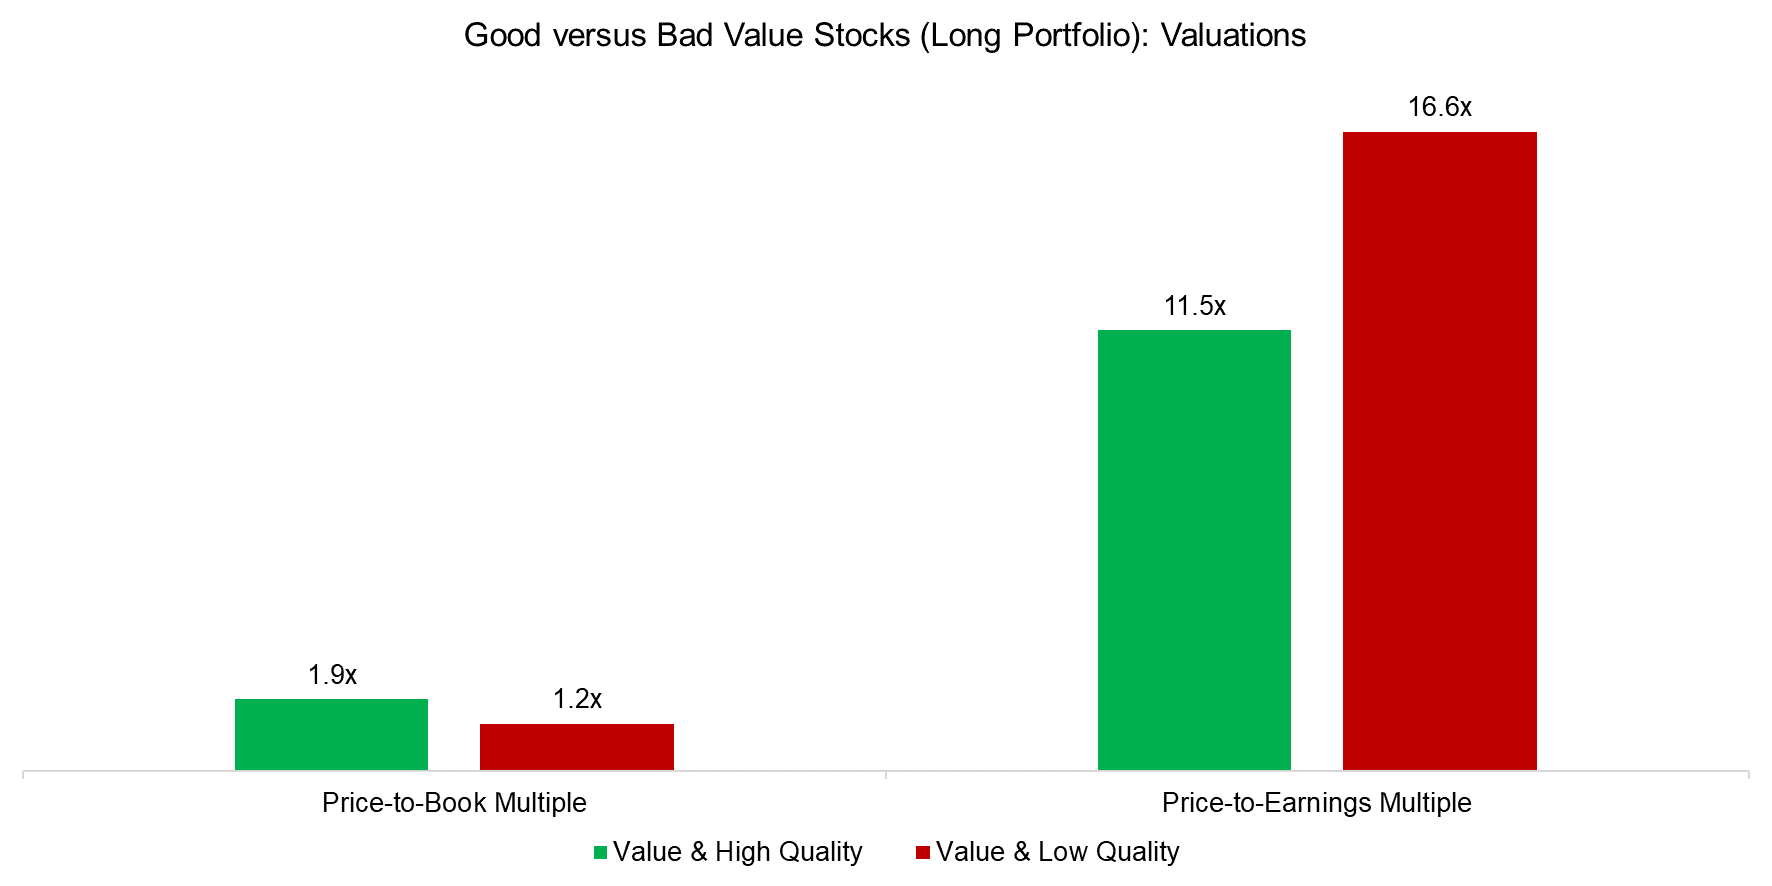
Intuitively, cheap and low-quality stocks should be cheaper than cheap and high-quality stocks, which is the case when using median price-to-book multiples, but not for price-to-earnings (PE) (read Cheap vs Expensive Factors).
It somewhat unusual to observe that investors seem to pay higher PE multiples for companies with worse fundamentals, however, this can be explained by different sector biases. Both portfolios are heavily exposed to financials, but the portfolio comprised of cheap and low-quality stocks has an almost 30% allocation to real estate and utility stocks, which represent highly leveraged companies that tend to trade at above-average PE multiples.
Source: FactorResearch
CONTRASTING RETURNS
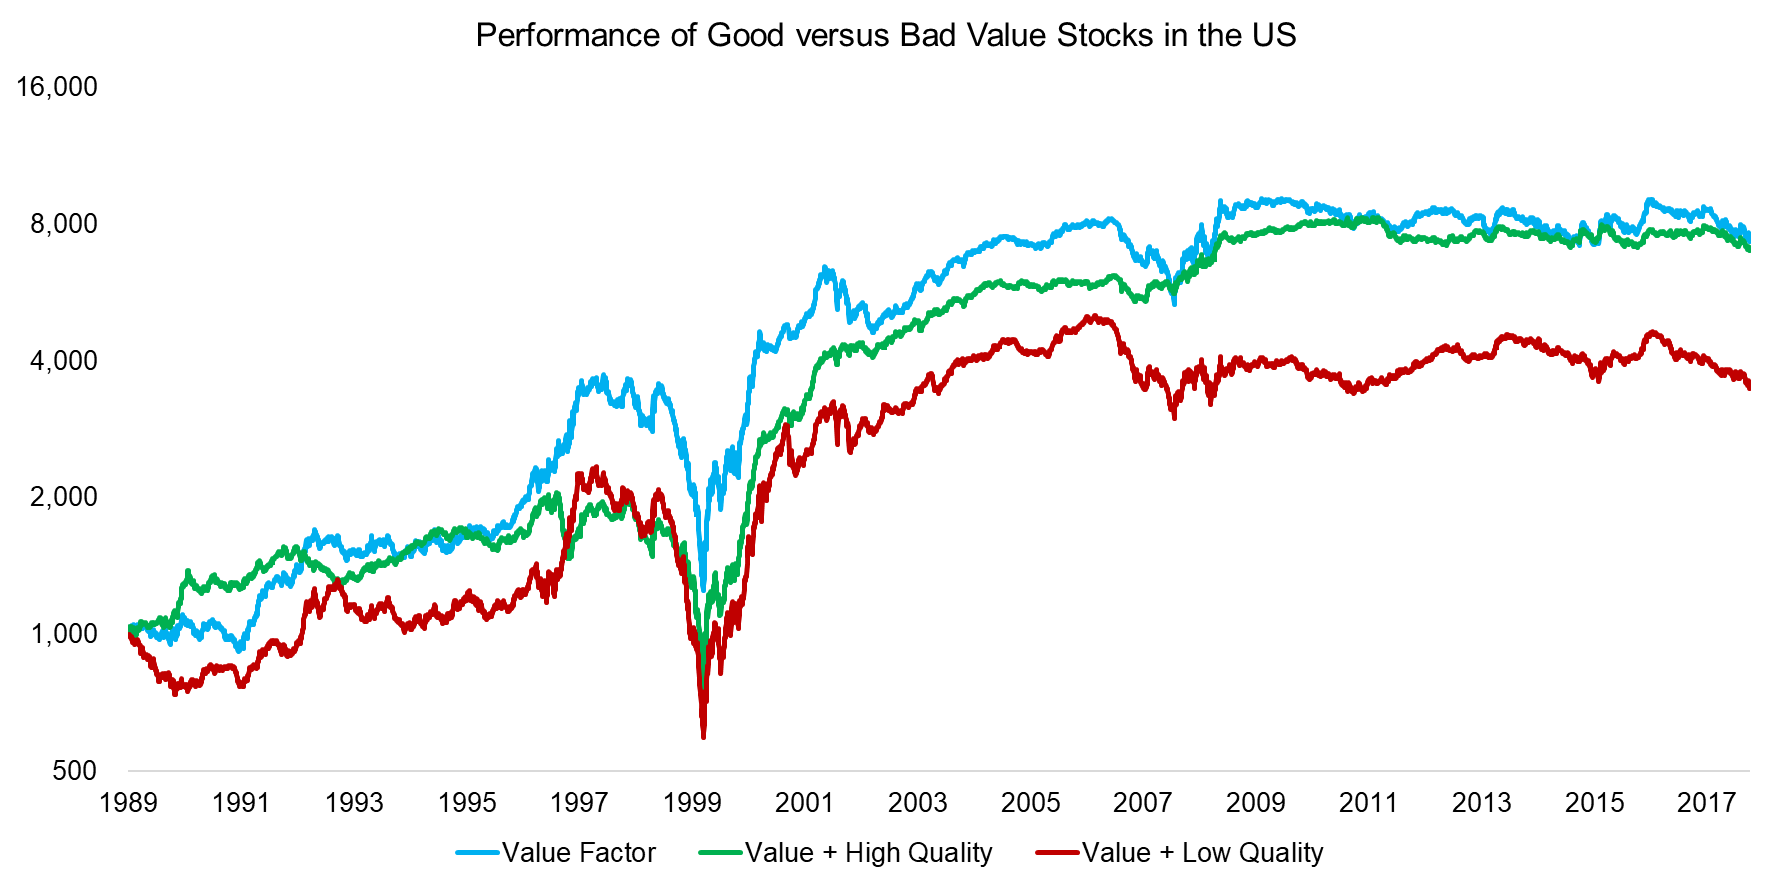
Theoretically, value traps should be detracting from the performance of the Value factor, and excluding these should result in better returns. However, the performance of the long-short Value factor and the Value & High Quality combination in the US were approximately the same in the period between 1989 and 2018.
The Value & Low Quality portfolio performed worse than the factor on a stand-alone basis, as expected, but it seems that the cheap stocks with average-quality characteristics outperformed those with high-quality features.
Source: FactorResearch
AVOIDING VALUE TRAPS ACROSS MARKETS
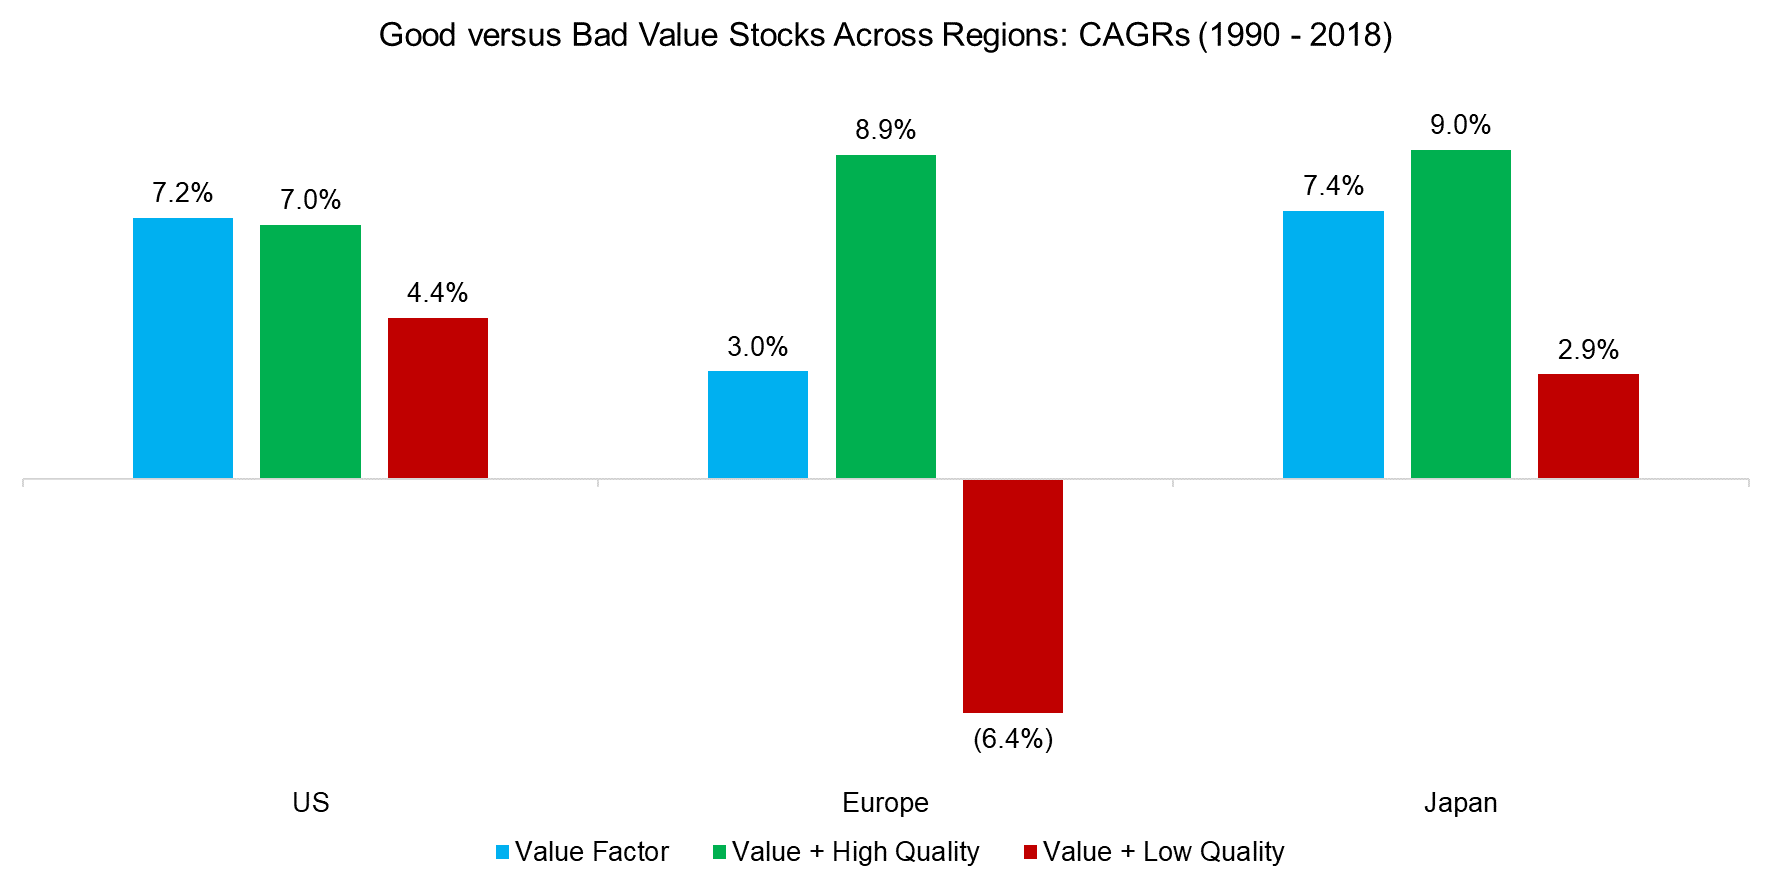
Next, we calculate the CAGRs for the three scenarios in the US, Europe, and Japan, which highlights positive excess returns from the Value factor across regions over the last three decades. Naturally, these returns were not distributed equally and were largely negative over the last decade, but that is another discussion.
However, more interestingly, we observe that in Europe and Japan the Value & High Quality combination significantly outperformed the Value factor. It is difficult to explain why this approach was less successful in the US, but should not be regarded too critically as financial markets are noisy. The threshold for quantitative approaches to be of interest is that a methodology should have a sound economic foundation and should work on average, but not necessarily in each market or over too short time periods.
Source: FactorResearch
Finally, we calculate the risk-adjusted returns for the three scenarios, which shows that focusing Value & High Quality resulted in the highest risk-return ratios across markets. Given that the return for the factor combination was lower than for the Value factor in the US implies lower volatility when including quality metrics, which is intuitive. Cheap stocks tend to be companies in trouble, but when leverage is low and profitability moderate, then it might be more temporary than structural issues.
It is also worth noting that the Value & High Quality combination experienced much lower maximum drawdowns than cheap stocks. In the US the maximum drawdown, which occurred during the tech bubble in 1999, only reduced from 66% to 63%, but from 65% to 46% in Europe, and from 83% to 34% in Japan.
Source: FactorResearch
FURTHER THOUGHTS
Factor investing is like cooking. There are millions of plants, but only a few are edible and relevant for our kitchen. Some like potatoes or rice can be eaten as a stand-alone meal, but result in a rather bland eating experience. Mixing these up with herbs and spices produces a much more delicious and balanced dish.
Quality on its own is not an attractive factor as it is difficult to make a case that investors should be earning positive excess returns for holding stocks featuring low leverage and high profitability. The factor is more useful as a filter, similar to the Size factor, although that is currently being hotly debated in otherwise calm academic circles.
However, even if focusing on high-quality cheap stocks has generated more attractive returns than cheap stocks on their own, the performance still largely represents that of the Value factor. No amount of herbs or spices will cover that up.
RELATED RESEARCH
ABOUT THE AUTHOR
Nicolas Rabener is the CEO & Founder of Finominal, which empowers professional investors with data, technology, and research insights to improve their investment outcomes. Previously he created Jackdaw Capital, an award-winning quantitative hedge fund. Before that Nicolas worked at GIC and Citigroup in London and New York. Nicolas holds a Master of Finance from HHL Leipzig Graduate School of Management, is a CAIA charter holder, and enjoys endurance sports (Ironman & 100km Ultramarathon).
Connect with me on LinkedIn or X.

