Have Stock Markets Changed?
Same old, same old, it seems.
September 2023. Reading Time: 10 Minutes. Author: Nicolas Rabener.
SUMMARY
- Trading technology continues to make the trading of stocks easier, cheaper, and faster
- However, despite this and other financial innovations like ETFs, the US stock market structure hasn’t changed
- Likely explained by the fact that its core participants are unable to change
INTRODUCTION
Consider the following:
- The average holding period for an individual stock in the US was 5 years in the 1970s, compared to 10 months as of today
- Passive ETFs have become the largest shareholders in many stocks
- High-frequency trading firms dominate the trading of stocks
- The cost of trading has become essentially zero for institutional and retail investors
- The Fed and other central banks try to be manage stock markets more actively
- A single retail investor based in the UK has been able to cause a flash crash in the S&P 500
Given all these changes, there is frequent commentary that markets have changed. Value-focused fund managers moan that their investment style has stopped working. Bond traders complain that liquidity can evaporate in even the largest fixed-income markets during certain periods.
However, although there are constantly new innovations in financial markets, its core participants have barely changed and are still constantly shifting from fear to greed. Performance chasing is alive and well, unfortunately (read An Anatomy of Thematic Investing).
In this research article, we will evaluate if the market structure of the US stock market has changed.
MARKET STRUCTURE ANALYSIS
There are many ways of analyzing the market structure of the US stock market, which can be dissected on micro and macro levels. We want to compare the market structure across decades, where long-term data is only available for the latter. Our primary data source is the library of Professor Kenneth R. French, which offers daily stock market returns for almost a century.
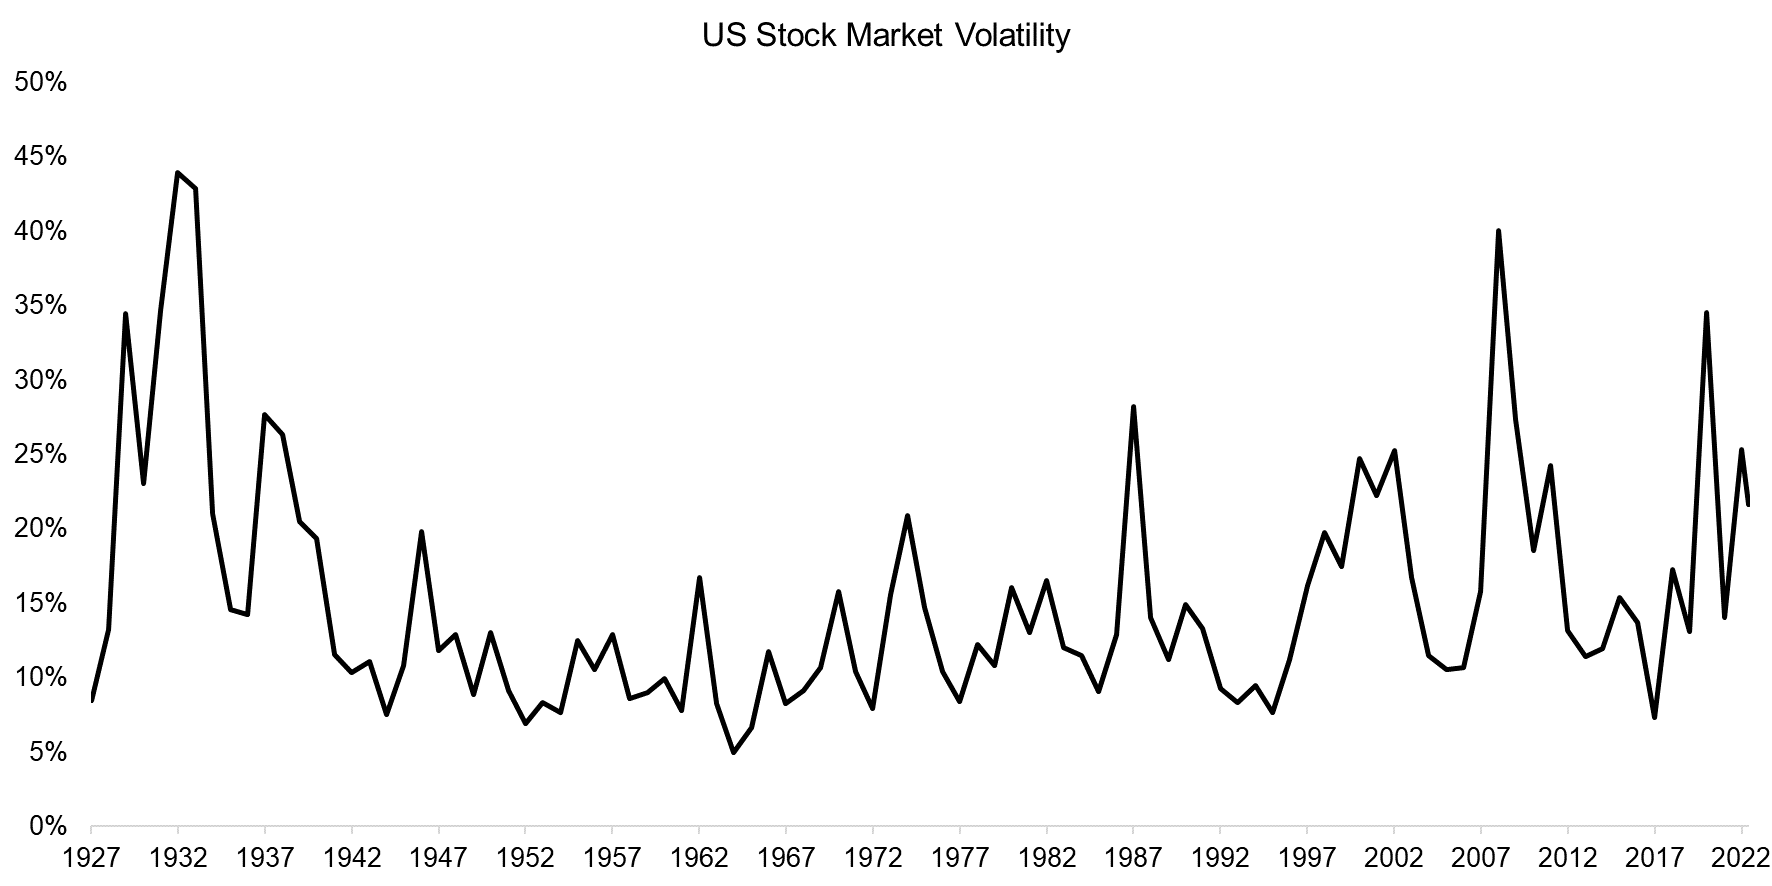
We kick off this analysis by reviewing the annualized volatility of the US stock market between 1927 and 2023, which highlights that volatility peaked during the Great Depression in the 1930s, but reached almost similar heights during the Global Financial Crisis in 2008 and COVID-19 crisis in 2020.
The USA can be perceived as an emerging market at the beginning of the 19th century, which makes it curious that the stock market’s volatility in modern times reached similar magnitudes, despite a much more financially-literate investment community.
Source: Finominal
SKEWNESS
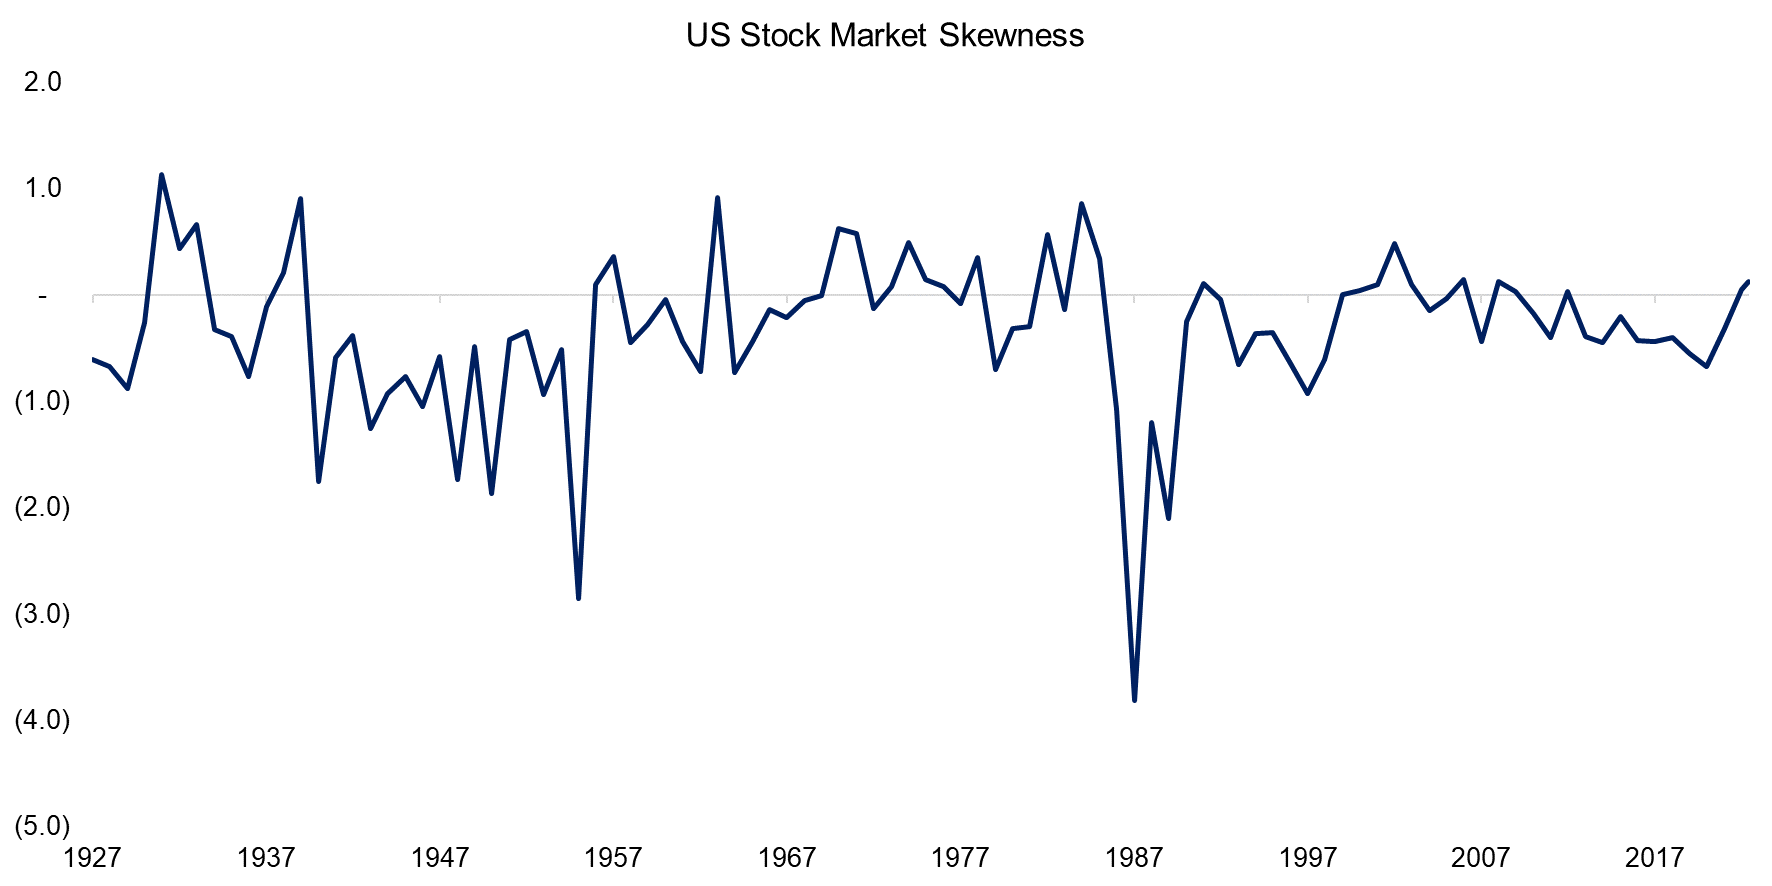
Next, we analyze if the skewness of the US stock market has changed, but the long-term data does not suggest this. Skewness was at its lowest point post the stock market crash in 1987 and was slightly negative during the last decade, but not very different than in the 1940s or 1960s.
Source: Finominal
KURTOSIS
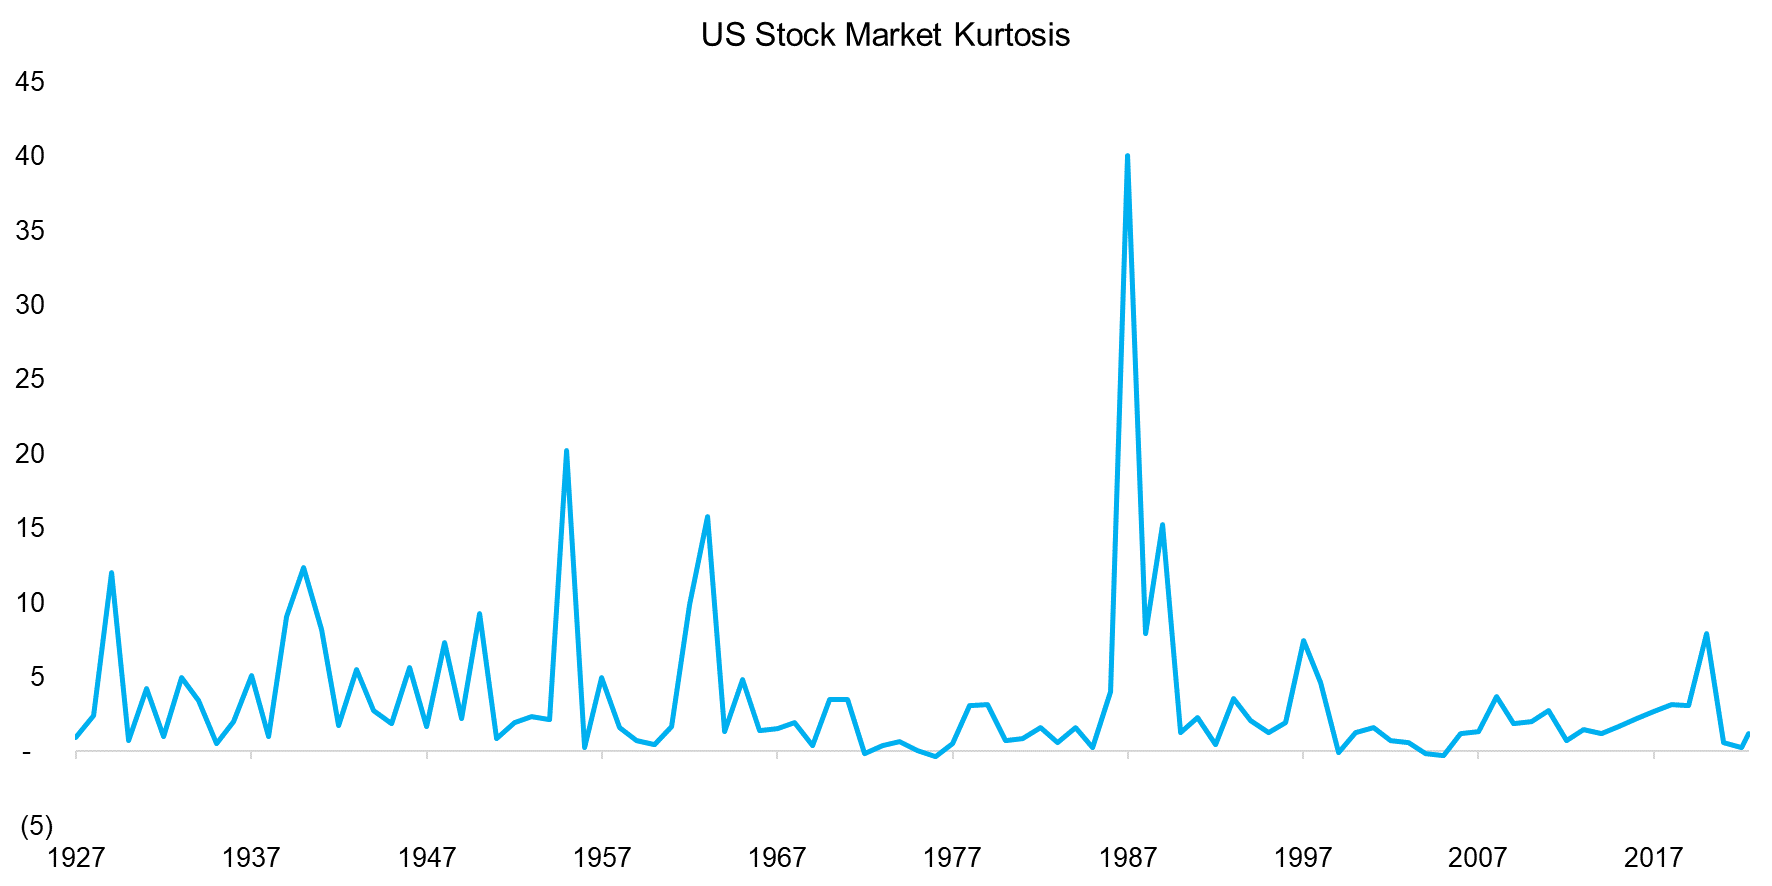
The fourth dimension of return analysis is kurtosis, which also does not highlight a change in the US stock market. Similar to skewness, it peaked in 1987, and was low during the last decade, but comparable to the 1970s.
Source: Finominal
UP & DOWN PRICE CHANGES
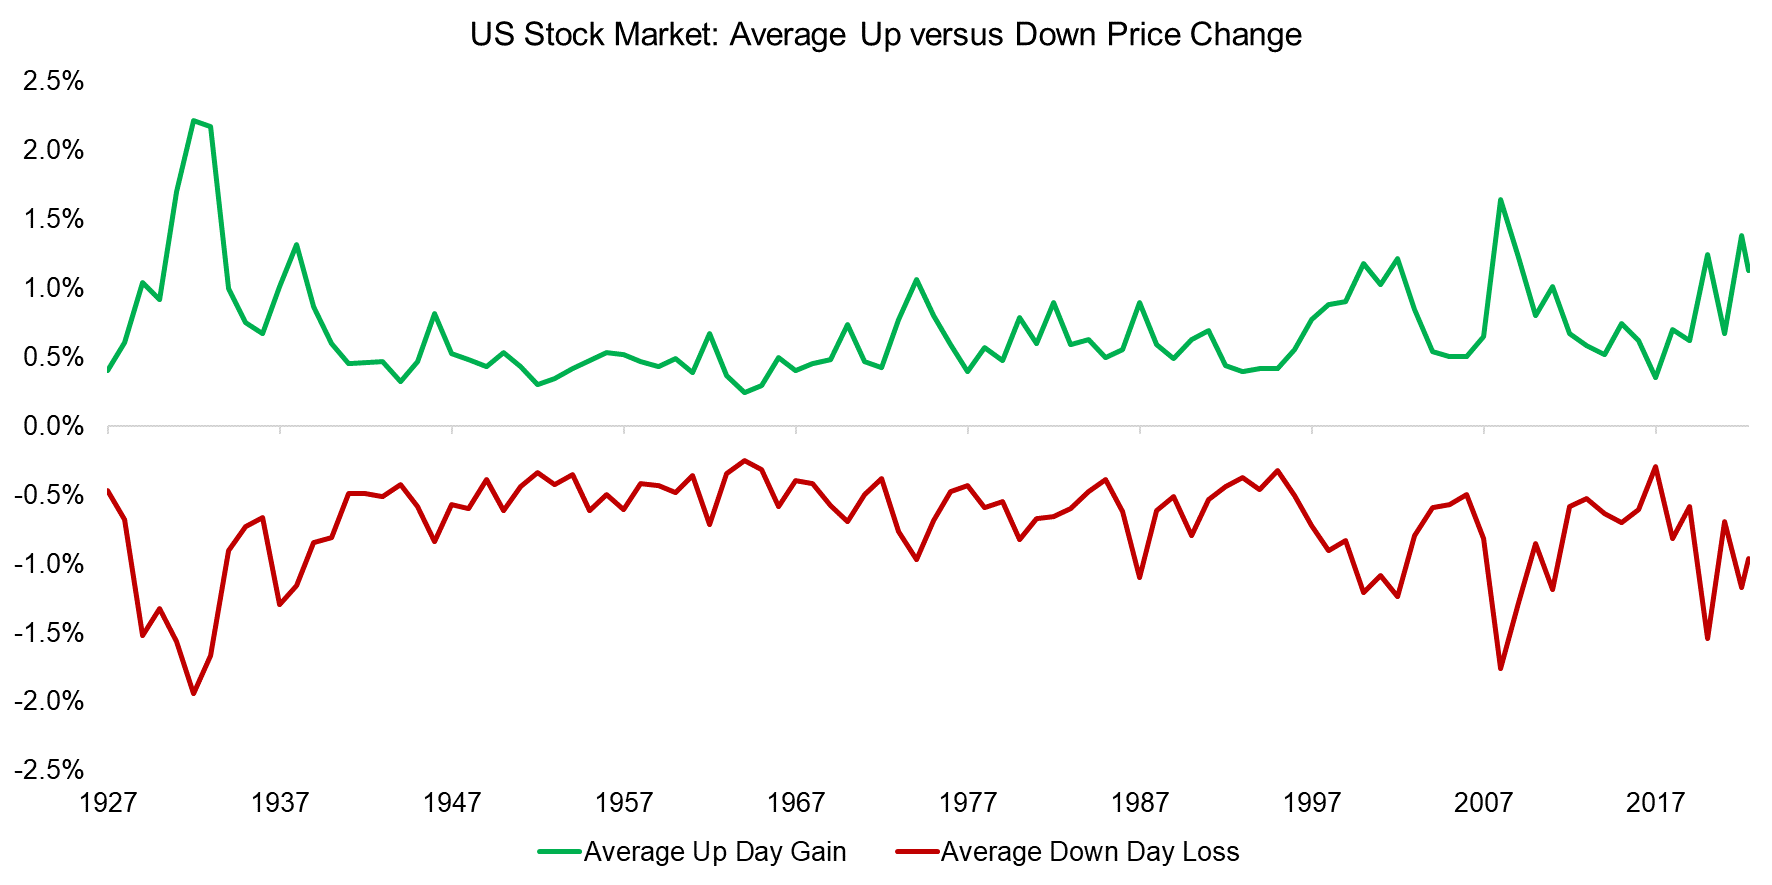
An alternative metric to stock market volatility is measuring the average price changes of the US stock market across time. However, this largely mirrors the volatility analysis as the average up and down changes were highest during the most recent decade, except for the 1930s.
Source: Finominal
INDUSTRY CORRELATIONS
So far we have analyzed the behavior of the entire stock market, which does not seem to suggest that it has changed structurally over the last century.
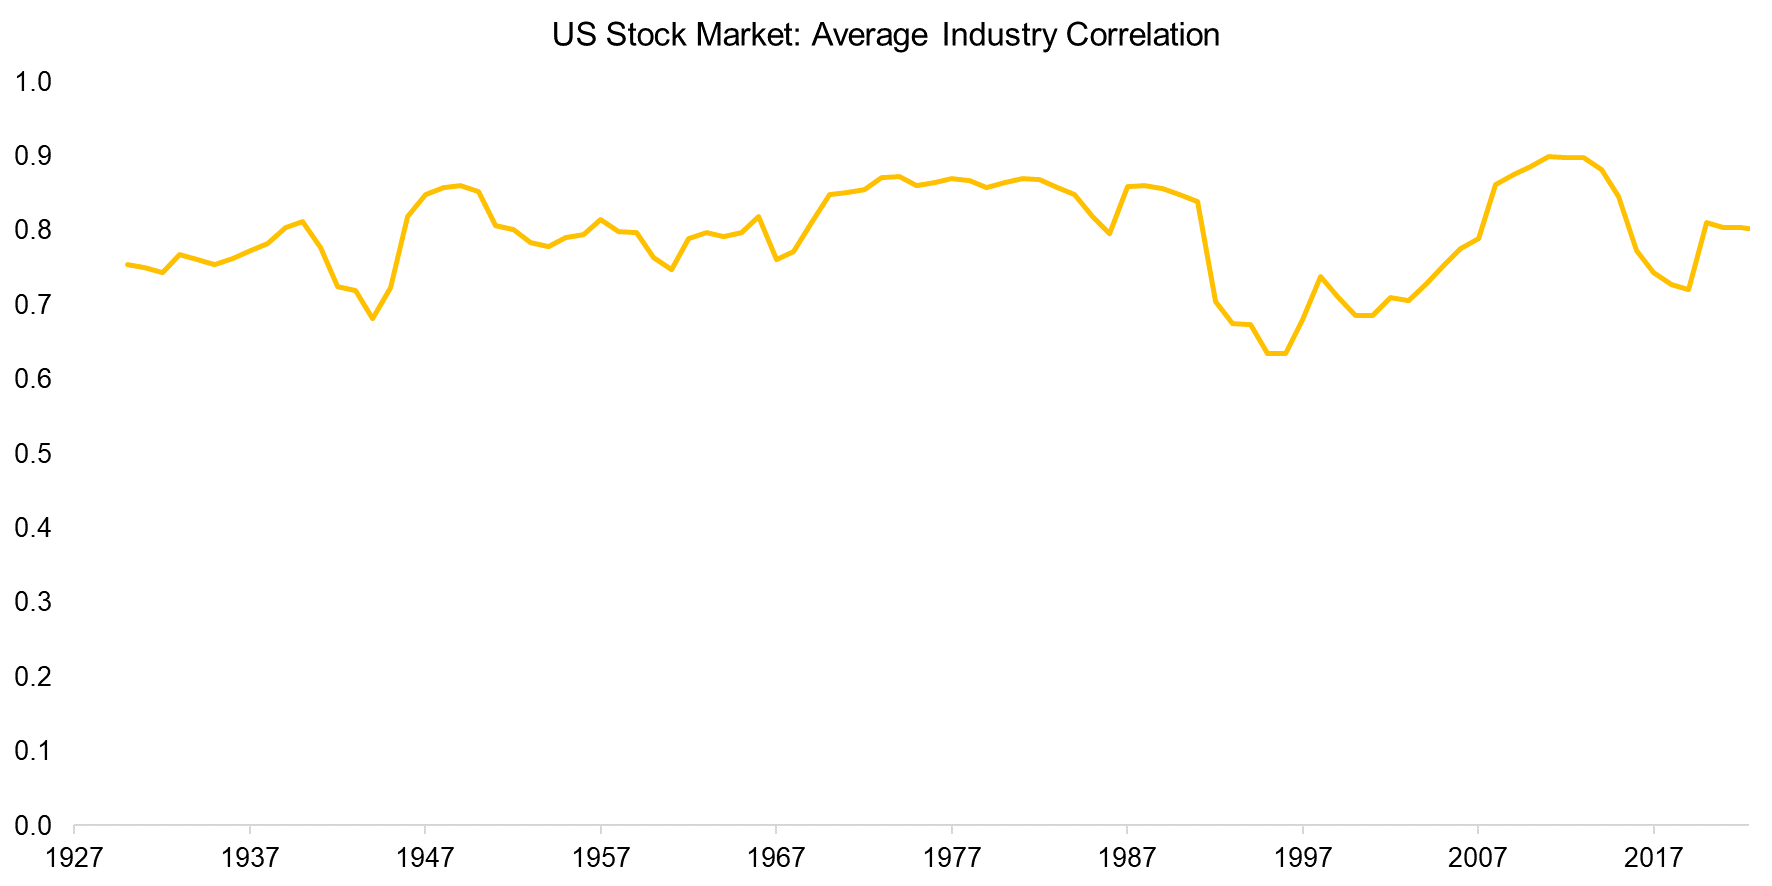
Next, we calculate the average correlation of all 49 industries available from the Kenneth R. French data library. We observe that industries of the US stock market were highly correlated at 0.8 between 1927 and 2023, and that this has not changed structurally.
Intuitively we might have expected that correlations would have increased parallel to the rise of passive investing as there might be less differentiation between individual stocks given that investors get exposure to diversified portfolios when they purchase ETFs (read Myth-Busting: ETFs Are Eating the World).
Source: Finominal
VOLATILITY OF SMALL VS LARGE CAPS
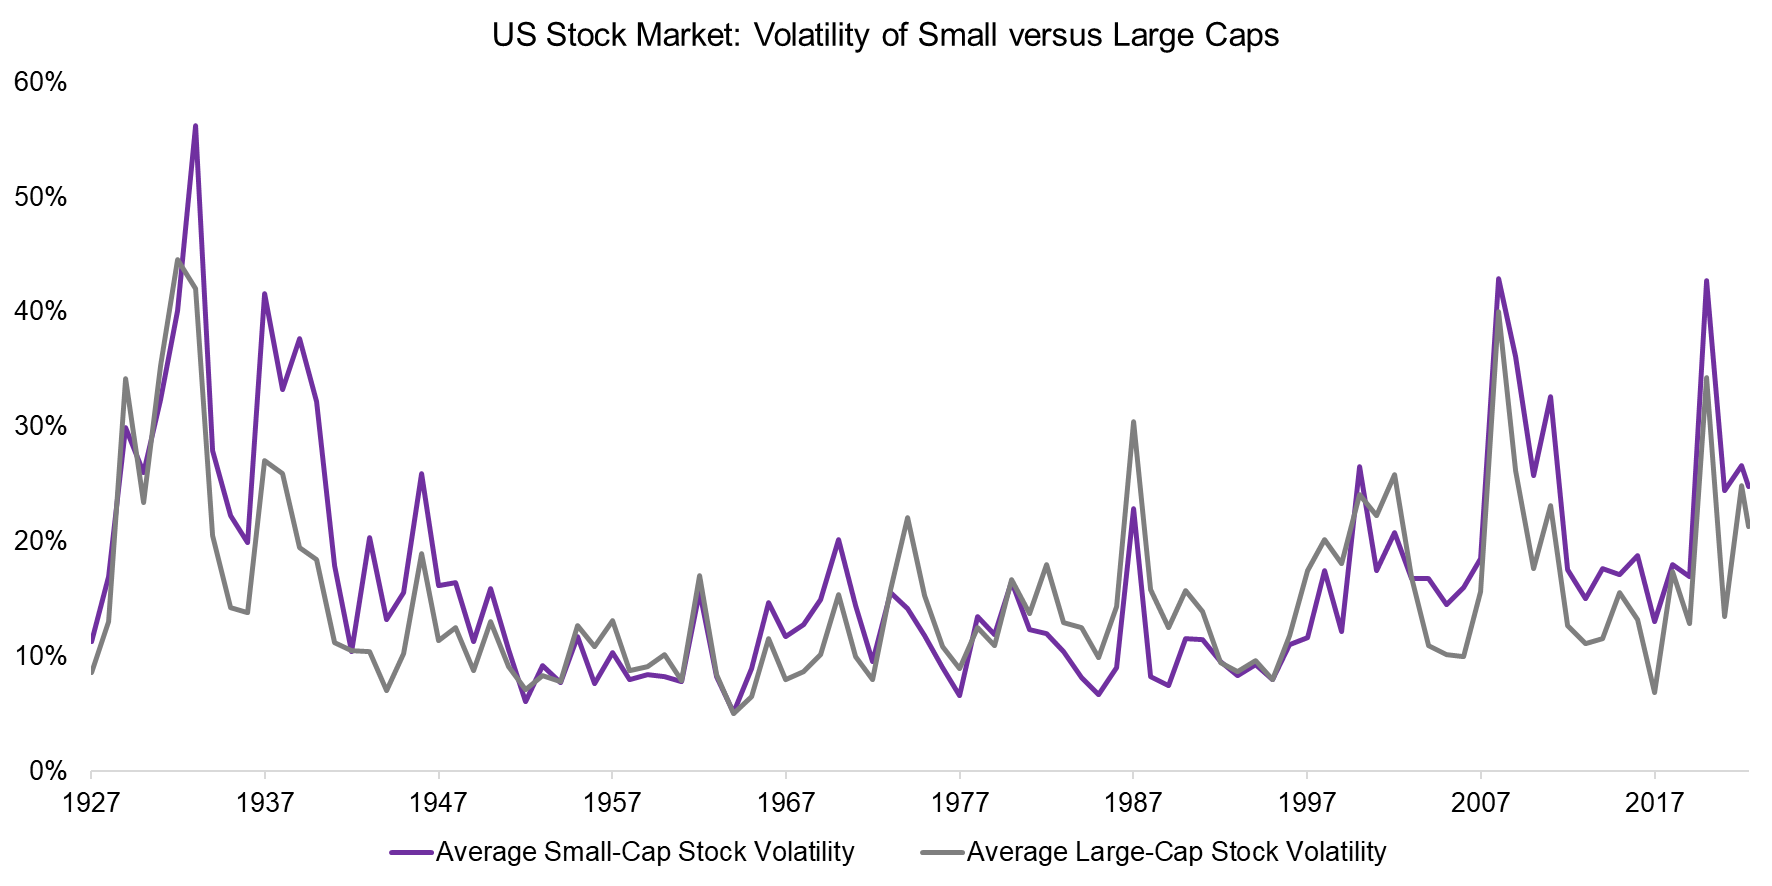
Passive investing is often criticized as giving more interest to large-cap stocks that belong to well-known benchmark indices like the S&P 500 than stocks excluded from these. There have been discussions about small-cap stocks getting less and less research analyst coverage and essentially being ignored by the investment community.
However, if that were the case, the small-caps should have become more volatile over the last decade, but that is not visible from the long-term data. The volatility of large and small-cap stocks has moved in tandem largely unchanged since the 1930s.
Source: Finominal
FURTHER THOUGHTS
There are many more ways of slicing and dicing the market structure of the US stock market, but these six macro-level data points do not indicate there have been any structural changes given the financial innovations of the recent decade.
Trading technology will continue to improve and make the trading of stocks and other securities easier, cheaper, and faster. However, it is questionable if we will ever become more rational and less emotional when investing. More knowledge and better technology do not seem to have been able to change our human nature, as evidenced by the recent bubbles in technology stocks and cryptocurrencies.
RELATED RESEARCH
Myth-Busting: ETFs Are Eating the World
The Mirage of Direct Indexing
Myth-Busting: The Economy Drives the Stock Market
Myth-Busting: Earnings Don’t Matter Much for Stock Returns
Outperformance Ain’t Alpha
Less Efficient Markets = Higher Alpha?
ABOUT THE AUTHOR
Nicolas Rabener is the CEO & Founder of Finominal, which empowers professional investors with data, technology, and research insights to improve their investment outcomes. Previously he created Jackdaw Capital, an award-winning quantitative hedge fund. Before that Nicolas worked at GIC and Citigroup in London and New York. Nicolas holds a Master of Finance from HHL Leipzig Graduate School of Management, is a CAIA charter holder, and enjoys endurance sports (Ironman & 100km Ultramarathon).
Connect with me on LinkedIn or X.

