Hedge Fund Factor Exposure & Alternatives
Alternatives to Alternative Investments?
November 2017. Reading Time: 10 Minutes. Author: Nicolas Rabener.
SUMMARY
- Equity hedge fund returns have been disappointing over the last 14 years
- An exposure analysis shows no structural factor exposure, but frequent factor rotation
- Multi-factor long-short products are an interesting alternative, depending on the fee level
INTRODUCTION
Hedge fund assets reached an all-time high in 2017 with $3.3 trillion under management. Although returns were muted in recent years, investors have an interest to hedge equity risk given high equity multiples, record levels of debt and political uncertainties. However, the future of hedge funds, specifically of equity hedge funds, can be considered somewhat less attractive. Similar to the disruption of the mutual fund industry by plain vanilla and smart beta ETFs, equity hedge funds are increasingly being replaced by systematic, cheap, and transparent factor products. However, it is questionable how effectively hedge funds can be replaced with long-short factor products. In this short research note we will analyse the factor exposure of equity hedge funds and compare the performance to a multi-factor long-short portfolio.
METHODOLOGY
We focus on the HFRX Equity Long / Short Index (Equity Hedge), HFRX Equity Market Neutral Index and the following factors: Value, Size, Momentum, Low Volatility, Quality and Growth. The factors are constructed as beta-neutral long-short portfolios by taking the top and bottom 10% of the US stock universe and include 10 bps of transaction costs (read Factor Construction: Beta vs $-Neutrality). The factor exposure analysis is a simple regression analysis with a one-year lookback.
HEDGE FUND PERFORMANCE
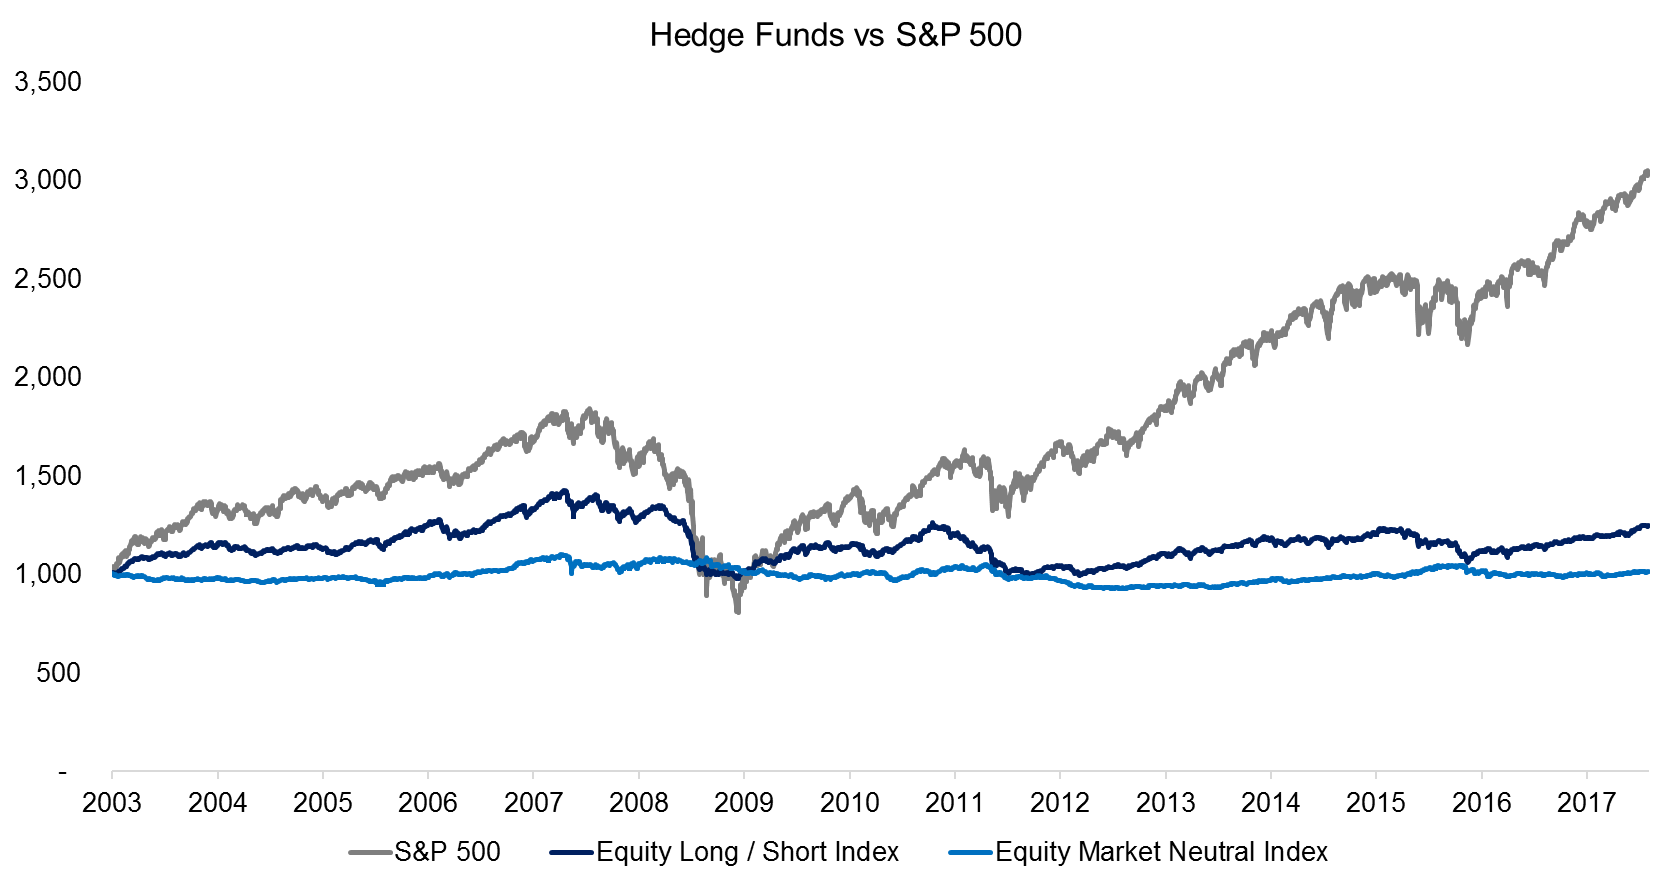
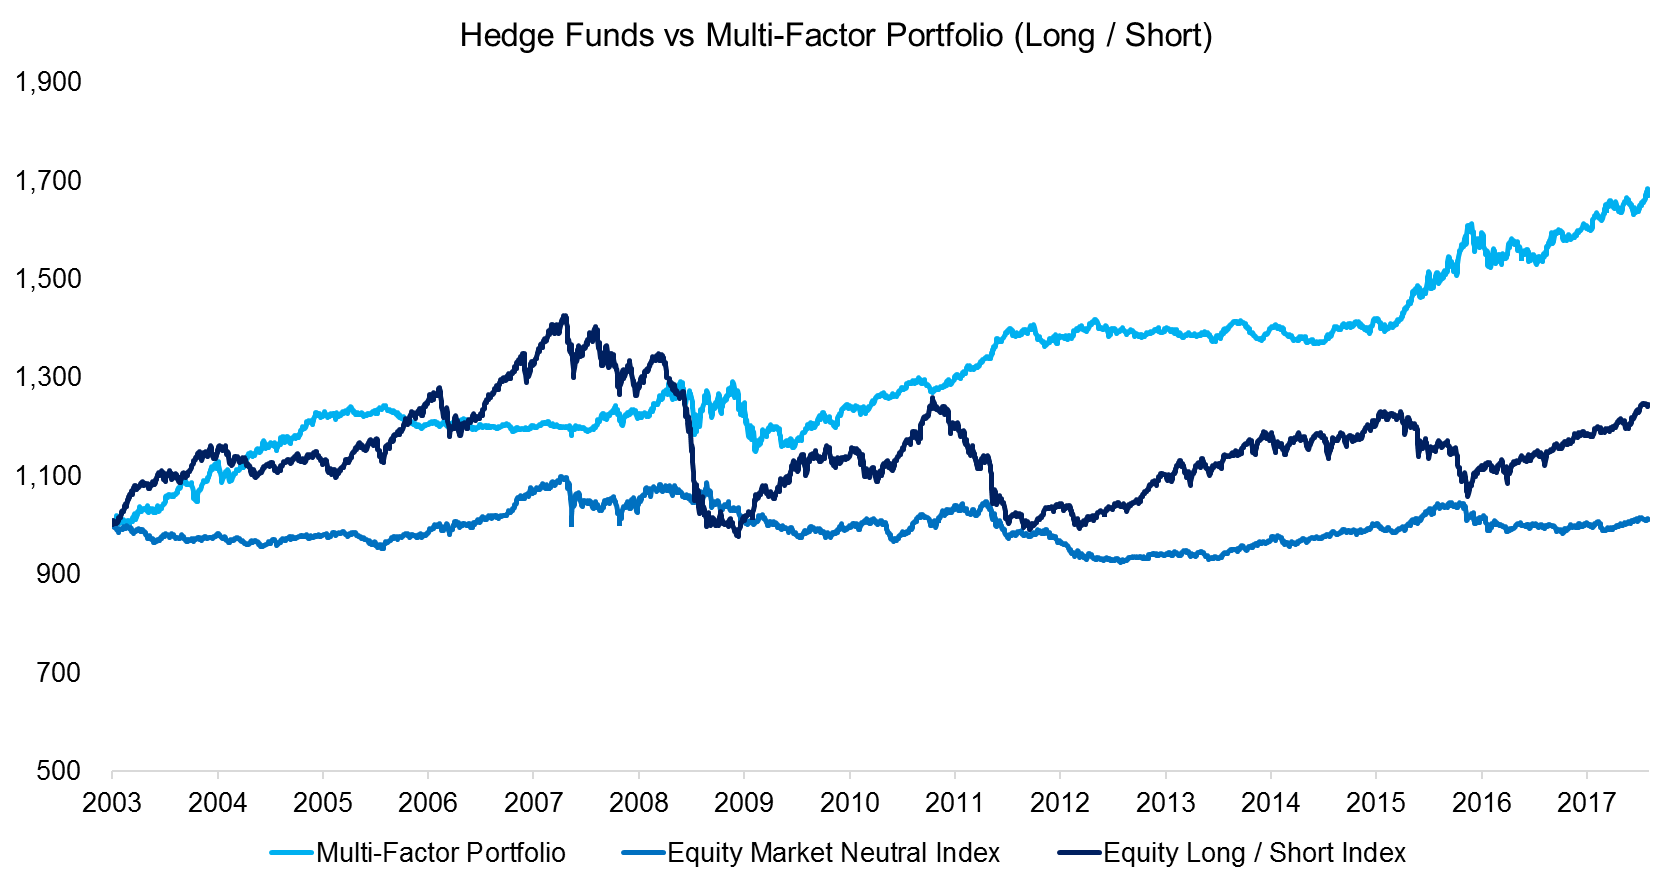
Before we start analysing the factor exposure of equity hedge funds it is worth highlighting the performance of both indices. We contrast the performance to the S&P 500, which should not be considered as a benchmark for hedge funds, but merely serve as a reference point for the market cycle. We can observe that the Equity Long / Short Index, which tends to have some market exposure, generated a total return of 24.5% from 2003 to 2017 (1.5% pa); a somewhat disappointing performance given that this return is before inflation. The Equity Market Neutral Index, which has no market exposure, generated total return of 1.1% over the 14-year period (0.1% pa), which highlights the difficult nature of generating alpha and the impact of high fees.
Source: FactorResearch, HFRX
FACTOR EXPOSURE OF HEDGE FUNDS
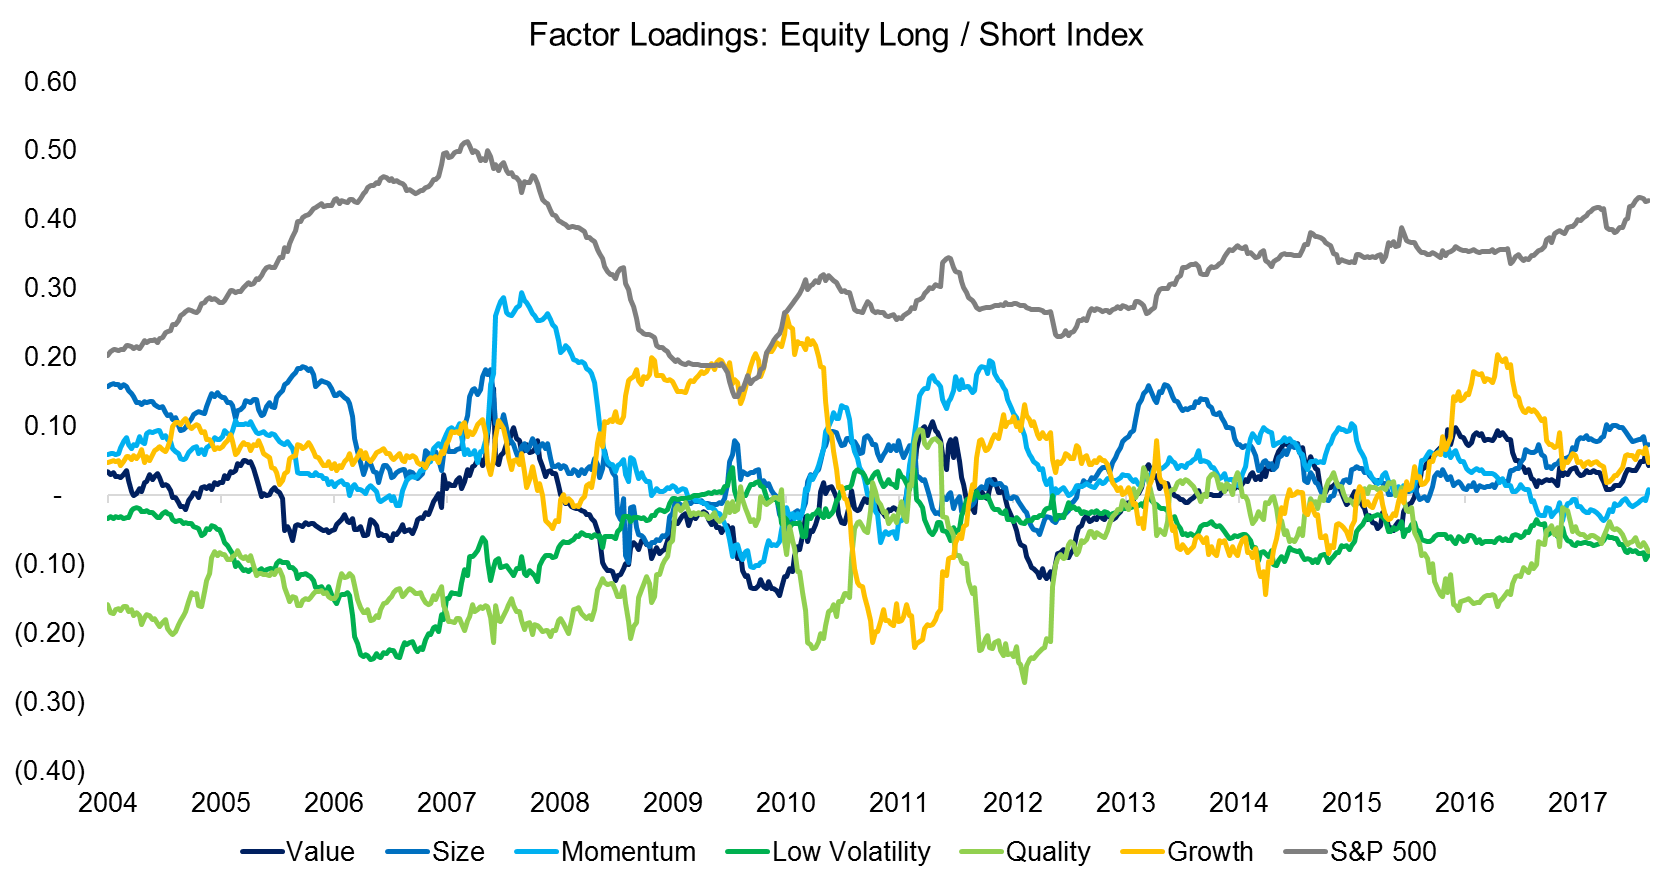
The next chart shows the factor loadings of the Equity Long / Short Index. We can observe that most of the returns can be explained by the S&P 500, which is to be expected given that these hedge funds do have significant market exposure. Interestingly we can observe no structural bias towards one factor over time, e.g. Value, but seemingly a frequent factor rotation. The hedge fund managers likely positioned their portfolios towards their view of the economic cycle, where they believed single stocks or sectors were expected to generate alpha versus trying to systematically harvest factor returns.
Source: FactorResearch, HFRX
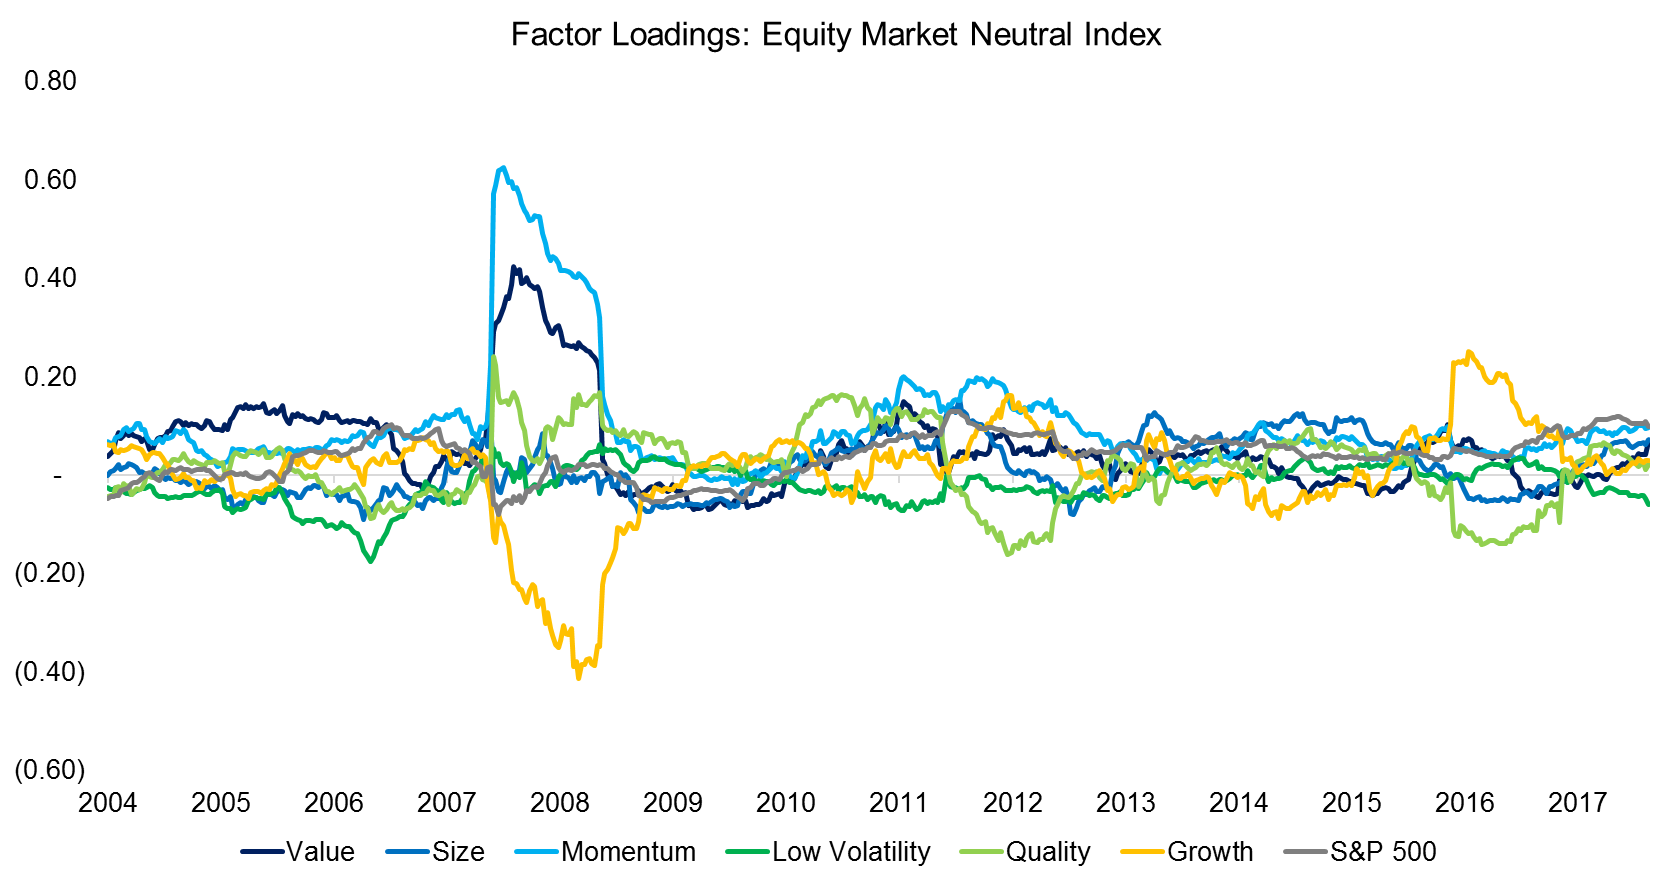
The next chart shows the factor exposure of the Equity Market Neutral Index. Given that these hedge fund managers are mandated to have low or zero market exposure, we can see the S&P 500 plays no role in terms of explaining the returns. Similar to the Equity Long / Short Index we can also not observe any structural bias towards one factor. However, we can clearly identify the quant crash of August 2007, which highlights that the managers had positive exposure to the Value and Momentum factors and negative exposure to the Growth factor (read Factors: Correlation Check).
Source: FactorResearch, HFRX
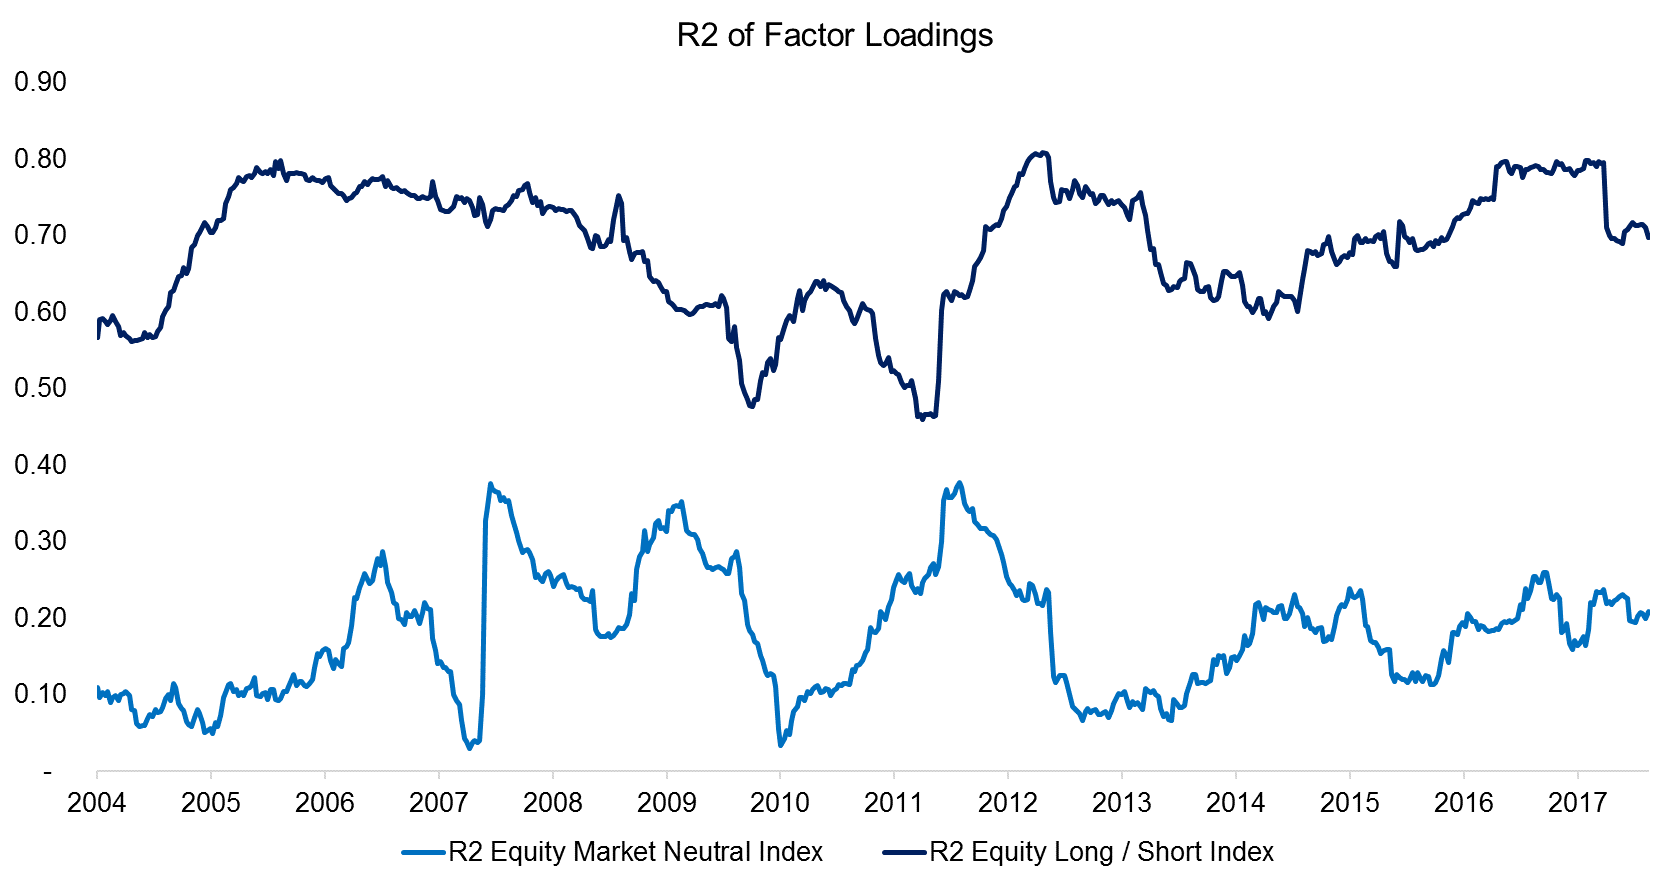
Our factor exposure analysis is based on a simple one-year regression and the chart below shows the R2 over time. We can observe that the R2 for the Equity Long / Short Index is significant in terms of explaining the returns, while the analysis is less meaningful for explaining the returns of the Equity Market Neutral Index.
Source: FactorResearch, HFRX
HEDGE FUNDS VS MULTI-FACTOR PORTFOLIO (LONG / SHORT)
Next we contrast the performance of the hedge fund indices to a multi-factor portfolio, which is created by equally-weighting the Value, Size, Momentum, Low Volatility, Quality and Growth factors. It is worth noting that this factor combination should not be considered as an optimal factor portfolio, but merely as one alternative. We can observe that the multi-factor portfolio outperforms both hedge fund indices significantly and has less resemblance to the S&P 500 than the Equity Long / Short Index.
Source: FactorResearch, HFRX
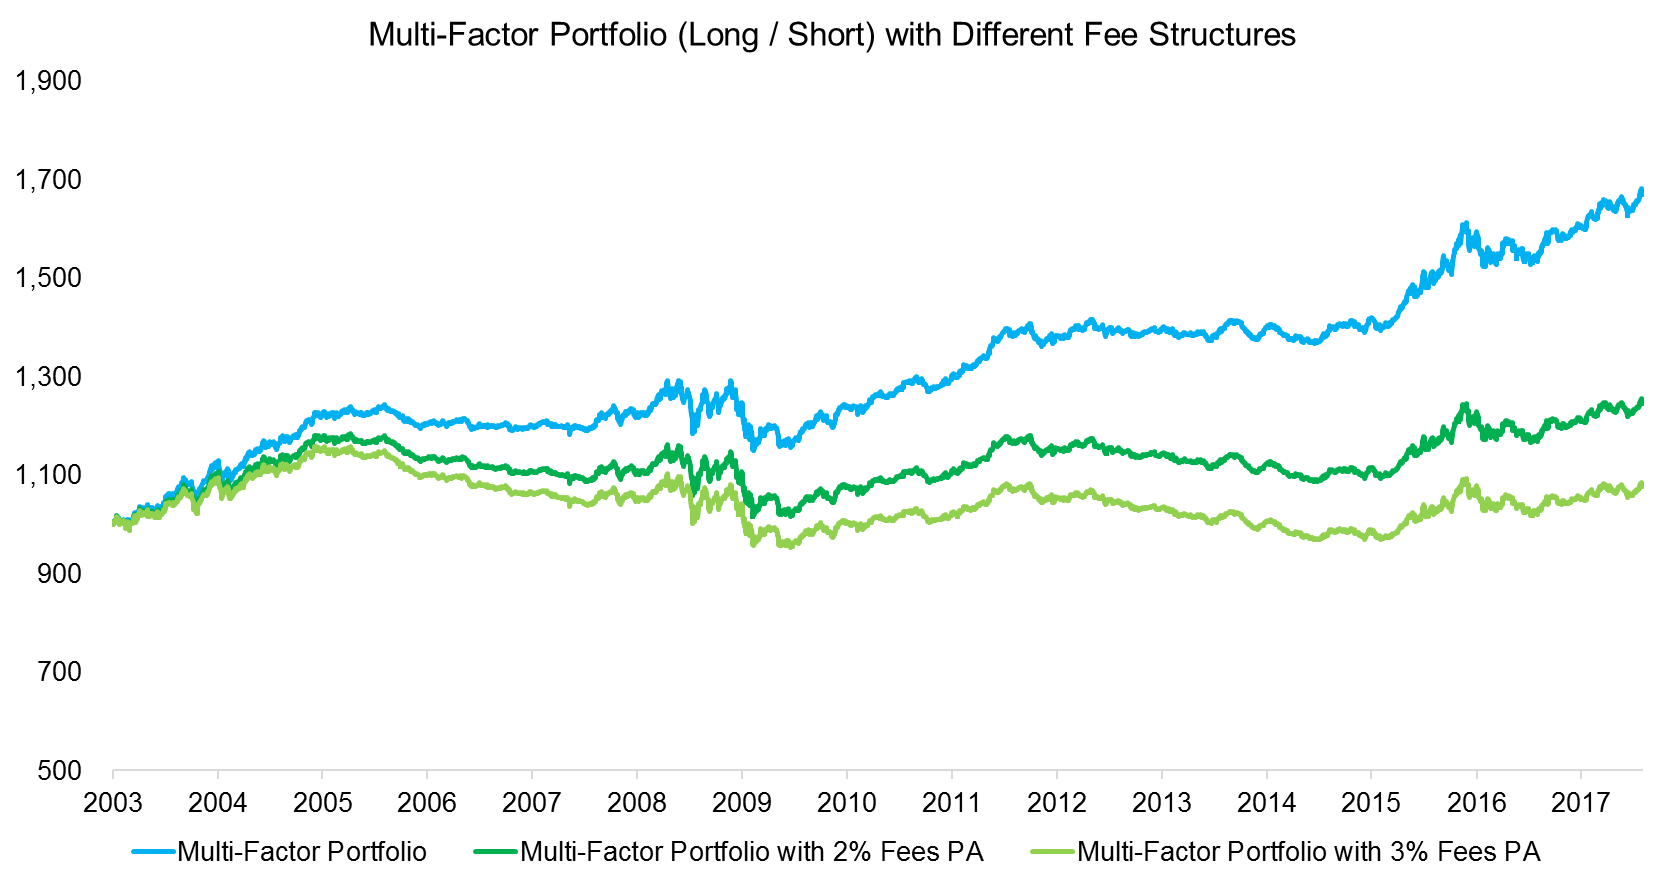
Although the performance of the multi-factor portfolio factor looks attractive compared to the hedge fund indices, the comparison is not fair given that no management fees, performance fees, or fund expenses aside from transaction costs are included. If we would include fees, then the performance would look far less attractive, as we can see in the chart below.
Source: FactorResearch
FURTHER THOUGHTS
This short research note highlights that long / short and equity market neutral hedge funds don’t exhibit any structural factor exposure, but seem to rotate factors frequently. We also highlight the lack of performance over the last 14 years, where factor products might be an interesting alternative; however, it will likely very much depend on the fees being charged.
ABOUT THE AUTHOR
Nicolas Rabener is the CEO & Founder of Finominal, which empowers professional investors with data, technology, and research insights to improve their investment outcomes. Previously he created Jackdaw Capital, an award-winning quantitative hedge fund. Before that Nicolas worked at GIC and Citigroup in London and New York. Nicolas holds a Master of Finance from HHL Leipzig Graduate School of Management, is a CAIA charter holder, and enjoys endurance sports (Ironman & 100km Ultramarathon).
Connect with me on LinkedIn or X.

