How Much Should You Allocate to Managed Futures?
10%! More? 20%! More? 30%! Even More?
January 2025. Reading Time: 10 Minutes. Author: Nicolas Rabener.
SUMMARY
- CTAs have achieved equities-like returns over the long-term
- They are excellent diversifiers given low correlations to equities
- An optimal allocation would be more than 50% within an equities portfolio
INTRODUCTION
In December 2024, BlackRock filed a draft prospectus for the iShares Managed Futures Active ETF, aiming to tap into investor demand fueled by the strong performance of CTAs over the past five years. Although BlackRock’s entry follows earlier launches by firms like AlphaSimplex and MAN AHL, ETF assets in this space remain modest at under $3 billion. In contrast, the broader CTA industry manages around $340 billion as of Q3 2024, according to BarclayHedge, indicating substantial growth potential for low-cost ETFs.
Despite their appeal, managed futures often carry a perception of being “black-box” strategies, which can make some investors uneasy. However, as demonstrated in our previous research, these strategies simply employ trend-following across various asset classes and are relatively straightforward to replicate (read Replicating a CTA via Factor Exposures and Creating a CTA from Scratch – II).
The true attraction of managed futures lies in their flexibility—allowing investors to admit uncertainty about the direction of interest rates, inflation, commodities, currencies, or equities, while still capturing returns whether markets rise or fall.
While extensive research supports their value as diversifying tools, there is limited guidance on how much investors should allocate to them—a topic we explore further in this article.
LONG-TERM PERFORMANCE OF MANAGED FUTURES
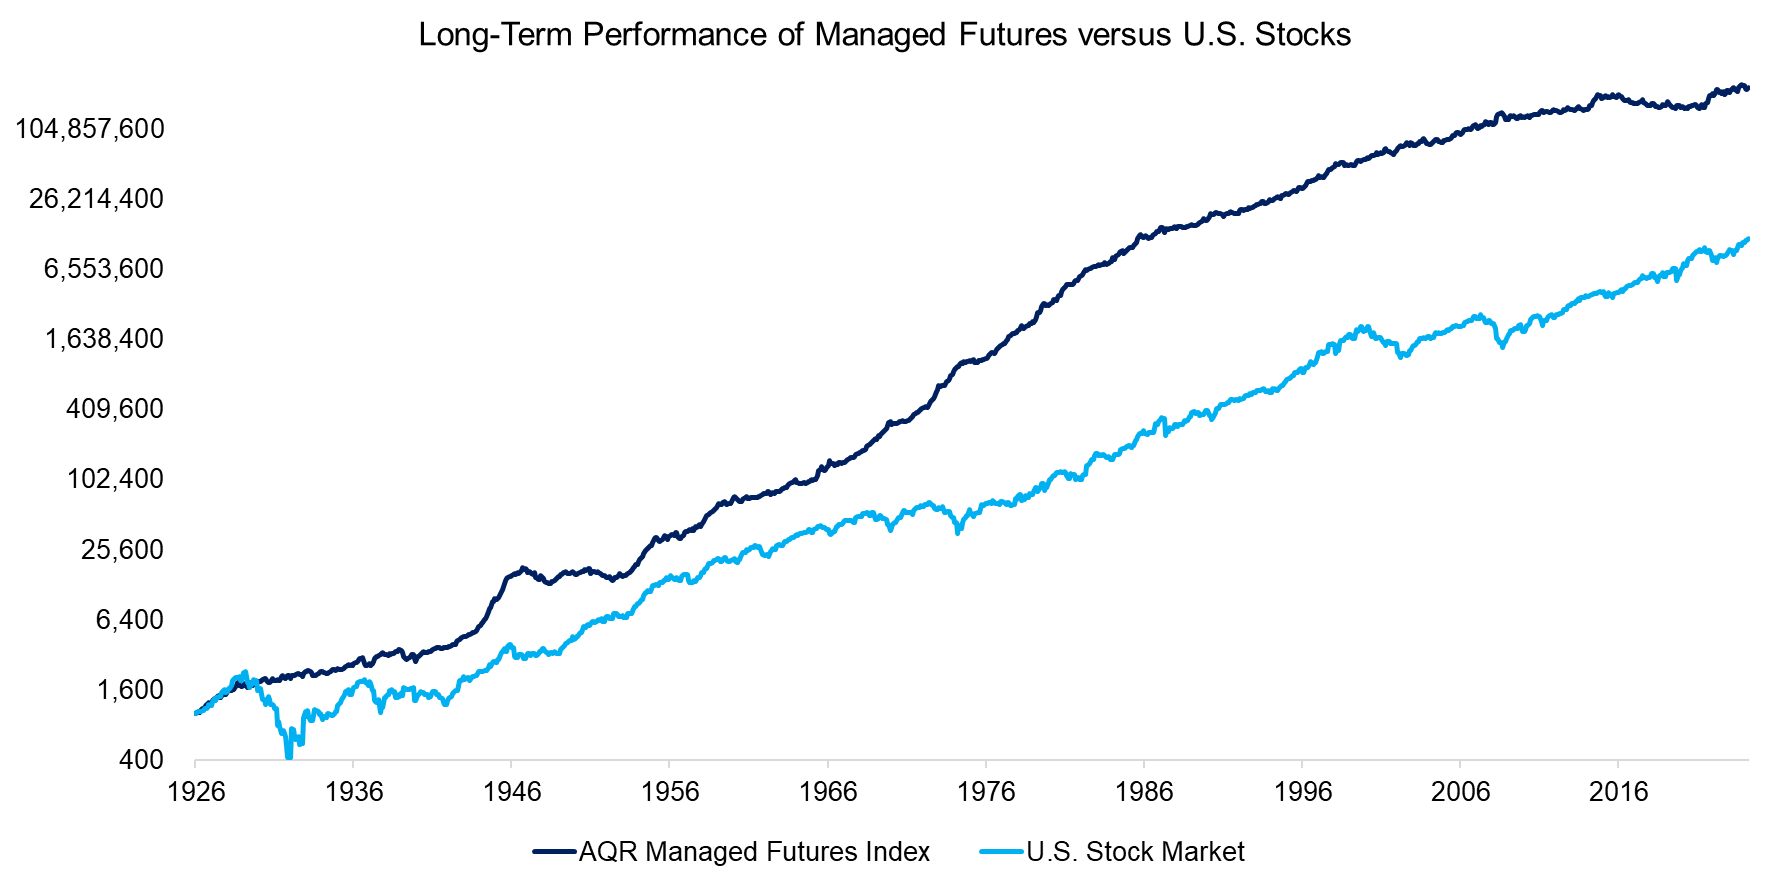
Using data from AQR, we analyze the performance of managed futures from 1926 to 2024, covering nearly a century. Returns from 1926 to 2013 are based on a backtest by AQR and should be interpreted with caution that applies to all backtests, while post-2013 performance reflects actual returns from AQR’s Managed Futures Strategy Fund (AQMIX).
Our findings show that the AQR Managed Futures Index outperformed U.S. stocks over the entire period, primarily due to its ability to avoid significant losses during major economic crises, such as the Great Depression in the 1930s and the global financial crisis in 2008.
Source: AQR, Finominal
CORRELATION BETWEEN MANAGED FUTURES AND EQUITIES
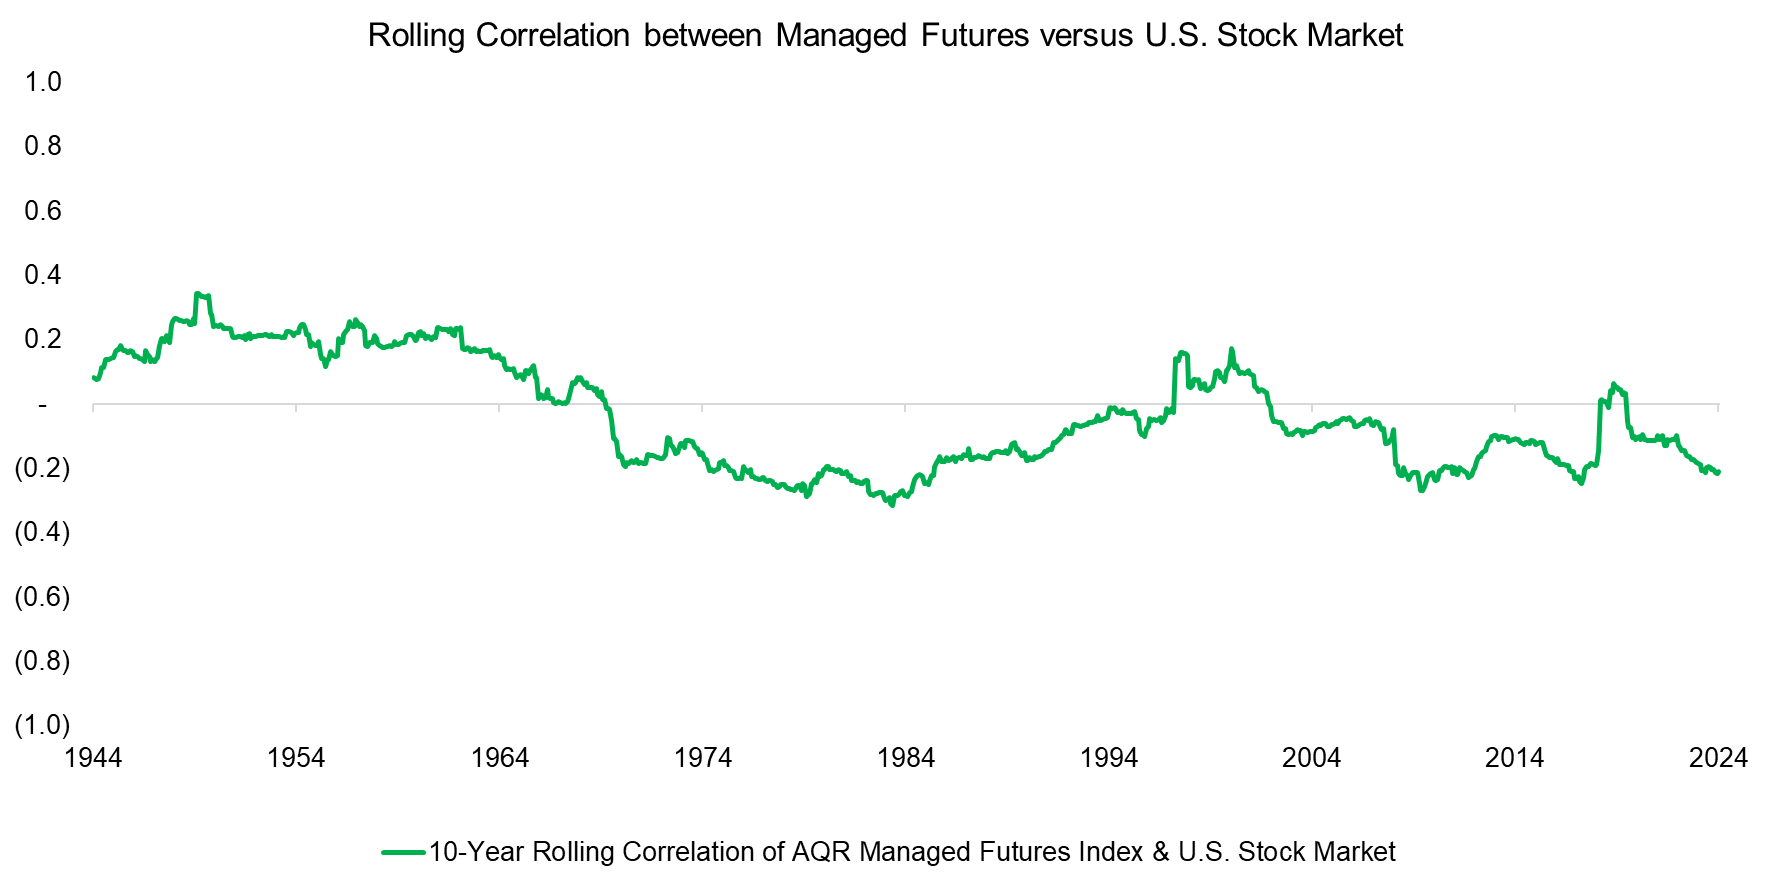
Since CTAs seek to capitalize on both upward and downward trends across various asset classes, their portfolios typically exhibit low correlations with equities. Analyzing the 10-year rolling correlation between managed futures and the U.S. stock market reveals a near-zero correlation, underscoring their appeal as a diversification tool.
Source: AQR, Finominal
MANAGED FUTURES VERSUS EQUITIES RETURNS
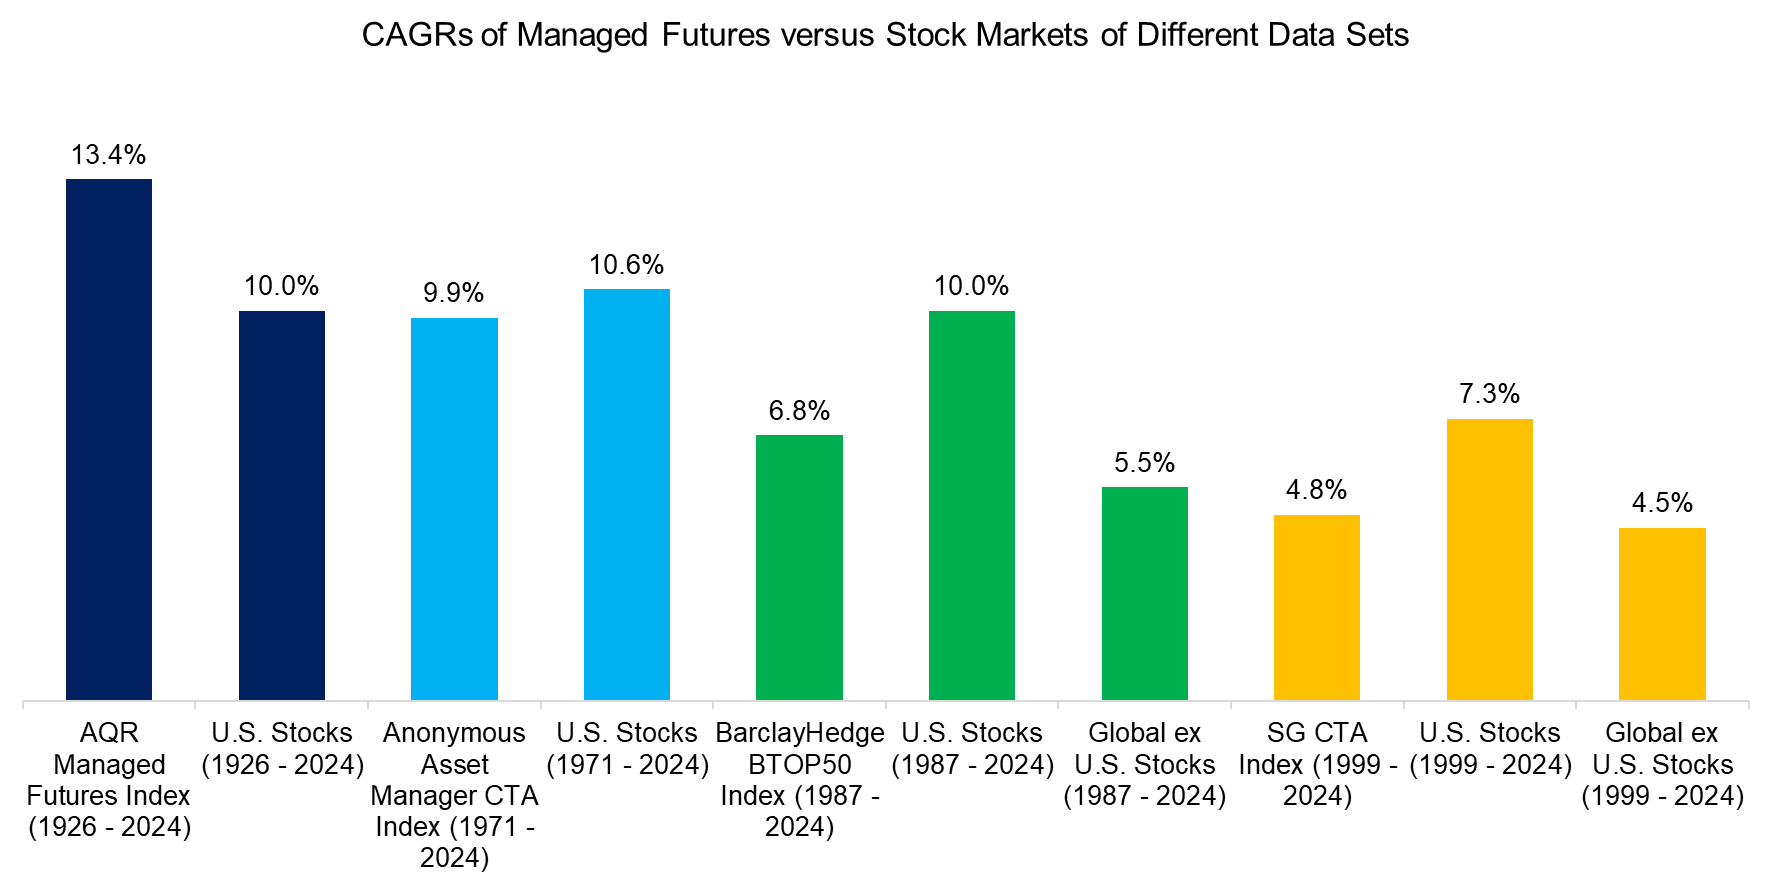
Many investors may find it surprising that the AQR Managed Futures Index outperformed U.S. stocks over the last century, which may be explained by the index largely representing a backtest.
We review three other data sets of managed futures returns, one representing another backtest, albeit from a different asset manager, and two representing indices of managed futures funds, namely the BarclayHedge BTOP50 Index and SG CTA Index.
These datasets cover varying time periods, and while U.S. stocks generally outperformed managed futures, this trend does not hold when comparing to global stocks excluding the U.S. Notably, if the most recent decade – characterized by unusually high returns for U.S. equities – is excluded, the performance gap between managed futures and U.S. stocks narrows significantly.
Source: AQR, BarclayHedge, SG, Finominal
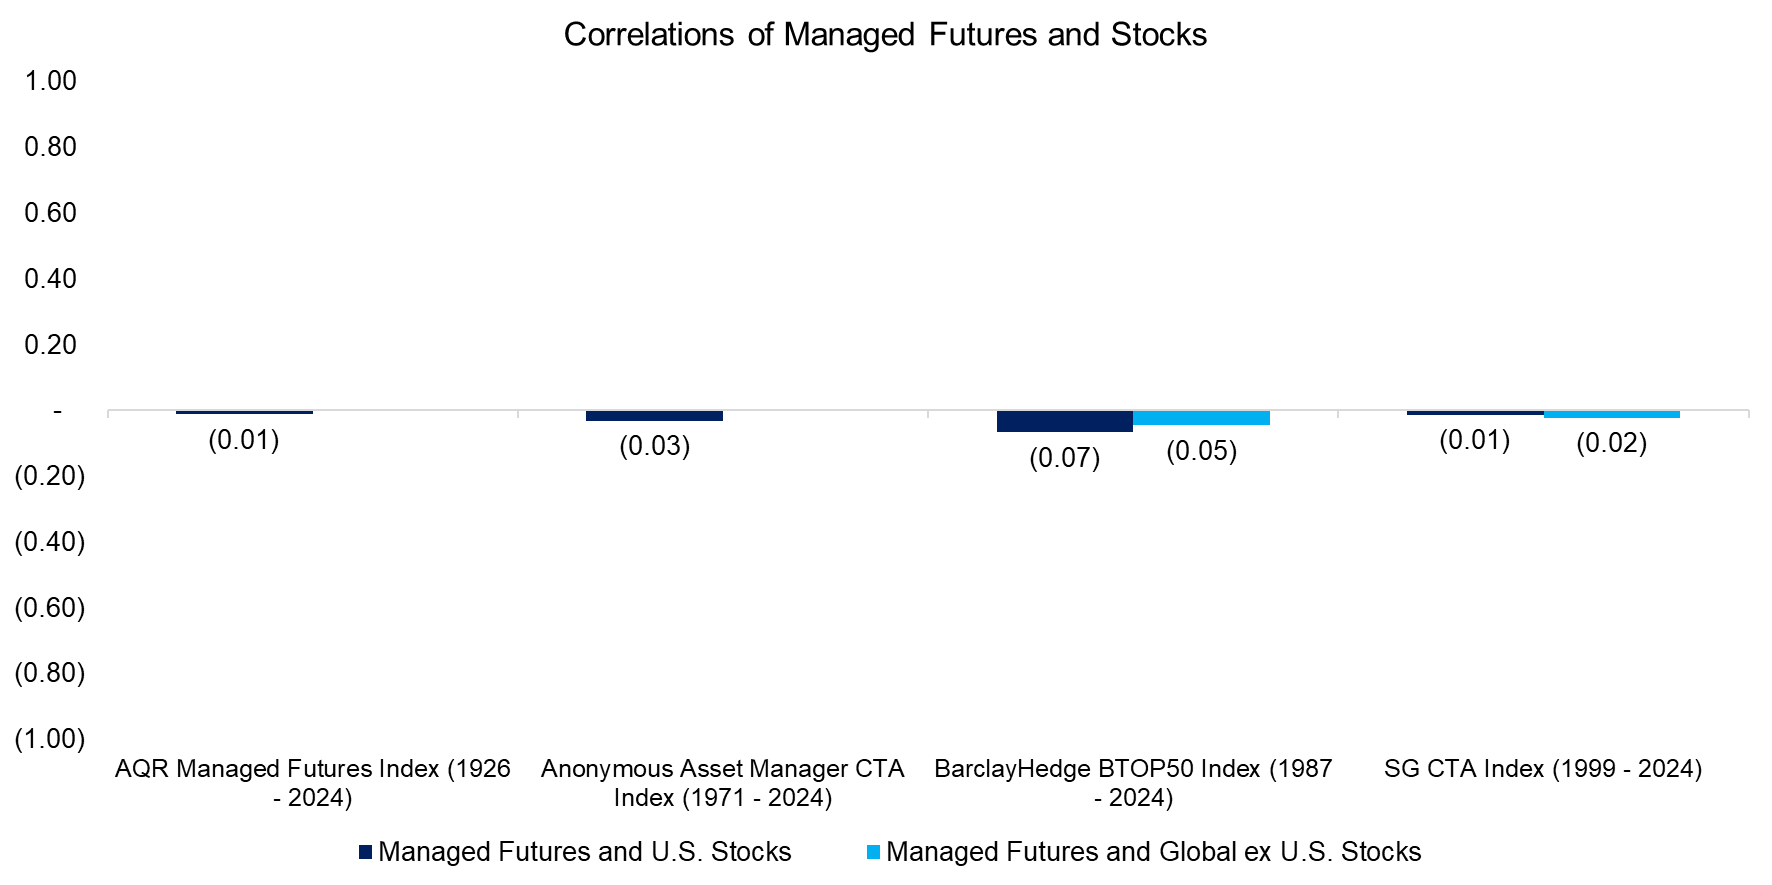
The correlations among these four datasets range from 0.5 to 0.7, reflecting differences in the underlying universes and methodologies used for security selection. Despite these variations, their correlations with U.S. and global ex-U.S. stocks remain close to zero, reinforcing the role of managed futures as effective diversification strategies.
Source: AQR, BarclayHedge, SG, Finominal
OPTIMAL ALLOCATION TO MANAGED FUTURES
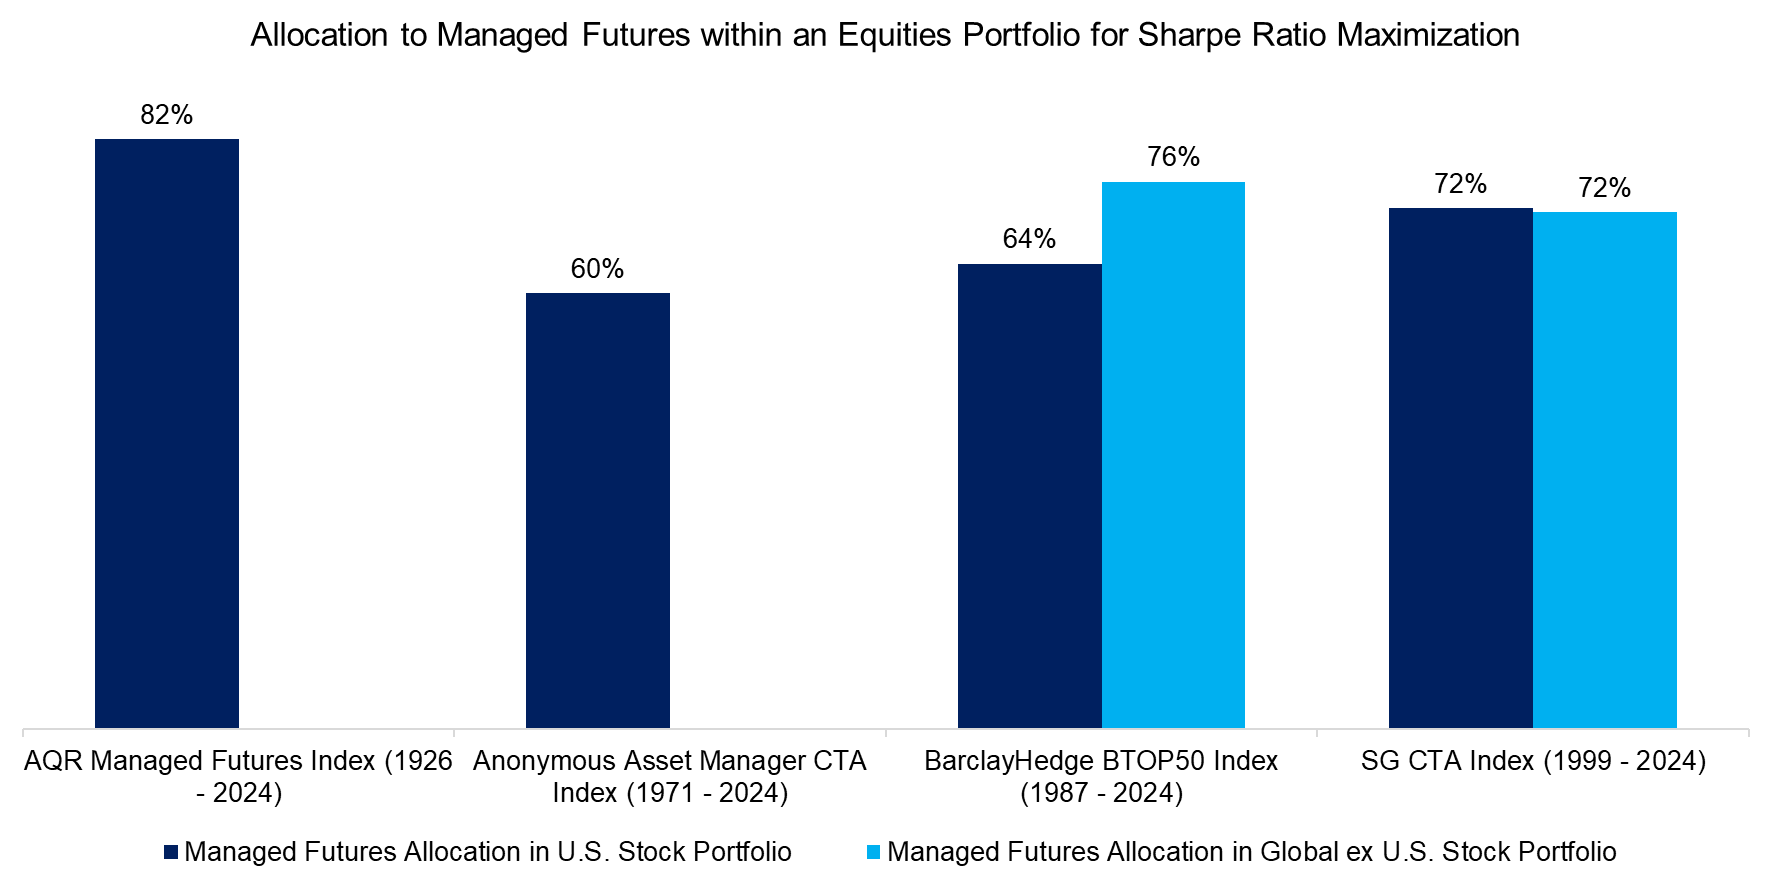
We calculate the optimal allocations to managed futures by optimizing for maximum Sharpe ratios. While such optimizations should be approached with caution due to potential discrepancies between in-sample and out-of-sample performance, the long lookback periods and multiple data sets lend greater credibility to these results.
Our analysis suggests that the optimal allocation to managed futures within equity portfolios ranges from 60% to 82%. While the 82% allocation, based on the AQR dataset, can be slightly discounted due to its reliance on backtested data, the 72% allocation derived from the SG CTA Index is more compelling, as it tracks actual CTA funds and represents an investable index.
Source: AQR, BarclayHedge, SG, Finominal
FURTHER THOUGHTS
According to JP Morgan, the total market capitalization of global equities stands at $81.7 trillion as of the fourth quarter of 2024, while the managed futures industry oversees just $340 billion. This suggests significant growth potential for managed futures ETFs.
While few investors are likely to allocate more than half of their portfolios to CTAs, such a strategy offers a unique sense of security. Factors like politics, economic shifts, natural disasters, or minor conflicts become less concerning, as the portfolio continuously adjusts to capitalize on emerging trends – no matter their origin. As the saying goes in the CTA industry: “Let the trend be your friend.”
RELATED RESEARCH
Combining Risk-Managed Equities and Managed Futures
Managed Futures versus Market-Neutral Multi-Factor Investing
Factor Investing Is Dead, Long Live Factor Investing!
CTAs: With or Without Trend Following in Equities?
Bonds versus CTAs for Diversification
Carry versus Trend Following
Trend Following in Equities
Trend Following in Bear Markets
Replicating a CTA via Factor Exposures
Creating a CTA from Scratch – II
CTAs vs Global Macro Hedge Funds
Managed Futures: The Empire Strikes Back
Managed Futures: Fast & Furious vs Slow & Steady
Hedging via Managed Futures Liquid Alts
ABOUT THE AUTHOR
Nicolas Rabener is the CEO & Founder of Finominal, which empowers professional investors with data, technology, and research insights to improve their investment outcomes. Previously he created Jackdaw Capital, an award-winning quantitative hedge fund. Before that Nicolas worked at GIC and Citigroup in London and New York. Nicolas holds a Master of Finance from HHL Leipzig Graduate School of Management, is a CAIA charter holder, and enjoys endurance sports (Ironman & 100km Ultramarathon).
Connect with me on LinkedIn or X.

