Impact of Lookback Period on Momentum Factor
What is the optimal lookback period?
November 2025. Reading Time: 10 Minutes. Author: Nicolas Rabener.
SUMMARY
- Momentum can be measured over various lookback periods
- The optimal lookback remains between six and 12 months
- Likely explained by human behavior
INTRODUCTION
Most fund managers are skeptical of the momentum factor because selecting stocks based on it requires little expertise – a spreadsheet and basic math often suffice. As a result, charging high fees for fund pursuing a momentum-based portfolio is challenging.
Yet, the substantial body of research demonstrating attractive excess returns from momentum cannot be ignored. One way to add value is by creating a more sophisticated version of the factor, for example, by measuring momentum through Sharpe ratios, alpha, or a combination of multiple metrics (read Momentum Variations and Improving the Momentum Factor).
Another approach is to adjust the standard 12-month lookback period. Winners could be held longer, or shorter lookbacks could be used, reflecting lower transaction costs and the market’s increasing short-term focus.
In this article, we will examine how the momentum factor’s performance depends on the choice of lookback period.
LOOKBACK SENSITIVITY OF THE MOMENTUM FACTOR
We focus on the U.S. stock market, defining the investable universe as all stocks with market capitalizations above $1 billion. For the long-short portfolio, we select the top 10% of best-performing and bottom 10% of worst-performing stocks, constructing it beta-neutral. For the long-only portfolio, we include only the top-performing stocks and calculate excess returns by subtracting the market return. Stocks are equally weighted and rebalanced monthly, accounting for transaction costs of 10 basis points.
Traditionally, momentum is measured as total return over the past 12 months, excluding the most recent month. In this study, we ignore that exclusion to evaluate very short lookbacks, noting that there is little difference between the standard 12-month measure and the exclusion-adjusted version.
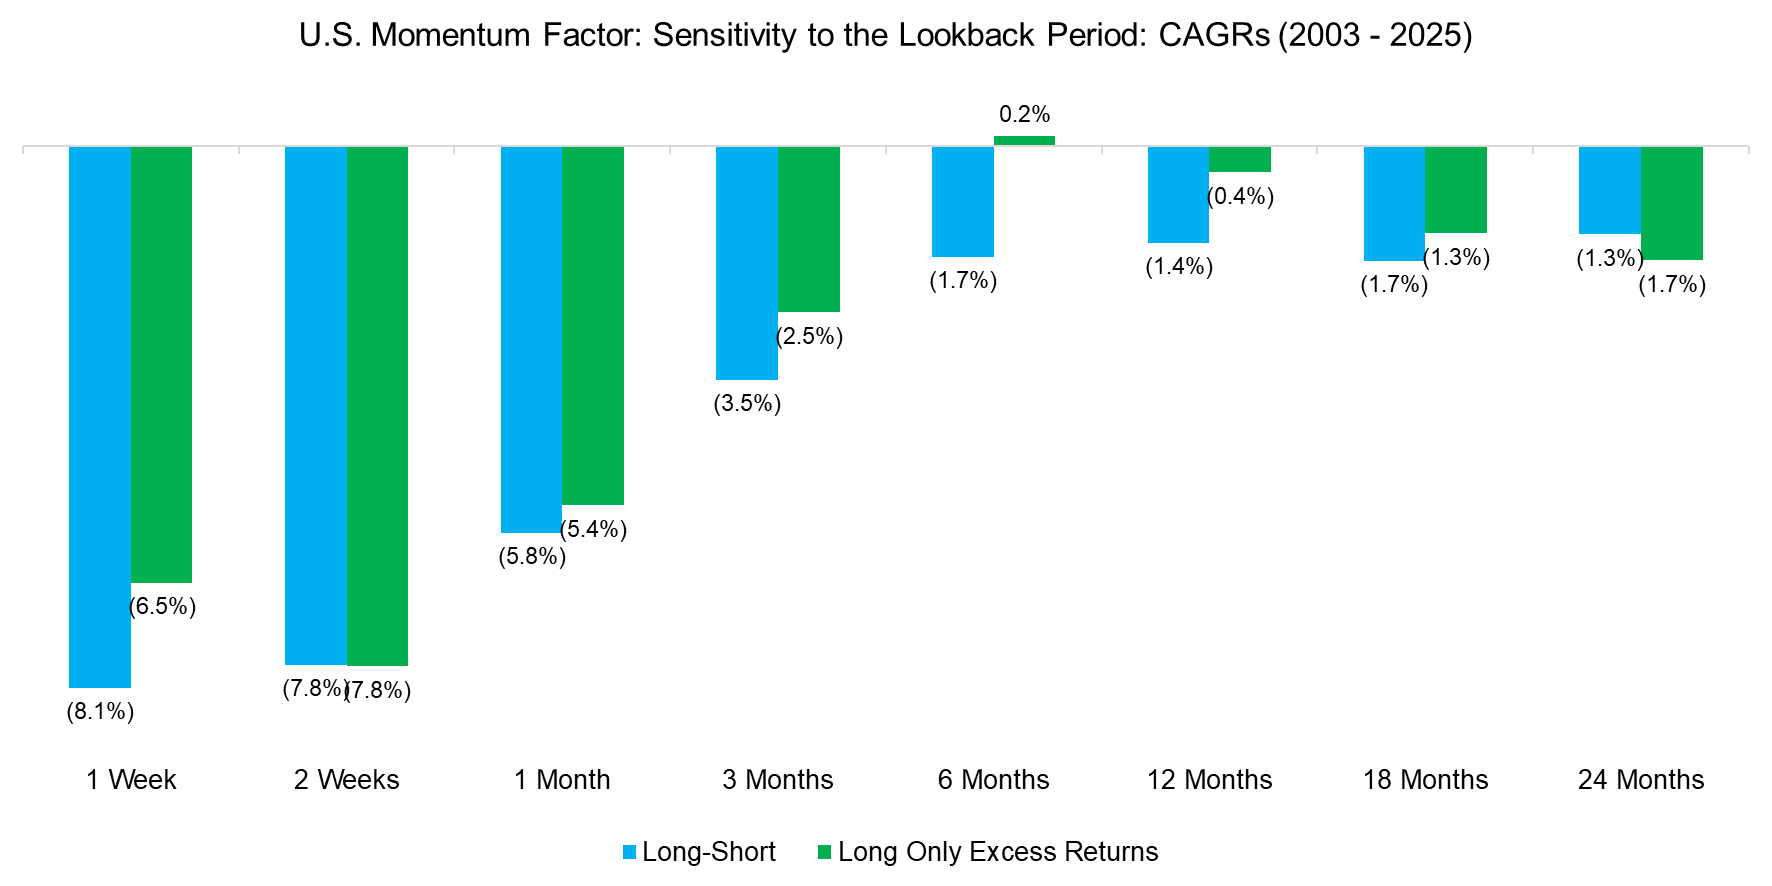
We compute the CAGRs of the long-short and long-only excess return momentum indices. The results reveal an inverted smile, with predominantly negative returns between 2003 and 2025. The best lookback was between six and 12 months, while having a shorter or longer lookback reduced the return significantly. Overall, momentum investing has been unrewarding over the past two decades.

Source: Finominal
MOMENTUM CRASHES
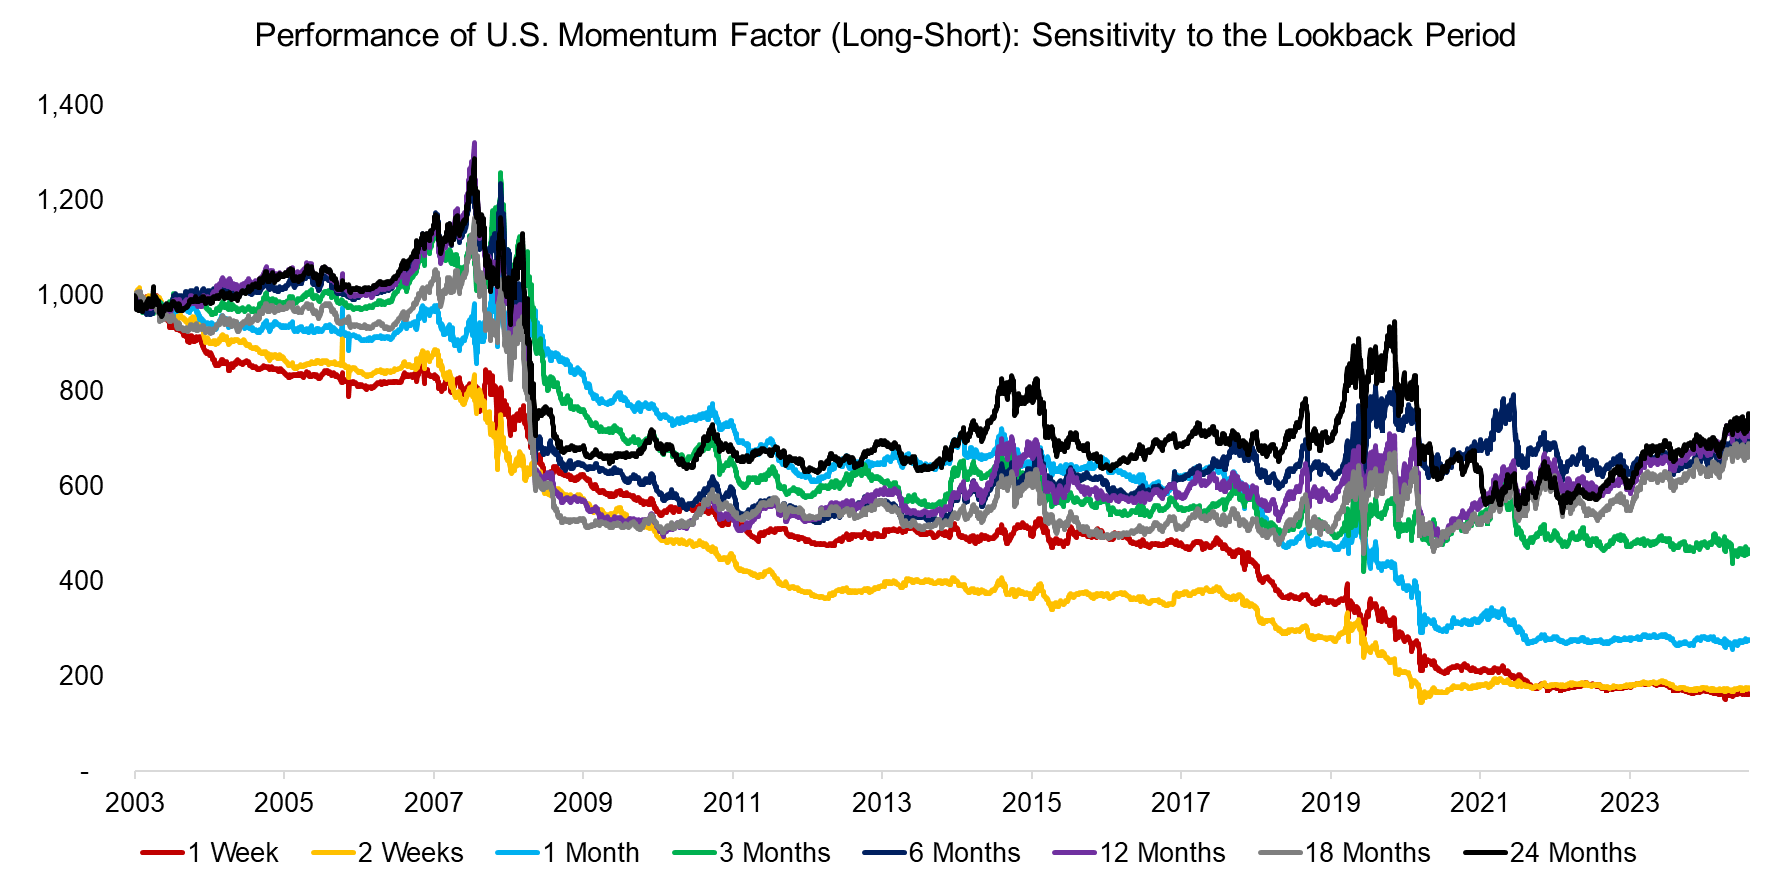
The weak performance of momentum investing over the last two decades can partly be explained by the factor’s crash in 2009, when the worst-hit stocks of the global financial crisis led the recovery rally. However, since then, returns have been largely flat across most scenarios.
One could argue that the results are biased by the assumption of 10 bps transaction costs. Momentum portfolios inherently involve high turnover, which rises further as the lookback period shortens. While institutional investors today typically pay well below 10 bps per trade, even assuming zero transaction costs, the one-week lookback scenario would still have produced negative returns.

Source: Finominal
LOOKBACK SENSITIVITY OF THE MOMENTUM FACTOR LAST 10 YEARS
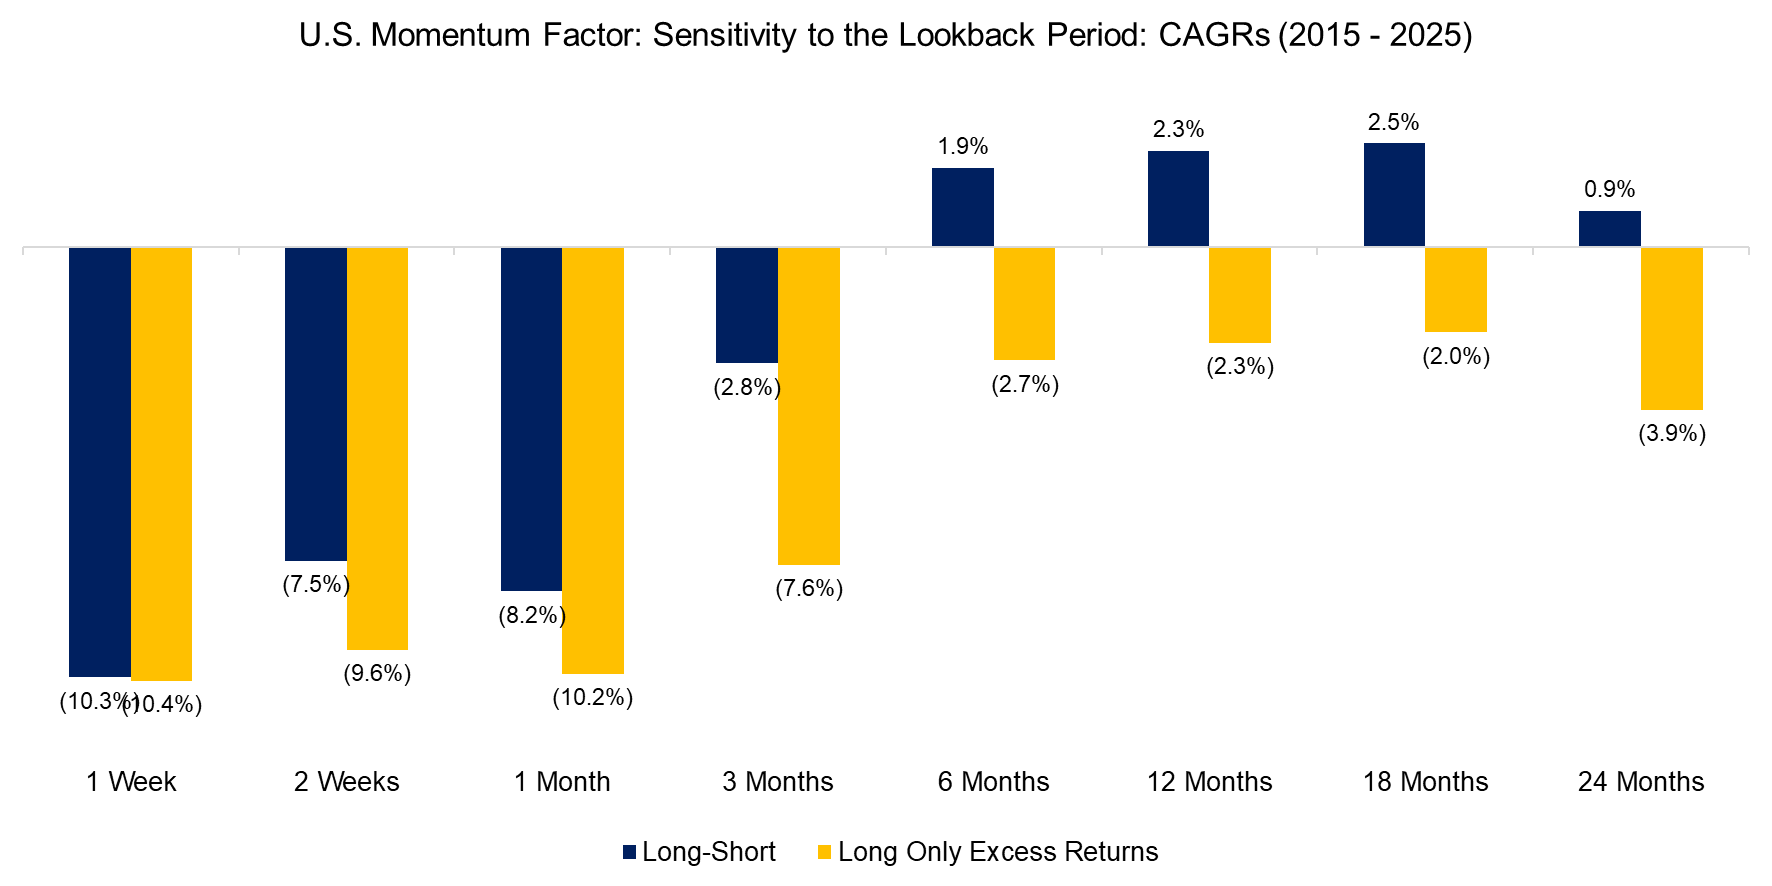
Rebasing the indices to 2015, thereby excluding the global financial crisis and subsequent recovery, does not alter the results. Only the six- to twelve-month lookback produced positive returns – and solely in the long-short portfolio. The long-only strategy delivered consistently negative returns across all lookback periods.
Why does the medium-term lookback between six and 12 months work better than shorter or long-term ones? Likely this is simply a function of the most common graphic in research and media being the annual performance chart, which investors peruse before jumping on a winning trend or dumping losers.

Source: Finominal
FURTHER THOUGHTS
As passive products have gained market share, some commentators claim stock markets have fundamentally changed. However, our analysis shows otherwise: key market statistics have remained largely stable over the past century (read Have Stock Markets Changed?). This underscores that, despite the growth of passive investing, robo-advisors, meme trading, HFT, and other trends, momentum investing remains intact with the traditional lookback periods. It may seem almost too simple, but it continues to work.
RELATED RESEARCH
Improving the Momentum Factor
Momentum Variations
Cap-Weighted Benchmarks: Good Momentum Bets?
Momentum in Emerging Markets
Absolute versus Relative Momentum Across Asset Classes
Thematic versus Momentum Investing
Low Vol-Momentum vs Value-Momentum Portfolios
Market-Neutral versus Smart Beta Factor Investing
Factor Investing Is Dead, Long Live Factor Investing!
The Case Against Factor Investing
Smart Beta vs Alpha + Beta
Outperformance Ain’t Alpha
How Painful Can Factor Investing Get?
ABOUT THE AUTHOR
Nicolas Rabener is the CEO & Founder of Finominal, which empowers professional investors with data, technology, and research insights to improve their investment outcomes. Previously he created Jackdaw Capital, an award-winning quantitative hedge fund. Before that Nicolas worked at GIC and Citigroup in London and New York. Nicolas holds a Master of Finance from HHL Leipzig Graduate School of Management, is a CAIA charter holder, and enjoys endurance sports (Ironman & 100km Ultramarathon).
Connect with me on LinkedIn or X.

