Improving Smart Beta Attribution Analysis II
Differentiating between factor exposures versus factor returns
December 2024. Reading Time: 10 Minutes. Author: Nicolas Rabener.
SUMMARY
- Attribution analysis is important for understanding the risk and return drivers of a fund`s performance
- However, this can be attributed to factor performance and factor exposures
- Which needs to be further differentiated as exposures can be positive or negative
INTRODUCTION
In our last research article (read Improving Smart Beta Attribution Analysis), we highlighted the complexity of attribution analysis, which incorporates asset class and factor performance and a fund`s exposure to these. A value-focused smart beta ETF can severely underperform the general stock market, but this is mostly a consequence of the poor performance of the value factor rather than the stock selection process.
Factors are as cyclical as stock markets, which makes single-factor funds risky investments. Multi-factor funds try to mitigate this risk by allocating to multiple factors, but this has not worked well in the U.S. over the last decade (read Market-Neutral versus Smart Beta Factor Investing).
However, how do you run an attribution analysis when the exposure to the factor is time-varying?
In this research article, we will explore an attribution analysis framework for dynamic multi-factor funds.
ATTRIBUTION ANALYSIS OF STATIC SMART BETA ETFS
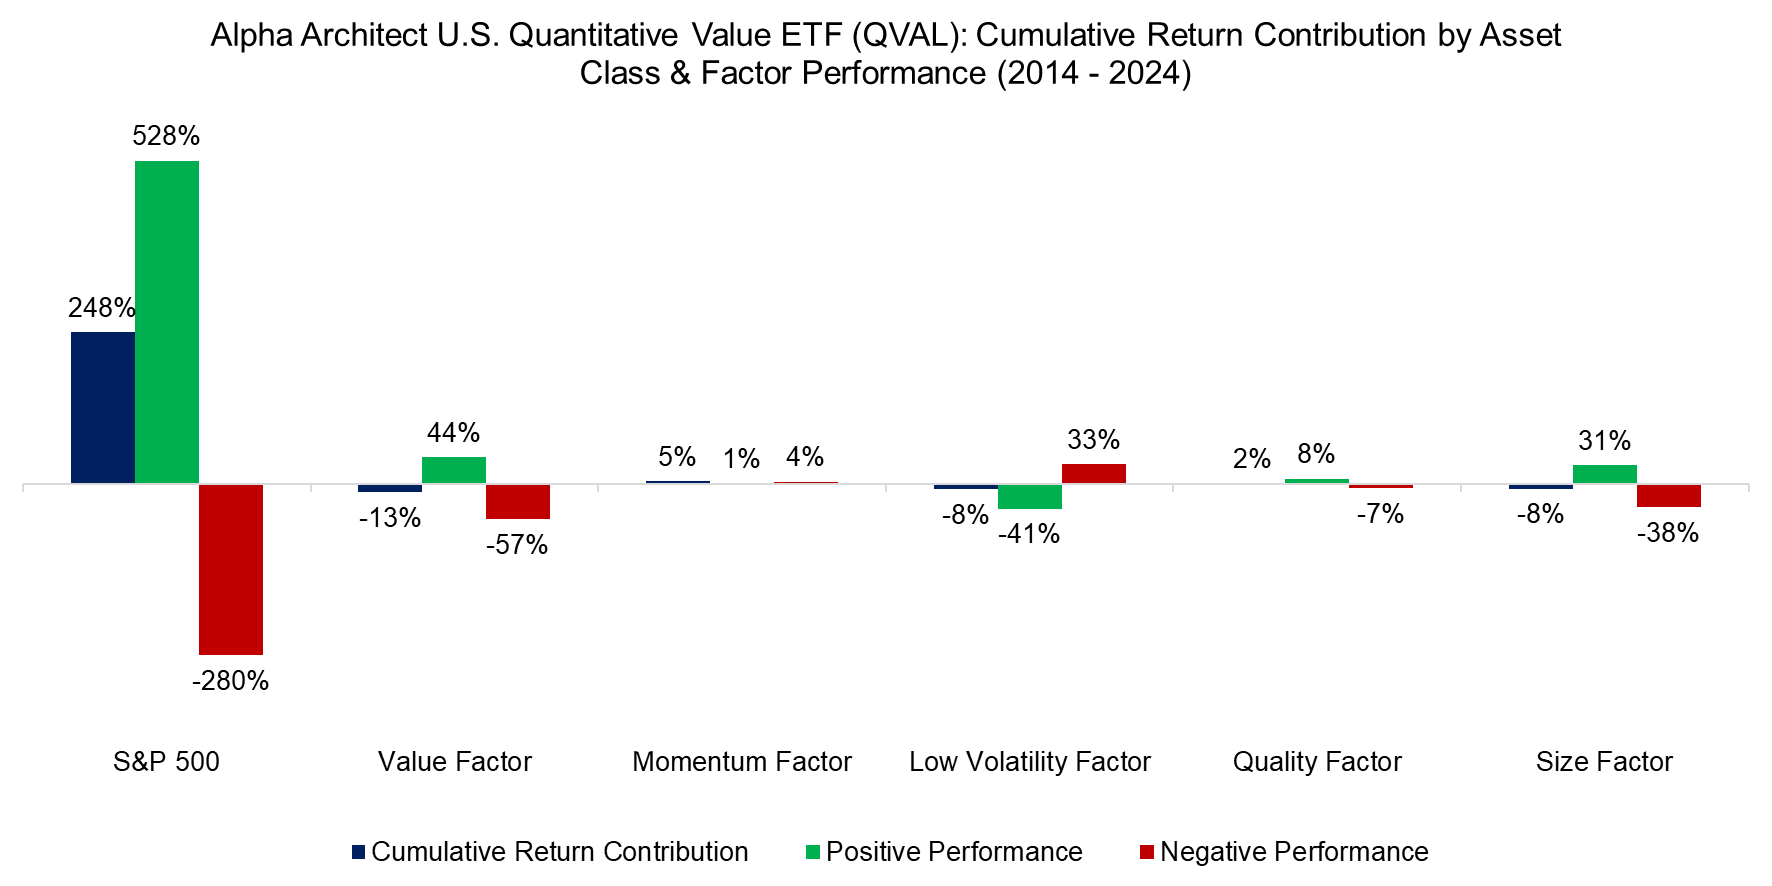
First, we run an attribution analysis for a smart beta ETF, Alpha Architect`s U.S. Quantitative Value ETF (QVAL), that provides static factor exposures. The ETF was launched in 2014, is actively managed, and holds a concentrated portfolio of 50 equal-weighted U.S. stocks sorted on quality and valuation metrics.
The analysis highlights that almost all returns can be attributed to the U.S. stock market (S&P 500), which is expected for a long-only fund. The value factor provided the largest return contribution, followed by low volatility and size.
We observe that the negative contribution from the value factor can be simply attributed to the factor generating negative returns. In contrast, the negative contribution of the low volatility factor can be attributed to the factor`s positive performance, which imdplies that QVAL had negative exposure to the factor, which is intuitive as cheap stocks tend to be volatile.

Source: Finominal
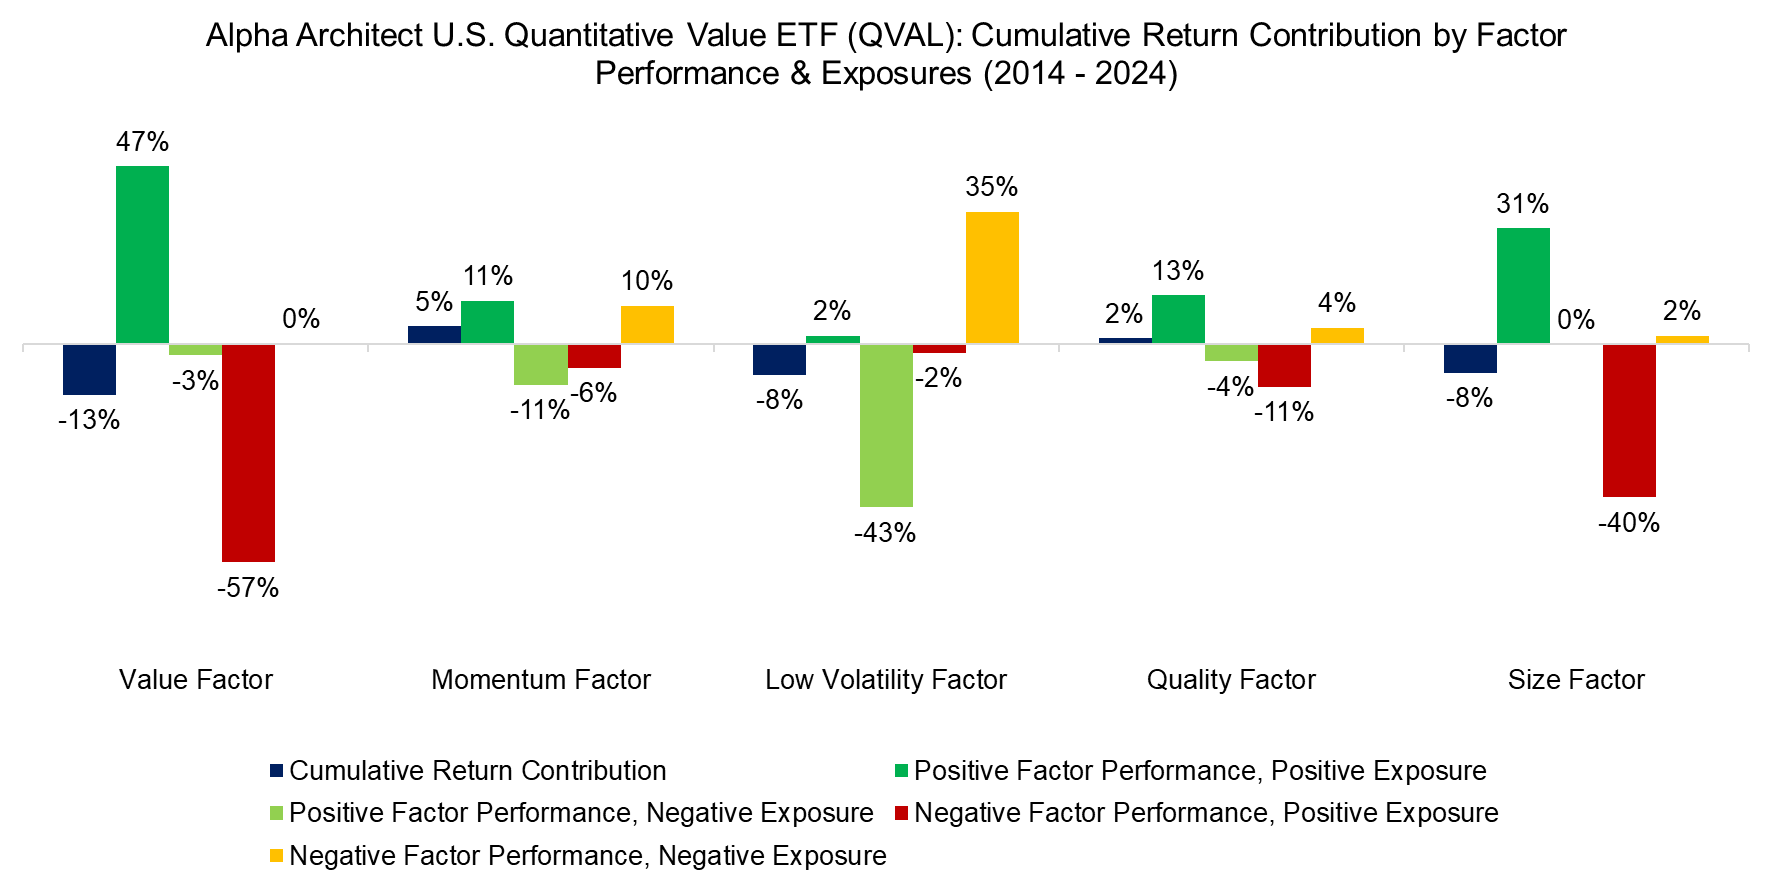
Although the negative attribution from the value factor is undesirable, how much can Alpha Architect be faulted for the factor`s poor performance?
QVAL`s objective is to provide high exposure to the value factor, but statically rather than dynamically. We can enhance the attribution analysis by differentiating between when the factor performance was positive or negative, and when QVAL had positive or negative factor exposures. The analysis highlights that QVAL had close to zero negative exposure to the value factor, as expected, so almost all returns can be attributed to the factor performance rather than the factor exposure.

Source: Finominal
ATTRIBUTION ANALYSIS OF DYNAMIC SMART BETA ETFS
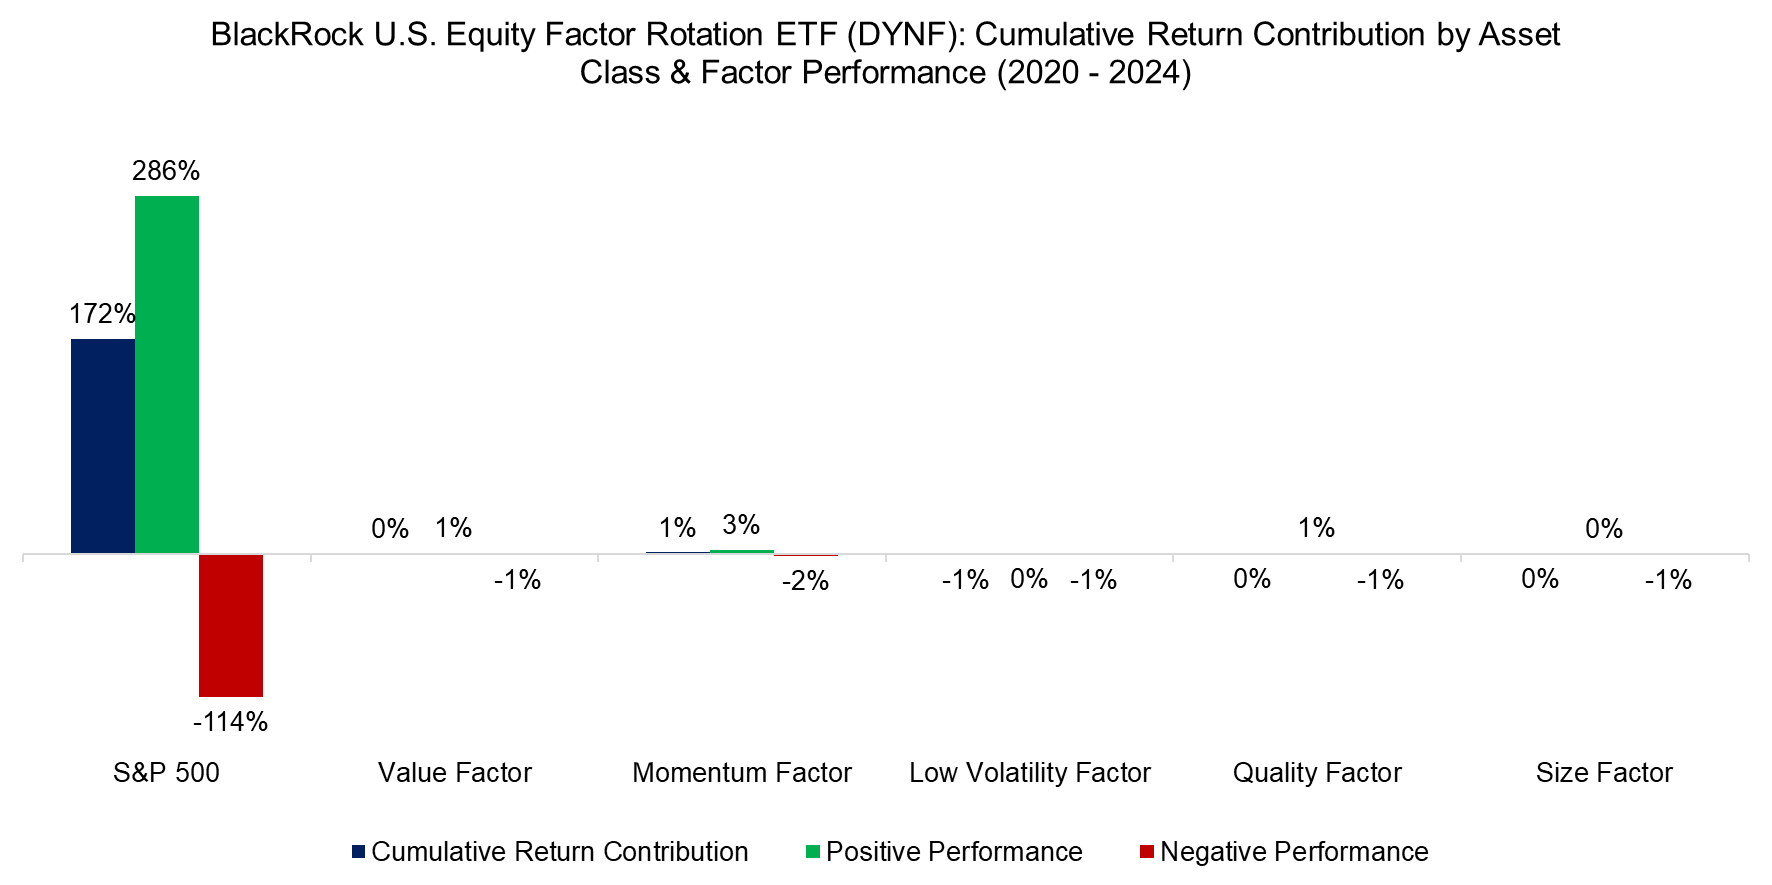
Next, we apply the same attribution analysis framework to a dynamic multi-factor ETF, BlackRock`s U.S. Equity Factor Rotation ETF (DYNF). The analysis reveals that almost all returns can be attributed to the S&P 500 and factors contributed almost zero in the period from 2020 to 2024, which is disappointing as it suggests only minor factor exposures and therefore a low probability of generating outperformance.

Source: Finominal
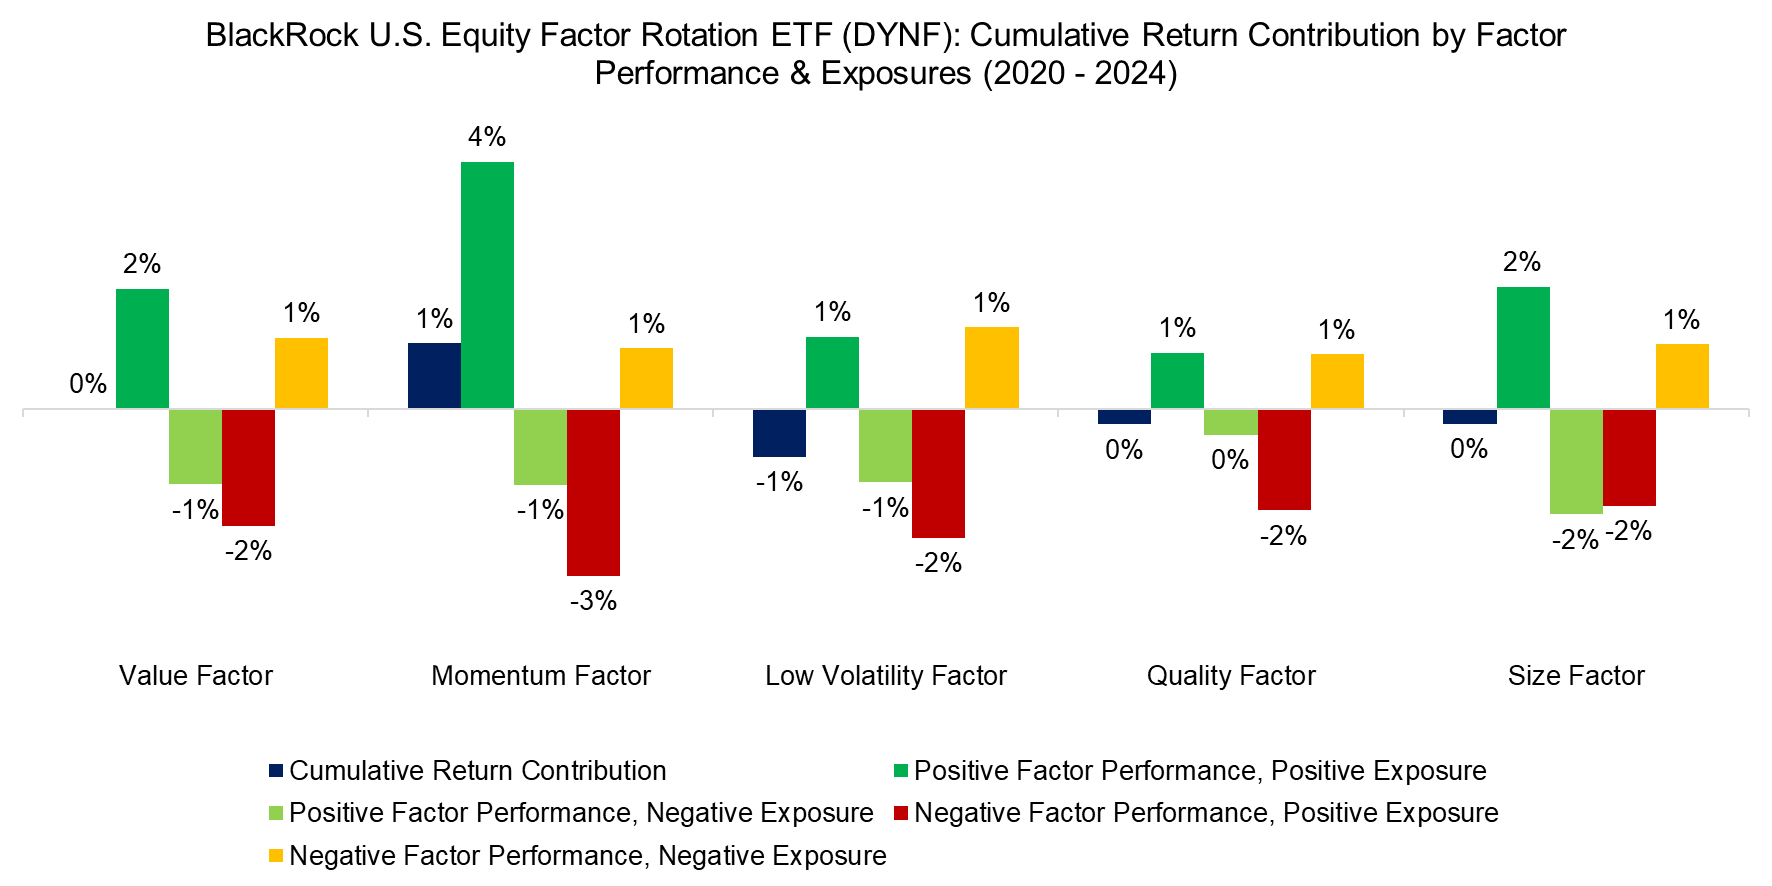
Finally, we again differentiate between positive or negative factor performance and positive or negative factor exposures. If BlackRock was skilled at factor timing, then the factor performance should not matter much. The fund would shift allocations accordingly to harvest positive excess returns with positive exposure and negative returns with negative exposure.
However, we see that DYNF generated similar amounts of negative as positive excess returns. The negative returns can be attributed to either holding positive exposure to factors when their performance was negative, or negative exposure to factors when their performance was positive. Stated differently, BlackRock does not seem to be skilled at factor timing.

Source: Finominal
FURTHER THOUGHTS
The challenge of attribution analysis is not only that it is a combination of factor performance and factor exposures, but also that it depends on which factors are selected and how factors are defined, e.g. there are many ways of measuring the quality of companies.
Given this, it makes it challenging to reconcile the results from different portfolio analysis providers like Bloomberg, MSCI Barra, or Finominal. As often in investing, analysis should be regarded as indicative rather than definitive.
RELATED RESEARCH
Improving Smart Beta Attribution Analysis
Factor Investing Is Dead, Long Live Factor Investing!
The Case Against Factor Investing
Smart Beta vs Alpha + Beta
Outperformance Ain’t Alpha
How Painful Can Factor Investing Get?
Smart Beta: Broken by Design?
Combining Smart Beta Funds May Not Be Smart
Factor Exposure Analysis 102: More or Less Independent Variables?
Factor Exposure Analysis 101: Linear vs Lasso Regression
Factor Exposure Analysis 100: Holdings vs Regression-Based
ABOUT THE AUTHOR
Nicolas Rabener is the CEO & Founder of Finominal, which empowers professional investors with data, technology, and research insights to improve their investment outcomes. Previously he created Jackdaw Capital, an award-winning quantitative hedge fund. Before that Nicolas worked at GIC and Citigroup in London and New York. Nicolas holds a Master of Finance from HHL Leipzig Graduate School of Management, is a CAIA charter holder, and enjoys endurance sports (Ironman & 100km Ultramarathon).
Connect with me on LinkedIn or X.

