Improving the Odds of Value
Tactical versus Strategic Allocations to Value
October 2018. Reading Time: 10 Minutes. Author: Nicolas Rabener.
SUMMARY
- Value investors earn a premium for holding undesirable stocks
- Market skewness may identify periods where the premium is more attractive
- The returns from the Value factor since 1926 were zero when market skewness was negative
INTRODUCTION
Although buying cheap stocks is intuitively appealing, holding them is highly unappealing for most investors. Value stocks tend to be companies that lack growth, require balance sheet restructuring, feature incompetent management, need a new corporate strategy, are rated “Sell” by brokers, or have some other issue. Effectively Value investors provide a service to the market by holding undesirable stocks.
Historically Value investors were compensated for this service, although with moderate consistency across time. It would be highly desirable to identify the type of environment that is more favorable for harvesting the premium from buying cheap and selling expensive stocks. In this short research note, we will explore using market skewness for improving allocations to the Value factor (read There is Value in the Value Factor).
METHODOLOGY
We focus on the Value factor in the US stock market and source data from the library of Kenneth R. French. The performance of the Value factor is derived from a dollar-neutral long-short portfolio of the top and bottom stocks in the US ranked by price-to-book multiples. The data is available from 1926 to 2018, includes companies with small market capitalizations, and excludes transaction costs.
THE VALUE FACTOR & MARKET SKEWNESS
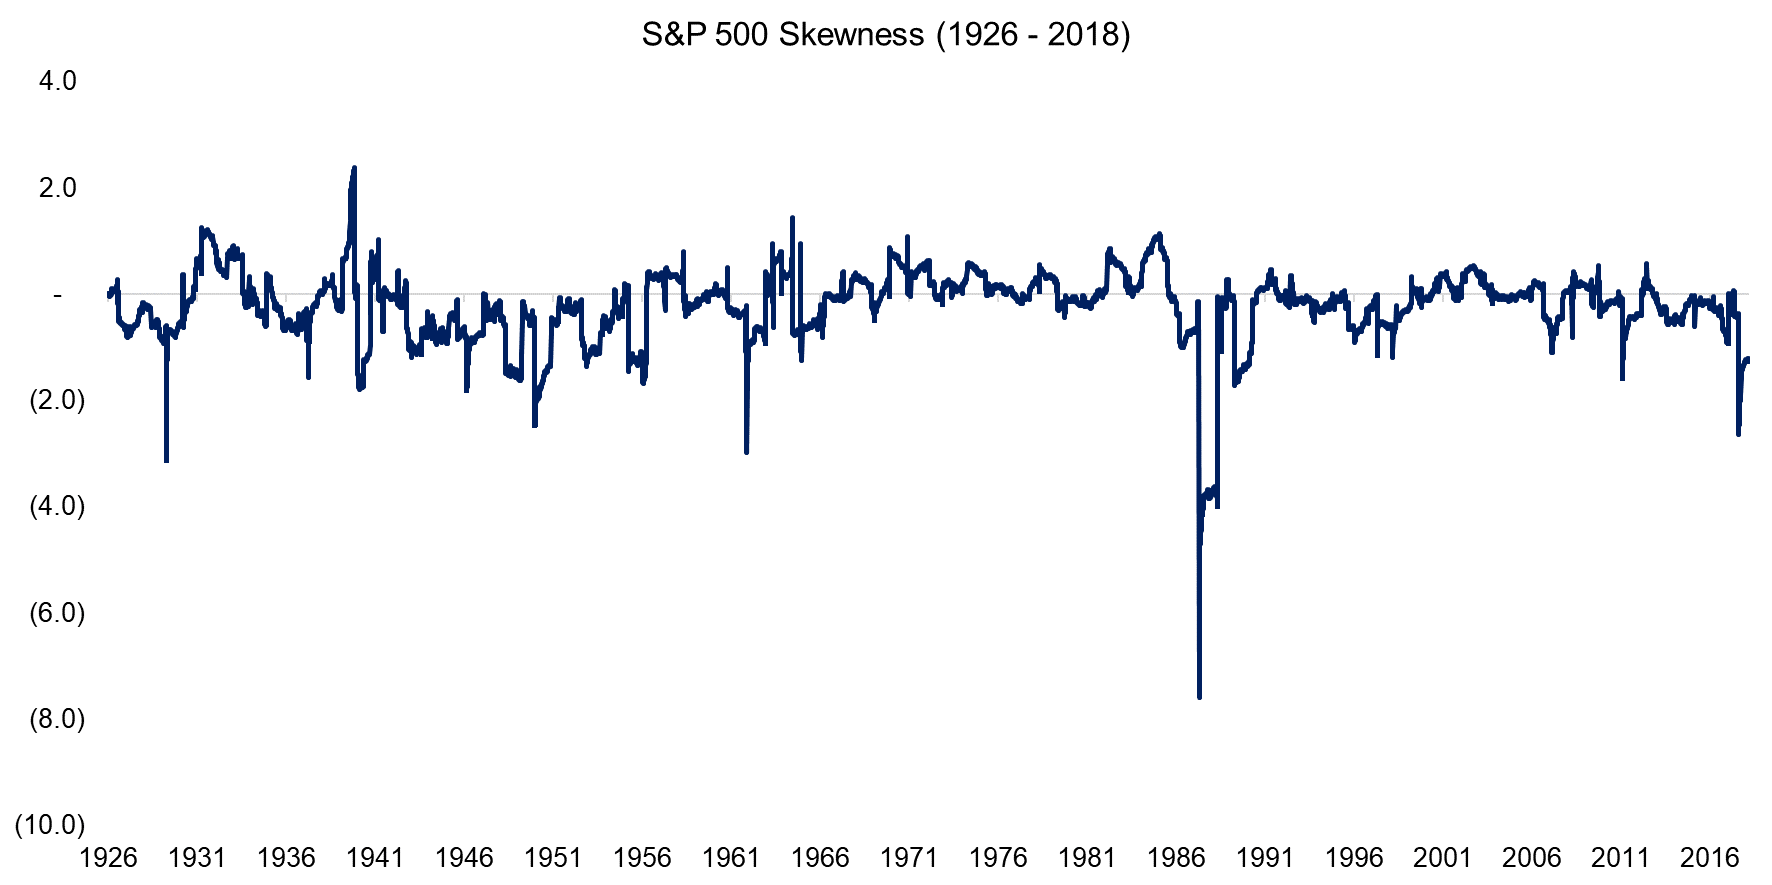
The chart below shows the skewness of the S&P 500 from 1926 to 2018 measured with a 12-month lookback. Positive skewness describes a return distribution where frequent small losses and a few extreme gains are common while negative skewness highlights frequent small gains and a few extreme losses.
The S&P 500’s skewness was slightly negative (-0.2) over the 90-year period. The chart below highlights some of the significant moments in stock market history, e.g. the stock market crash of 1987. We can see that the most recent skewness in 2018 was more extreme than during the Global Financial Crisis, which is explained by the strong returns coupled with the exceptionally low volatility that preceded the market losses of the first quarter of 2018.
Source: FactorResearch, Stooq.com
If the stock market exhibits negative skewness, then the recent history features some days with large losses. Investors are likely to be risk averse when the skewness of the stock market is negative, which should create more demand for quality stocks than for cheap, but typically problematic companies (read Skewness as a Factor).
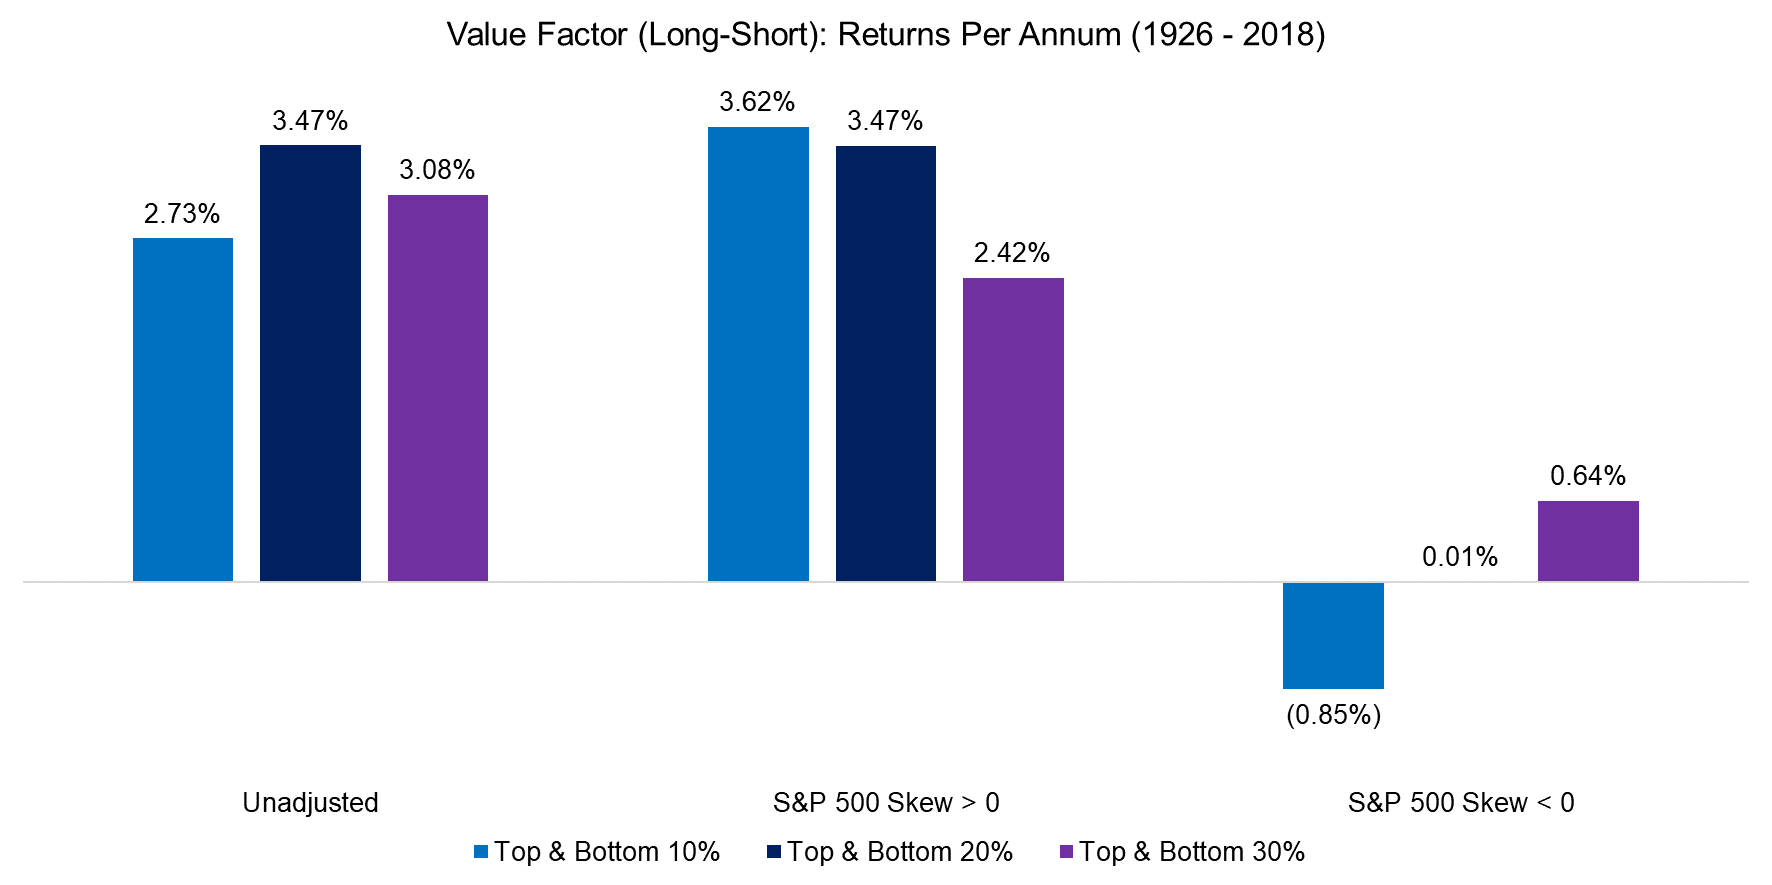
The analysis below shows the returns per annum of the long-short Value factor from 1926 to 2018 for three portfolios, which were created based on the top and bottom 10%, 20% and 30% of US stocks ranked by price-to-book multiples.
We observe that the Value factor generated significantly higher returns per annum when the market skewness was positive than when negative. It is worth noting that the more concentrated the Value portfolio, e.g. the top and bottom 10% versus 30%, the larger the impact of skewness on the returns.
Source: FactorResearch, Kenneth R. French
TACTICAL VERSUS STRATEGIC VALUE FACTOR EXPOSURE
We can apply the insight on the relationship between the Value factor and market skewness by developing a systematic allocation framework, which only invests in the Value factor when market skewness is positive, otherwise into cash. Allocation changes are implemented with one day delay to create a more realistic trading strategy. Given the 12-month lookback for calculating skewness, allocations change on average only three times per annum, which makes this framework attractive for implementation.
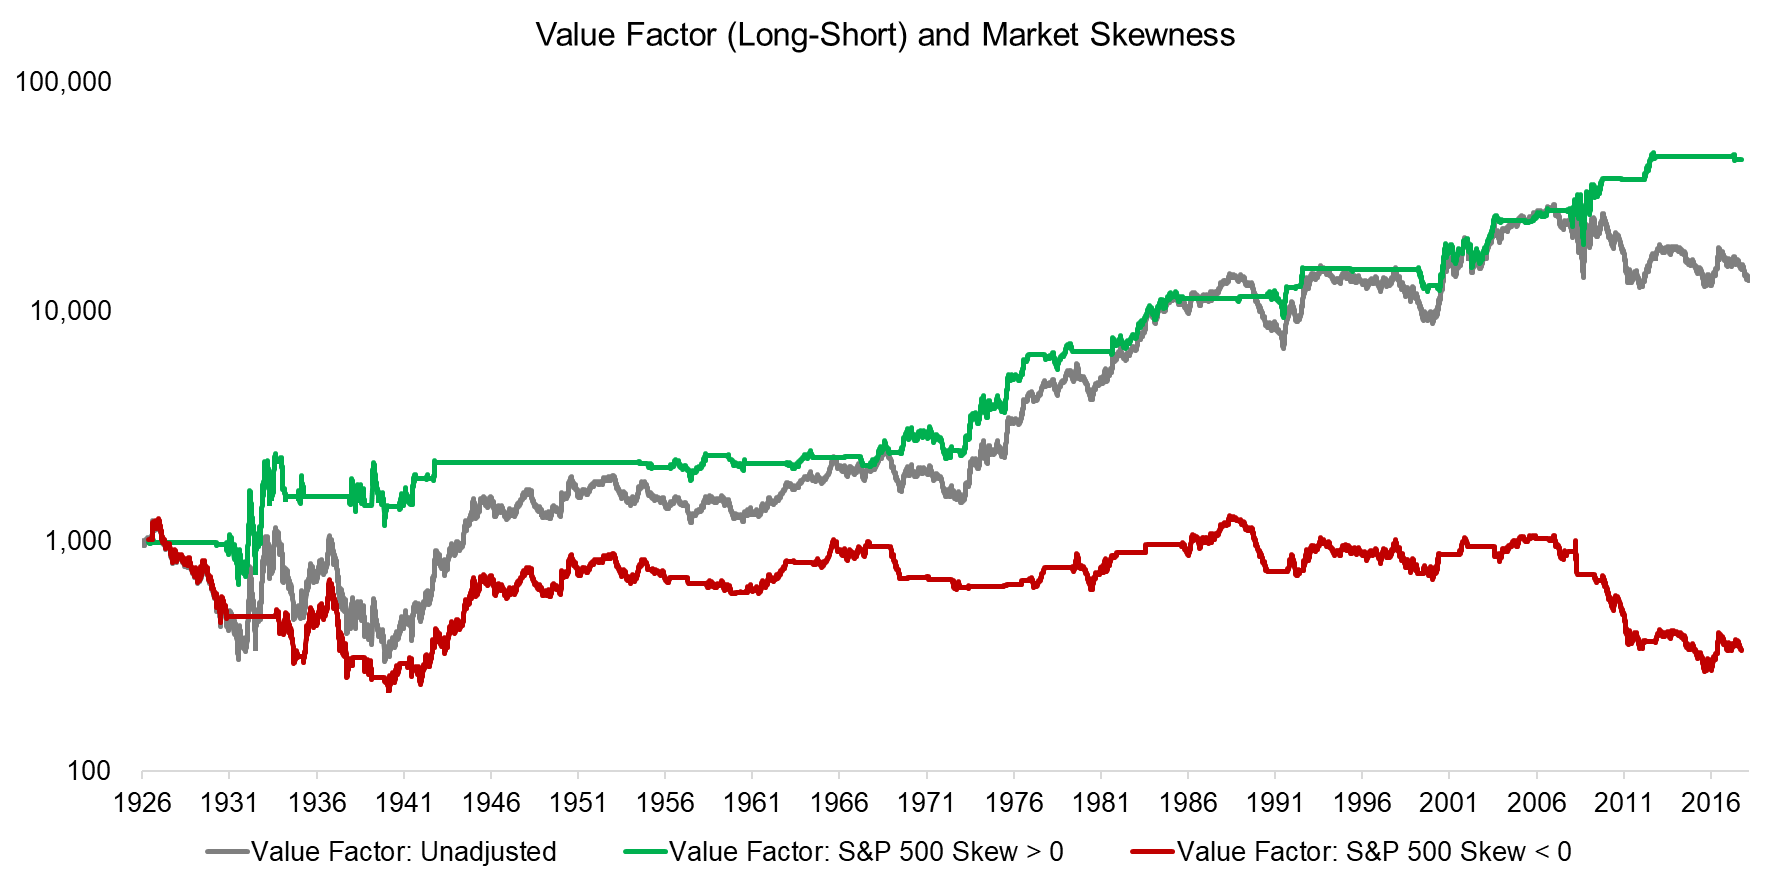
The chart below compares the performance of the Value factor to when market skewness was positive or negative. We focus on the most extreme Value portfolio comprised of the top and bottom 10% of the stocks. We observe the following:
- Positive market skewness: The framework captures most of the returns generated by the Value factor with lower volatility and drawdowns, especially during the Great Depression and the most recent decade
- Negative market skewness: Post 1946 the Value factor did not generate any significant positive returns when market skewness was negative
Source: FactorResearch
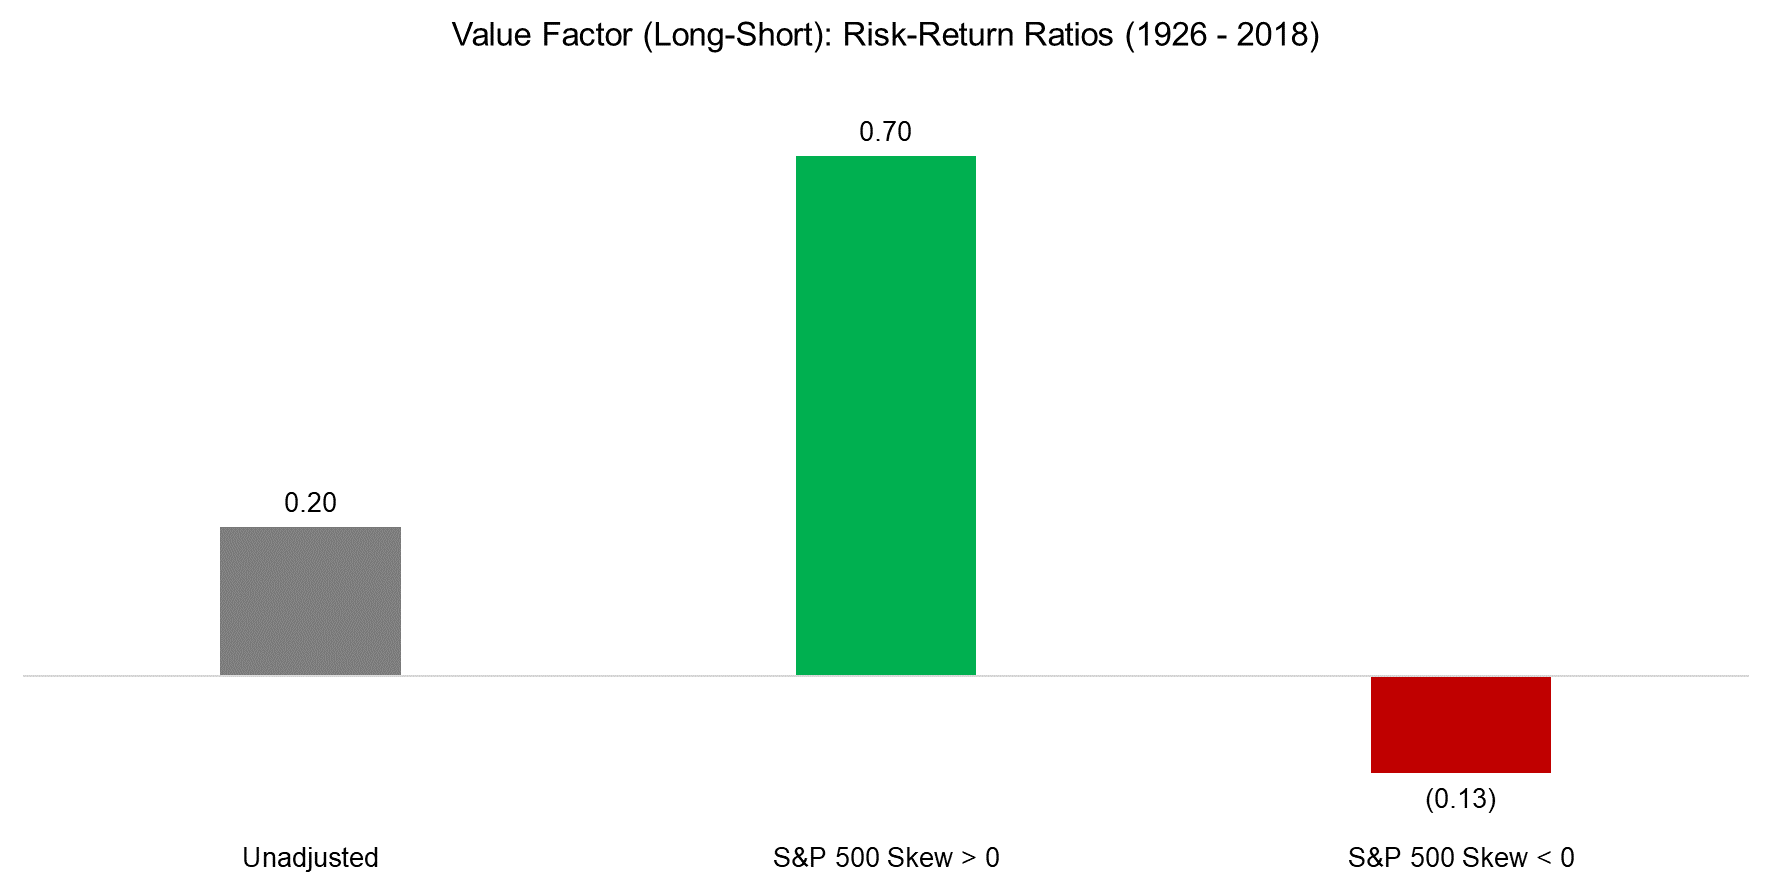
Next, we normalize the return data by creating risk-return ratios, which highlight that allocating to the Value factor was not attractive when the skewness of the stock market was negative.
Given that the market is skewed positively only 35% of the time, it implies a 65% allocation to cash for the portfolio that allocates to the Value factor when skewness is positive. Investors could reallocate cash into short-term bonds or other strategies, which would further increase the risk-return ratio.
Source: FactorResearch
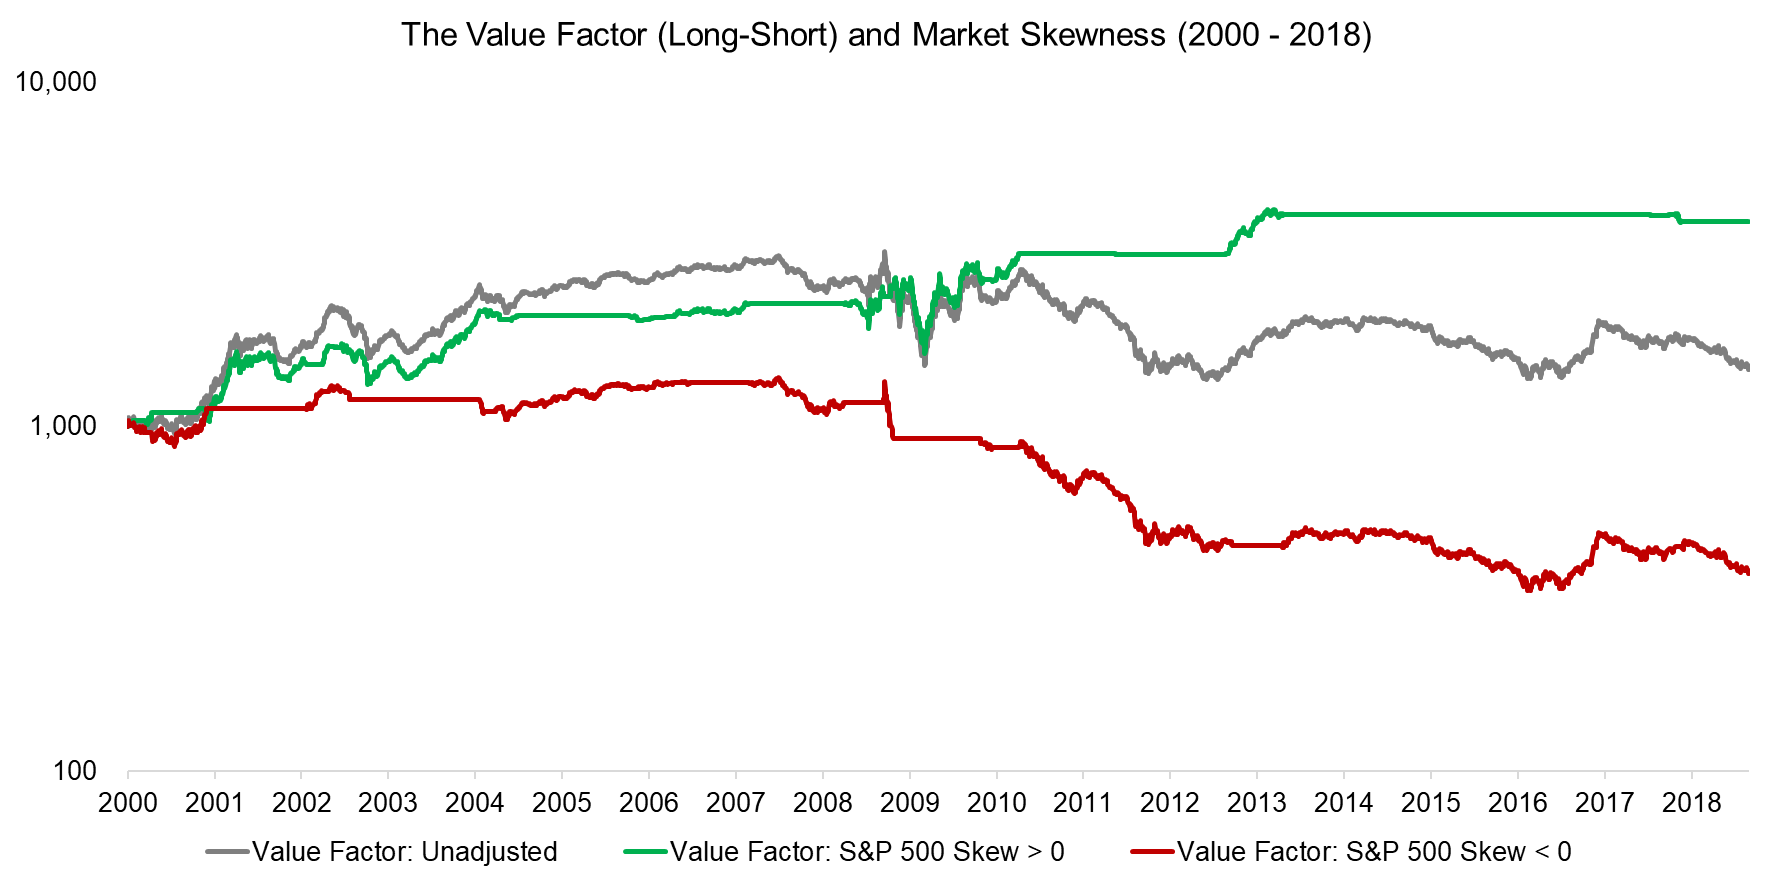
Most investors are likely to be more interested in the recent past, therefore we rebase the portfolios to 2000. We observe the Value rebound after the Tech bubble implosion between 2000 and 2003, but losses in the last decade and a total return of close to zero, which is before transaction costs.
Although the chart below emphasizes the attractiveness of only allocating to Value when market skewness is positive, it also highlights the difficulty of implementing the strategy in practice – years of a zero allocation to the Value factor. Given that Value is the most widely pursued strategy, it likely would challenge even highly disciplined investors to follow the framework.
Source: FactorResearch, Kenneth R. French
FURTHER THOUGHTS
This short research report introduces a novel, systematic framework for allocating to the Value factor. Allocating tactically based on the market skewness might be considered unusual given the abstract nature of skewness. However, the skewness of the stock market can perhaps be understood as a measurement for the risk sentiment of investors. If risk aversion prevails, then investors are less likely to be interested in cheap, but problematic stocks and Value investors will not get compensated for holding undesirable stocks.
The analysis can be challenged in many ways, amongst these are:
- Skewness lookback of 12 months; however, 6 and 24 months work equally well
- Price-to-book multiple as Value definition; however, Value portfolios show similar trends, regardless of how they are defined
- Excludes transaction costs; however, these would be minimal given that there are only three allocation changes per annum on average
The next step is to conduct the same analysis in other stock markets, which can serve as an out-of-sample test for the framework and will be the subject of another research note.
RELATED RESEARCH
ABOUT THE AUTHOR
Nicolas Rabener is the CEO & Founder of Finominal, which empowers professional investors with data, technology, and research insights to improve their investment outcomes. Previously he created Jackdaw Capital, an award-winning quantitative hedge fund. Before that Nicolas worked at GIC and Citigroup in London and New York. Nicolas holds a Master of Finance from HHL Leipzig Graduate School of Management, is a CAIA charter holder, and enjoys endurance sports (Ironman & 100km Ultramarathon).
Connect with me on LinkedIn or X.

