Improving the Odds of Value: II
Tactical versus Strategic Allocations to Value
September 2019. Reading Time: 10 Minutes. Author: Nicolas Rabener.
SUMMARY
- Value investors earn a premium for holding undesirable stocks
- The yield curve may identify periods where the premium is more attractive
- Since 1971, the performance of the Value factor was negative when the yield curve was flattening
INTRODUCTION
Imagine a portfolio of companies that are plagued by declining sales, negative earnings, too much leverage, rating downgrades, CEOs that prefer golf over the board room, and corporate strategies that are sound as trying to conquer Russia in winter. These companies would be unloved by shareholders, but they also would be cheap.
What kind of environment would investors require to feel comfortable to take a wager on these stocks?
Investors would unlikely to be willing to speculate on the fortune of such a basket of Value stocks when they feel insecure in their outlook on the economy and stock market. We previously analysed the relationship between the Value factor and the skewness of the stock market in the US, which highlighted that nearly the entire performance of the Value factor can be attributed to when the market was skewed positively over the last year. Positive skewness implies that were no major accidents on the road behind (please see Improving the Odds of Value).
Market skewness can be viewed as a rear view-measure of what happened in the stock market and how investors might perceive the current risk environment. Naturally there are further measures to be considered for determining investor sentiment. One that has been central to all asset allocation discussions in 2019 is the yield curve, which inverted for the first time since 2007 and can be considered forward-looking.
In this short research note, we will explore using the yield curve to improve allocations to the Value factor (read Factors & Interest Rates).
METHODOLOGY
We focus on the Value factor in the US stock market and source data from the library of Kenneth R. French. The performance of the Value factor is derived from a dollar-neutral, long-short portfolio of the top and bottom 10% of stocks in the US ranked by price-to-book multiples. The data is available from 1926 to 2019, includes companies with small market capitalizations, and excludes transaction costs.
Interest rate data is sourced from the US Fed and is available since 1971. The yield curve is calculated as the spread between the 10-year and 2-year US government zero-coupon bond yields.
THE US YIELD CURVE
An inversion of the yield curve, i.e. when short-term bonds have higher yields than long-term bonds, is often considered as a harbinger of a recession. The last two inversions in the US occurred in 2000 and 2007, which were indeed followed by recessions and severe bear markets. The yield curve was inverted less than 15% of the time since 1971, which is expected as long-term debt should yield higher interest rates than short-term debt of the same issuer given higher risk.
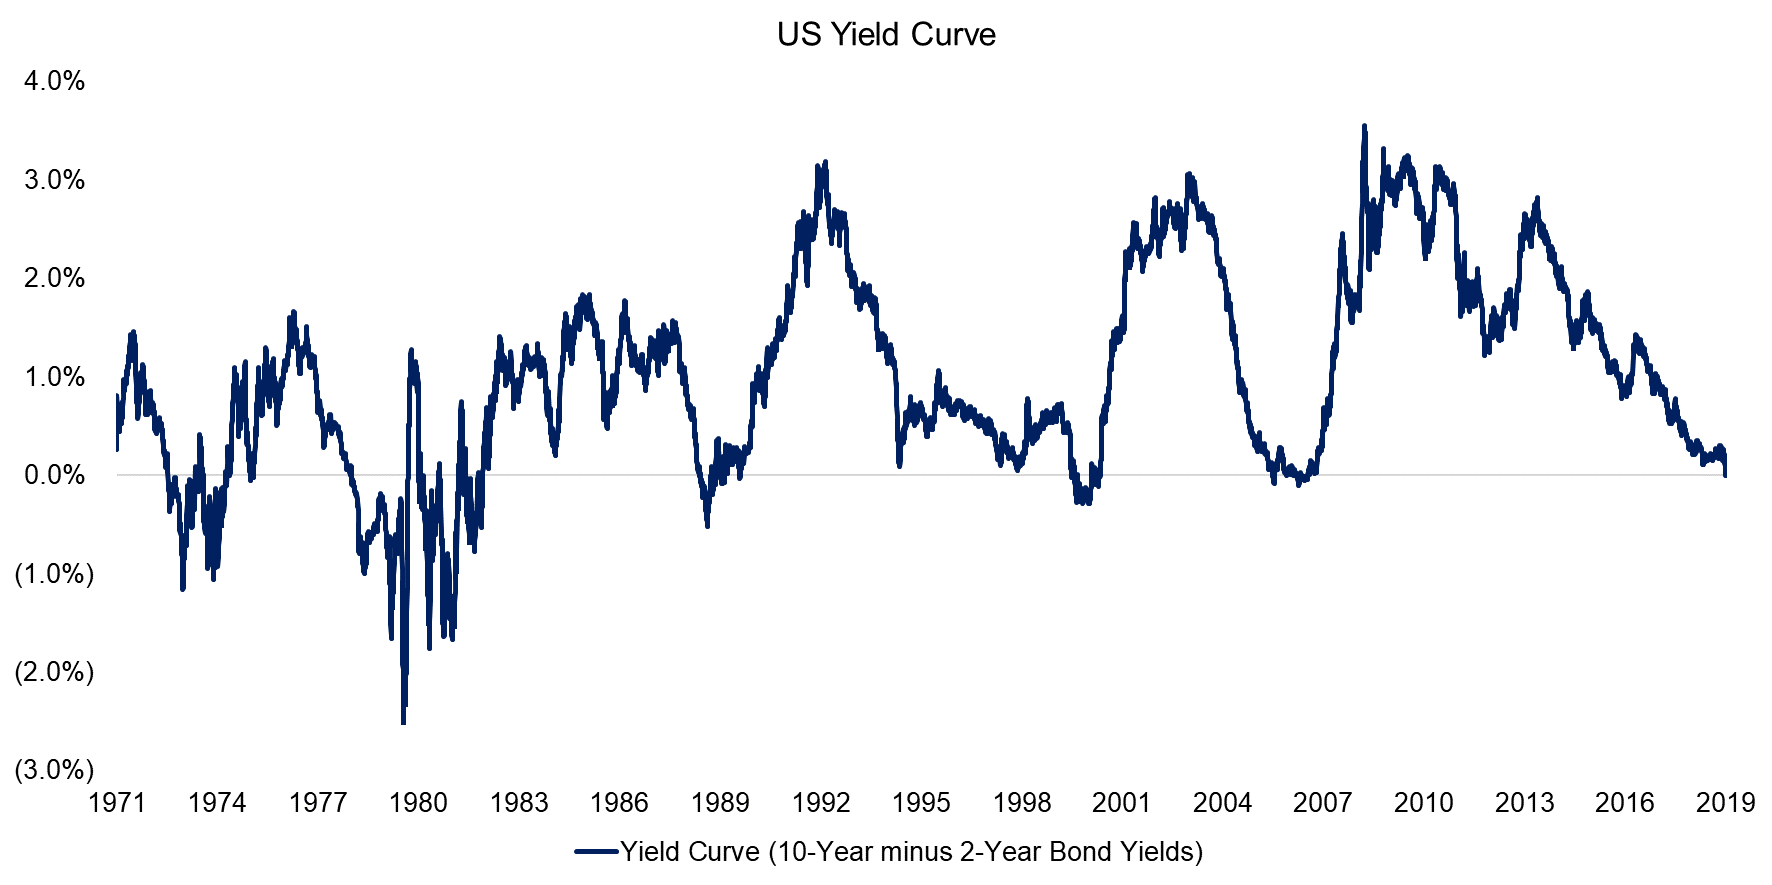
Source: US Fed.
THE VALUE FACTOR VS THE YIELD CURVE
The long-short Value factor and the yield curve should not be comparable as the former represents the cumulative total return of buying cheap and selling expensive stocks while the later is a mean-reversionary time series derived from two debt instruments of the US government. Since 1971, the Value factor generated an excess return of 4.2% per annum while the yield curve traded between -2% and +3%. Comparing the two times series visually does not reveal any relationship as expected.
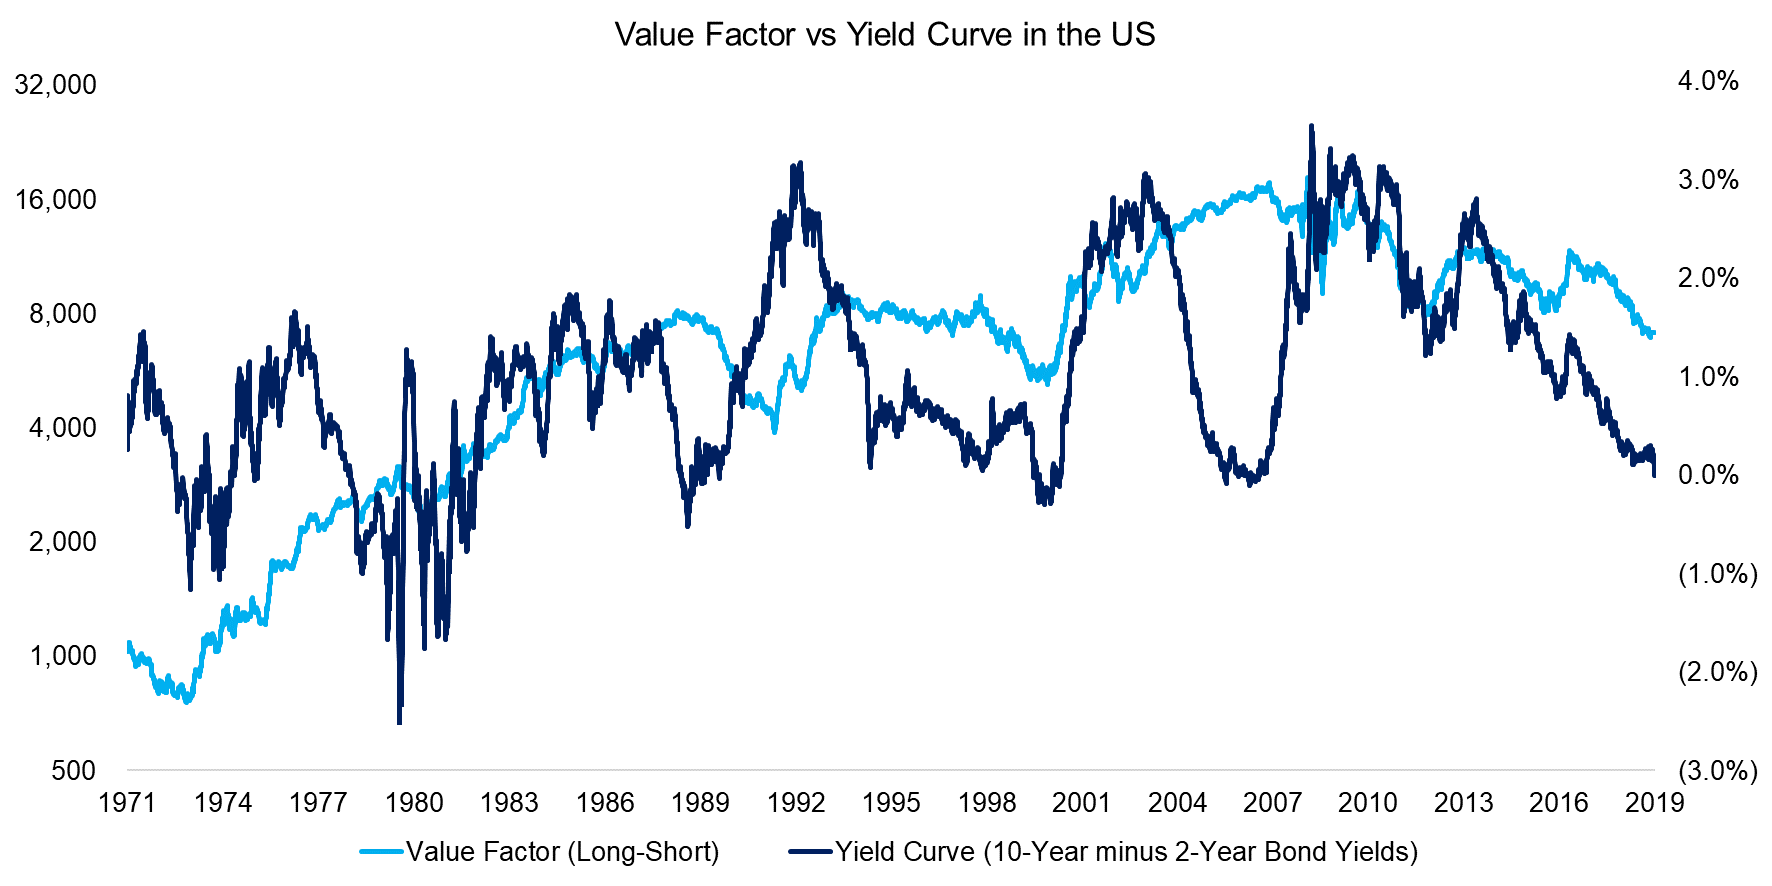
Source: Kenneth R. French Data Library, US Fed, FactorResearch
Perhaps we might identify a relationship if we shorten the observation period as that will reduce the impact of cumulative returns. For example, the performance of the Value factor and direction of the yield curve over the last decade shared the same trends, suggesting that both times series were correlated. Choosing this period can be challenged as cherry picking, but the similarity in trends does not seem like a coincidence.
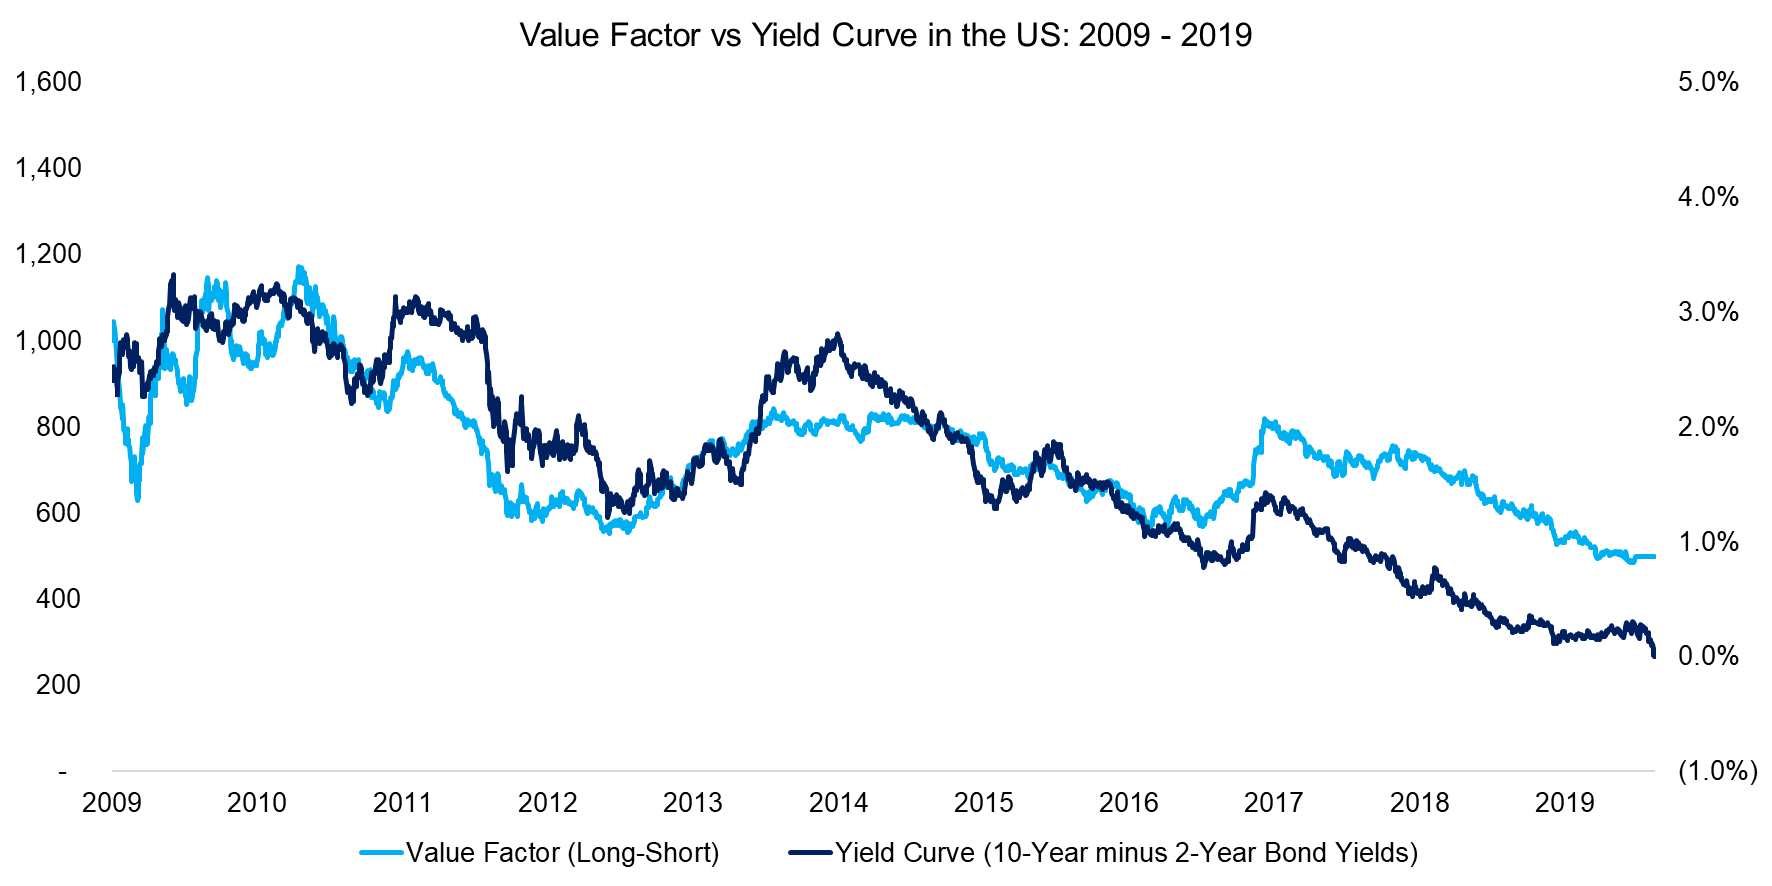
Source: Kenneth R. French Data Library, US Fed, FactorResearch
In order to test for a relationship, we analyse the returns of the Value factor when the yield curve flattens or steepens. The yield curve is a volatile time series, but suitable for normalization given the mean-reversion characteristics and we therefore calculate a z-score, using a 3-month lookback. A z-score above one implies that the yield curve has been steepening while below one means it has been flattening. Next, we create two portfolios by sorting the Value factor returns into either scenario.
We observe that the returns of the Value factor were negative when the yield curve was flattening and positive when steepening in the period between 1971 and 2019. These results are intuitive as a steepening yield curve typically implies a risk-on environment where investors are more inclined to take larger risks, such as betting on cheap, but problematic companies. On the contrary, when the yield curve flattens, investors tend to expect worsening economic conditions and are more likely to allocate to stocks associated with safety.
Based on these results and the economic rationale, investors should avoid exposure to the Value factor when the yield curve flattens.
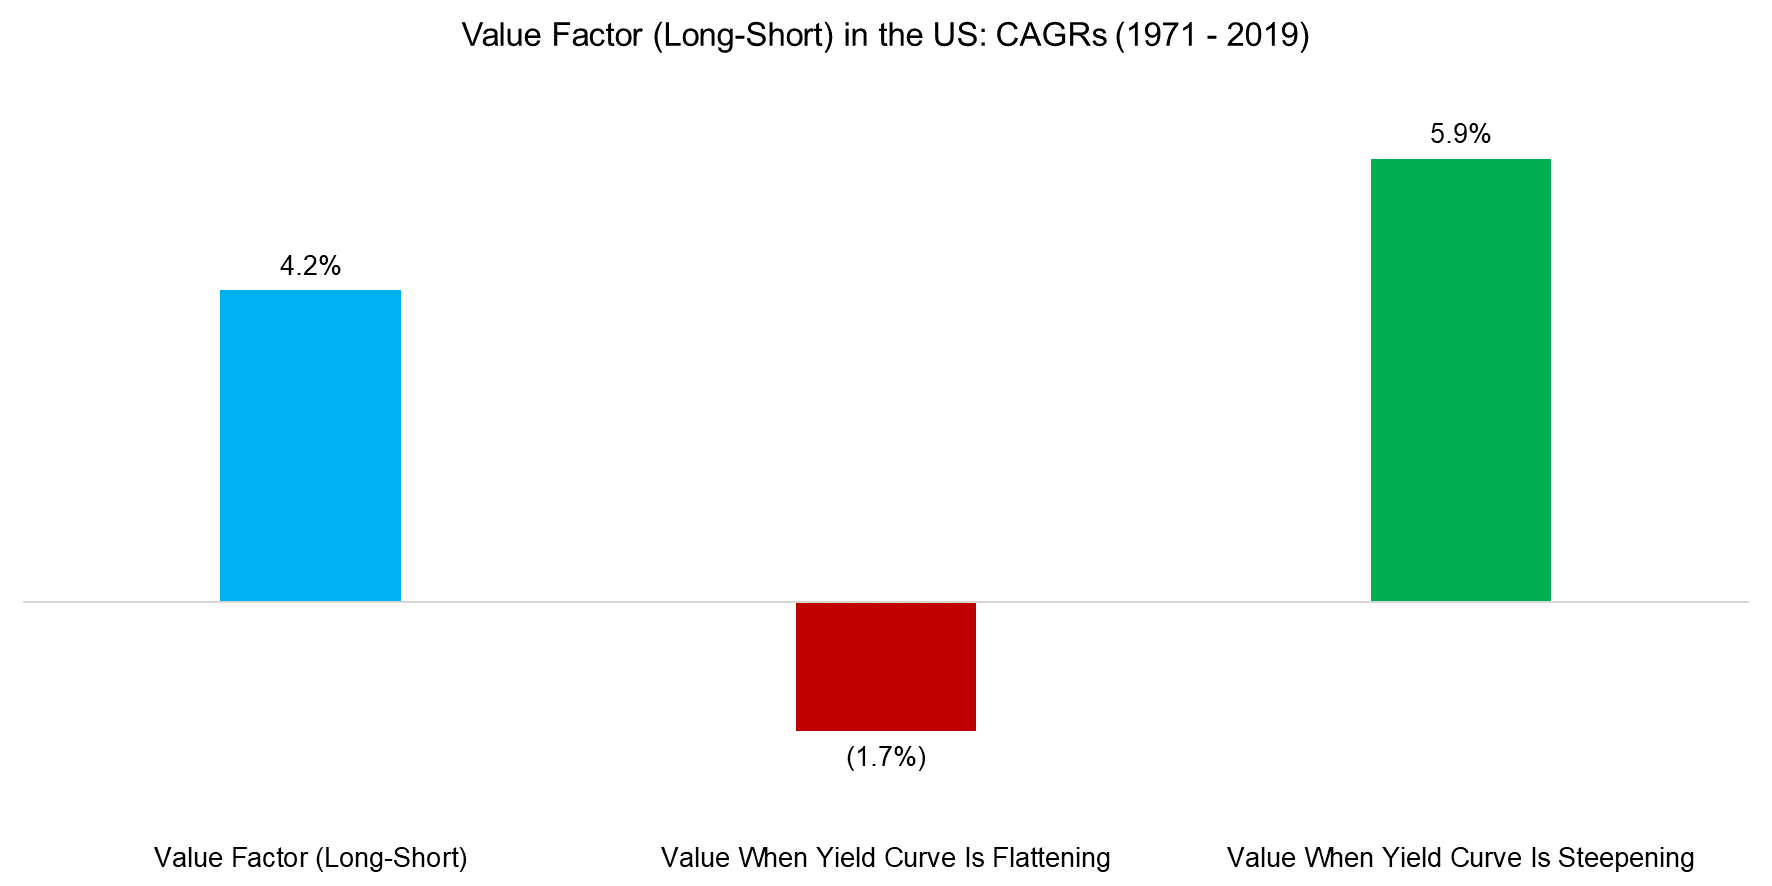
Source: FactorResearch
TACTICAL VS STRATEGIC VALUE FACTOR EXPOSURE
However, although there seems to be a clear relationship between the Value factor returns and the direction of the yield curve, it does not mean that it can be exploited profitably, if it is coincidental or would be consumed by transaction costs.
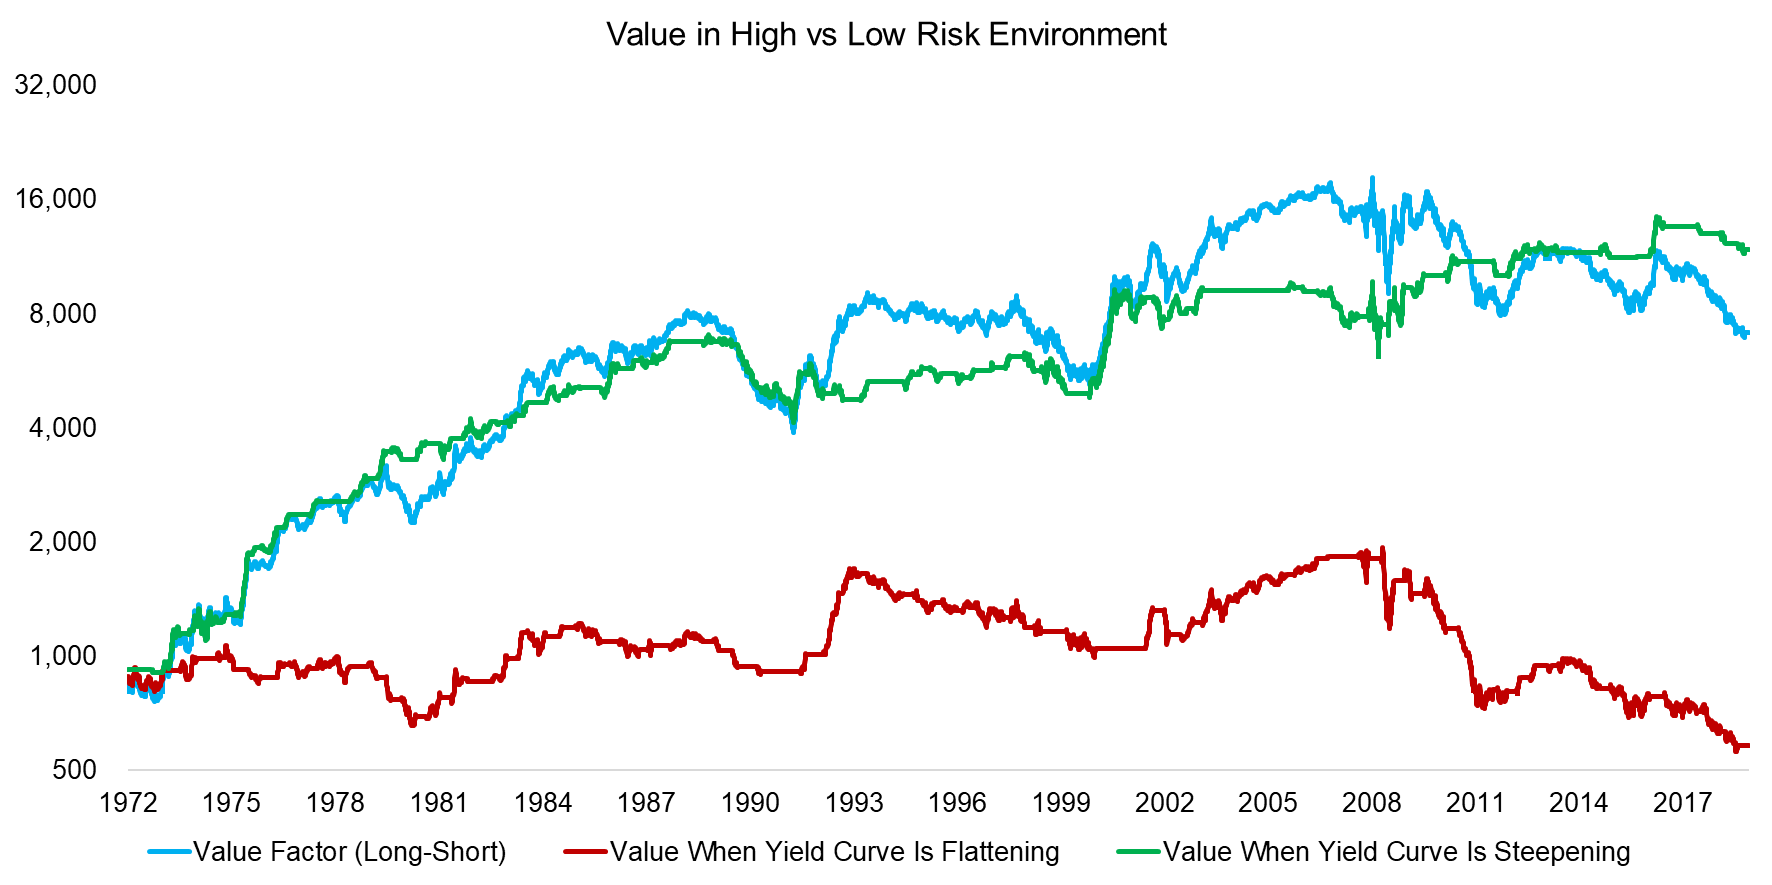
In order to create a realistic allocation framework, we introduce a one day-delay before any transaction and calculate the one-month average of the yield curve z-score. The averaging process helps to avoid frequent allocation changes and reduces the amount of trades to three per annum, which makes this an implementable trading strategy with low transaction costs.
We observe that almost the entire performance of the Value factor can be attributed to an environment when the yield curve was steepening. Allocating to cheap stocks when the yield curve was flattening was not an attractive strategy.
Source: FactorResearch
However, it is worth noting that such trading strategies are fickle things and prone to dramatic changes when model assumptions are tweaked. Naturally there are a lot of variables in this allocation framework like the country selection, yield curve definition, Value factor construction, transaction costs, amongst others. The results will be more sensitive to some variables while less sensitive to others.
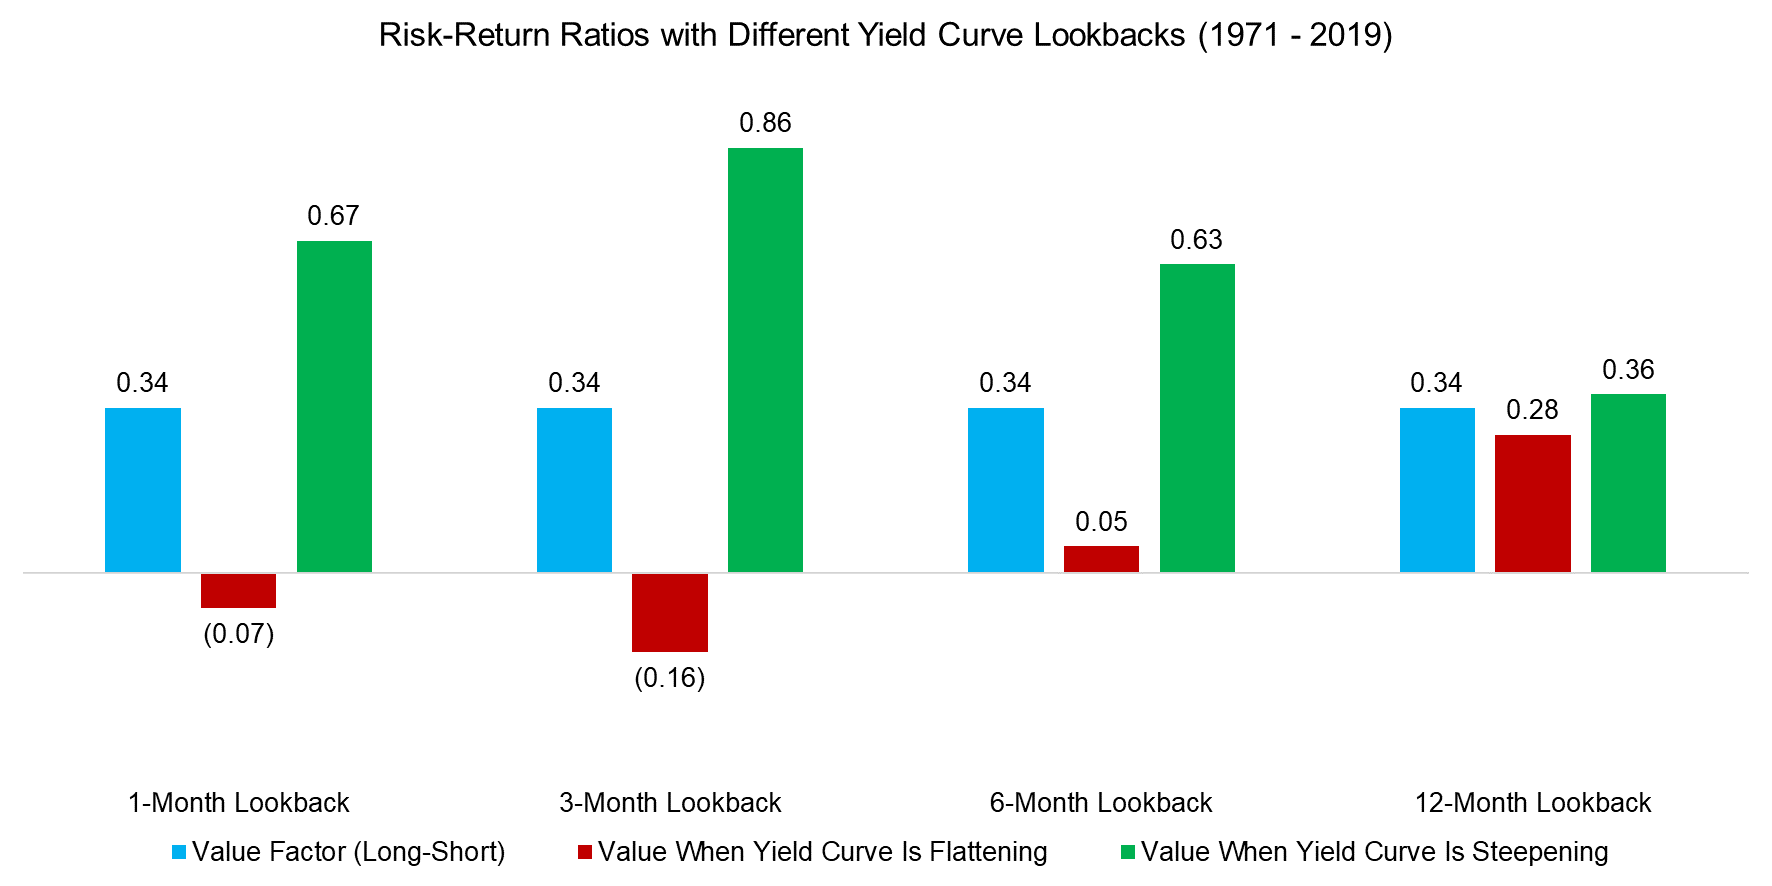
An important variable for calculating the yield curve z-score is the lookback period, where sensitivity analysis is useful. We change the perspective to risk-adjusted returns and observe that the conclusion from the initial results does not change significantly by reducing the lookback to one-month, which implies more frequent allocation changes, or increasing it to six months, which means fewer changes. However, a one-year lookback results in almost equal risk-return ratios, regardless if the yield curve was steepening or flattening. The longer the lookback, the more the informational value of the yield curve decays.
Source: FactorResearch
FURTHER THOUGHTS
Market skewness and the yield curve are metrics that effectively measure the risk sentiment, which is a key driver of the Value factor performance. Investors can combine these two metrics and other related ones into a multi-metric framework for harvesting higher risk-adjusted returns from the Value factor by allocating tactically rather than strategically.
However, although it would be challenging to create a robust allocation framework, it would be even more difficult to execute this consistently over the medium to long-term. There would be years of zero allocations to the Value factor, often where positive returns could have been achieved. Following the model is far easier said than done.
RELATED RESEARCH
ABOUT THE AUTHOR
Nicolas Rabener is the CEO & Founder of Finominal, which empowers professional investors with data, technology, and research insights to improve their investment outcomes. Previously he created Jackdaw Capital, an award-winning quantitative hedge fund. Before that Nicolas worked at GIC and Citigroup in London and New York. Nicolas holds a Master of Finance from HHL Leipzig Graduate School of Management, is a CAIA charter holder, and enjoys endurance sports (Ironman & 100km Ultramarathon).
Connect with me on LinkedIn or X.

