Improving the Odds of Value Investing
Tactical versus Strategic Allocations to Value
May 2021. Reading Time: 10 Minutes. Author: Nicolas Rabener.
SUMMARY
- The stock market volatility, skewness, and yield curve influence the performance of the value factor
- Investors require a certain market environment to buy troubled companies
- The key performance driver of the value factor is risk sentiment
INTRODUCTION
Ted Theodore first wrote about value versus momentum stocks way back in 1984, but almost 40 years later, there still is no real consensus among investors or academics on what is driving either strategy.
That’s not due to a lack of research. Thousands of papers have scrutinized equity factors across markets and asset classes, and some have analyzed strategies going back more than 200 years.
Part of the problem is that performance drivers have been identified but lack widespread acceptance from practitioners. That’s understandable. If what’s driving a strategy’s returns is crystal clear, fund managers will be out of work when the environment for their investment style turns unfavorable. They’re better off remaining publicly vague about performance drivers as that helps to retain their assets under management (AUM).
A second issue is that performance drivers are never crystal clear. Finance is not a hard science with immutable, gravity-like laws. Markets change continuously and historical performance and trends are not perfectly replicable. So when it comes to performance drivers, finance practitioners must live with relatively low standards of proof.
Our framework for determining a performance driver consists of four criteria:
- It should have a sound economic basis.
- It should work on average, but not all the time.
- It should be implementable.
- It should hold when tested across time, markets, and asset classes
So what is the value factor’s key performance driver? On what evidence do we base that determination?
WHAT IS DRIVING THE VALUE FACTOR?
The value factor generates positive returns when cheap stocks outperform expensive ones. So when does that happen? (read Mapping My Mind: Value Factor)
Cheap companies tend to be troubled companies. Otherwise, they wouldn’t trade at low valuations. Their issues might be temporal or structural: an overleveraged balance sheet or being part of an industry in decline, for example. Either way, investors will find these stocks uncomfortable to hold since the associated news flow and broker ratings will tend to be downbeat.
That means investors are most likely to risk buying questionable companies when they’re more confident about the economy and the stock markets. When the economy is heading into recession, investors tend to prefer companies with quality or growth characteristics. Put another way: Risk sentiment is the primary performance driver of the value factor.
There are many variables with which to measure risk sentiment. We focus on three: stock market volatility, stock market skewness, and the yield curve.
VALUE FACTOR & REALIZED STOCK MARKET VOLATILITY
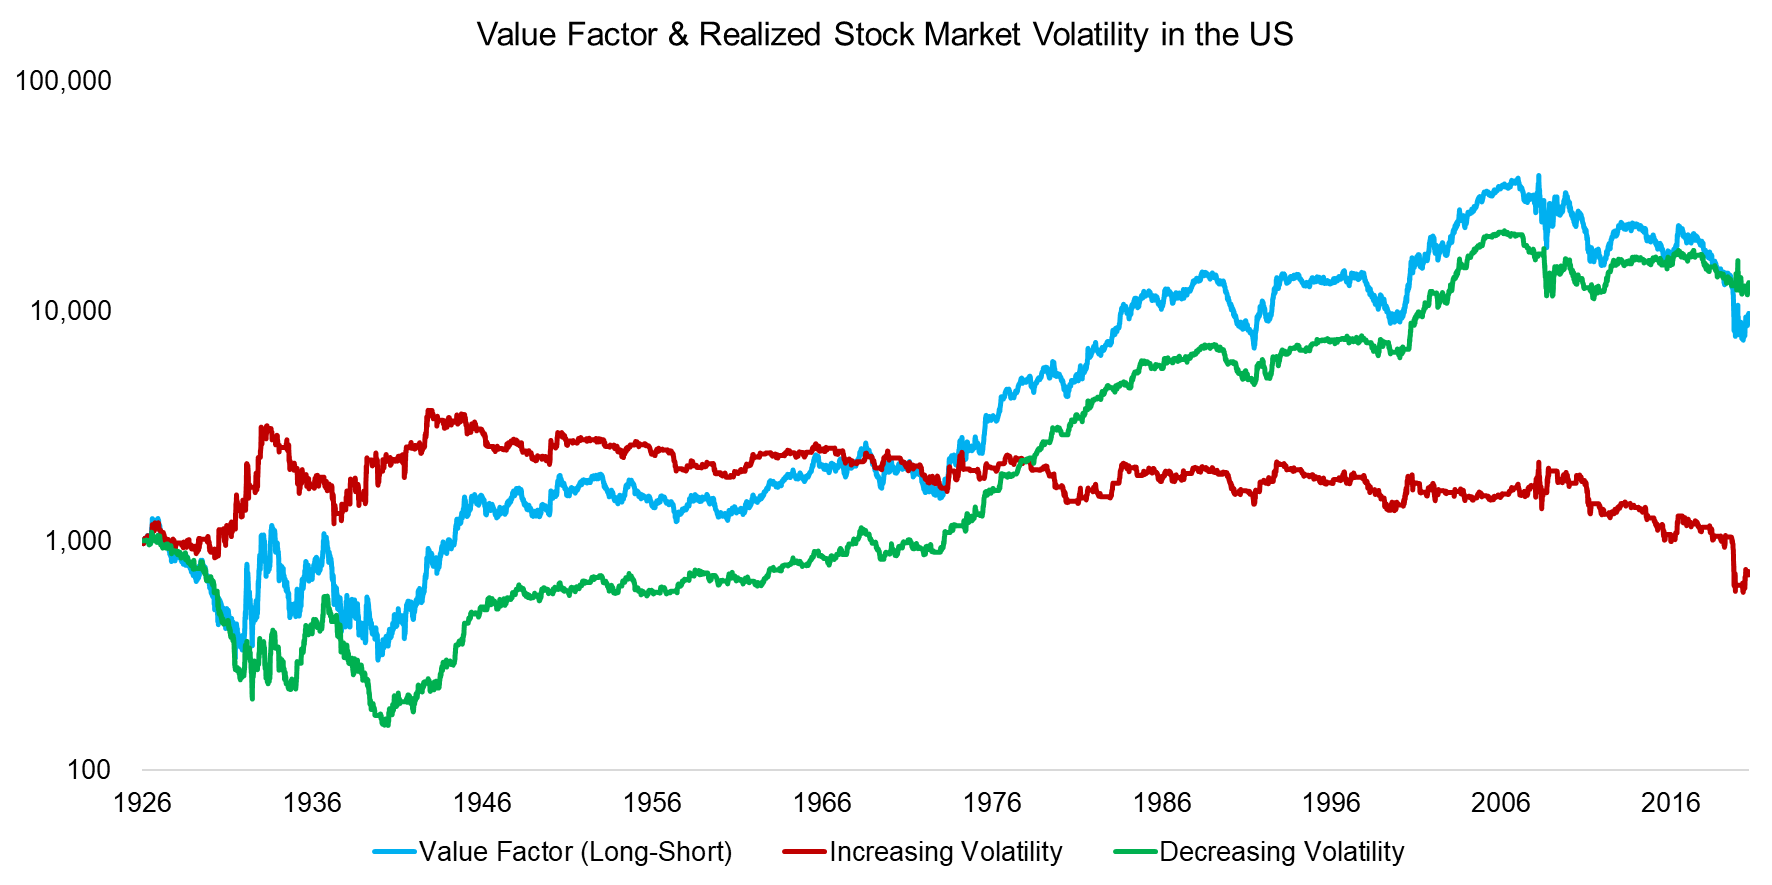
We constructed a value factor out of the cheapest and most expensive 10% of stocks in the US stock market as measured by price-to-book ratios using data from the Kenneth R. French Data Library. We then calculated the Z-score of stock market volatility using a three-month lookback.
Most of the value factor’s positive returns from 1926 to 2020 can be attributed to decreasing volatility. This relationship is not perfect, however: Between 1931 and 1943, value factor returns fell amid rising volatility. But from then on, returns were consistently negative when volatility was on the upswing.
Source: Kenneth R. French Data Library, FactorResearch
These results provide some support for the premise that risk sentiment is the key performance driver of the value factor: Stock market volatility tends to rise when economic volatility increases, which typically occurs as the economy deteriorates. Investors prefer lower-risk investments during such periods and thus tend to shun cheap stocks.
VALUE FACTOR & STOCK MARKET SKEWNESS
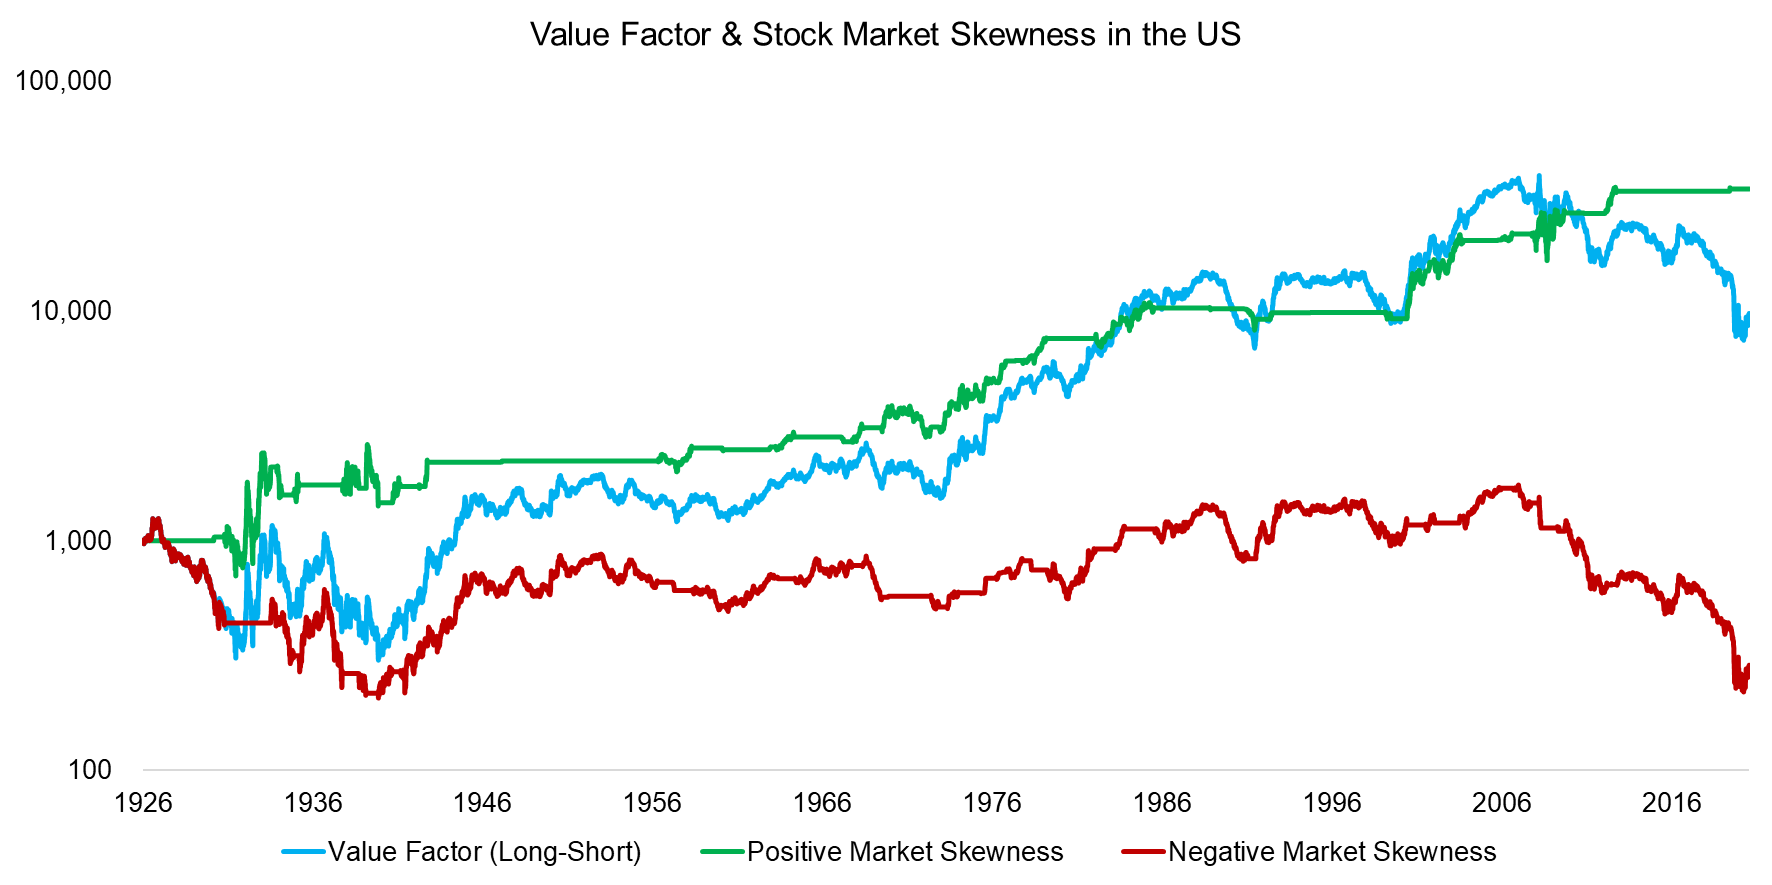
We next analyzed value factor returns in the context of stock market skewness, which we calculated with a 12-month lookback. Stock market skewness is a more abstract metric, but it simply implies that investors may be more cautious in the aftermath of a stock market crash.
With its long upward movements and few but steep downturns, the US stock market is more negatively than positively skewed over time. Almost all of the value factor’s positive returns occur amid periods of positive skewness, when no severe crashes have recently occurred. Investors feel safe and are more willing to bet on troubled firms.
Source: Kenneth R. French Data Library, FactorResearch
THE VALUE FACTOR & YIELD CURVE
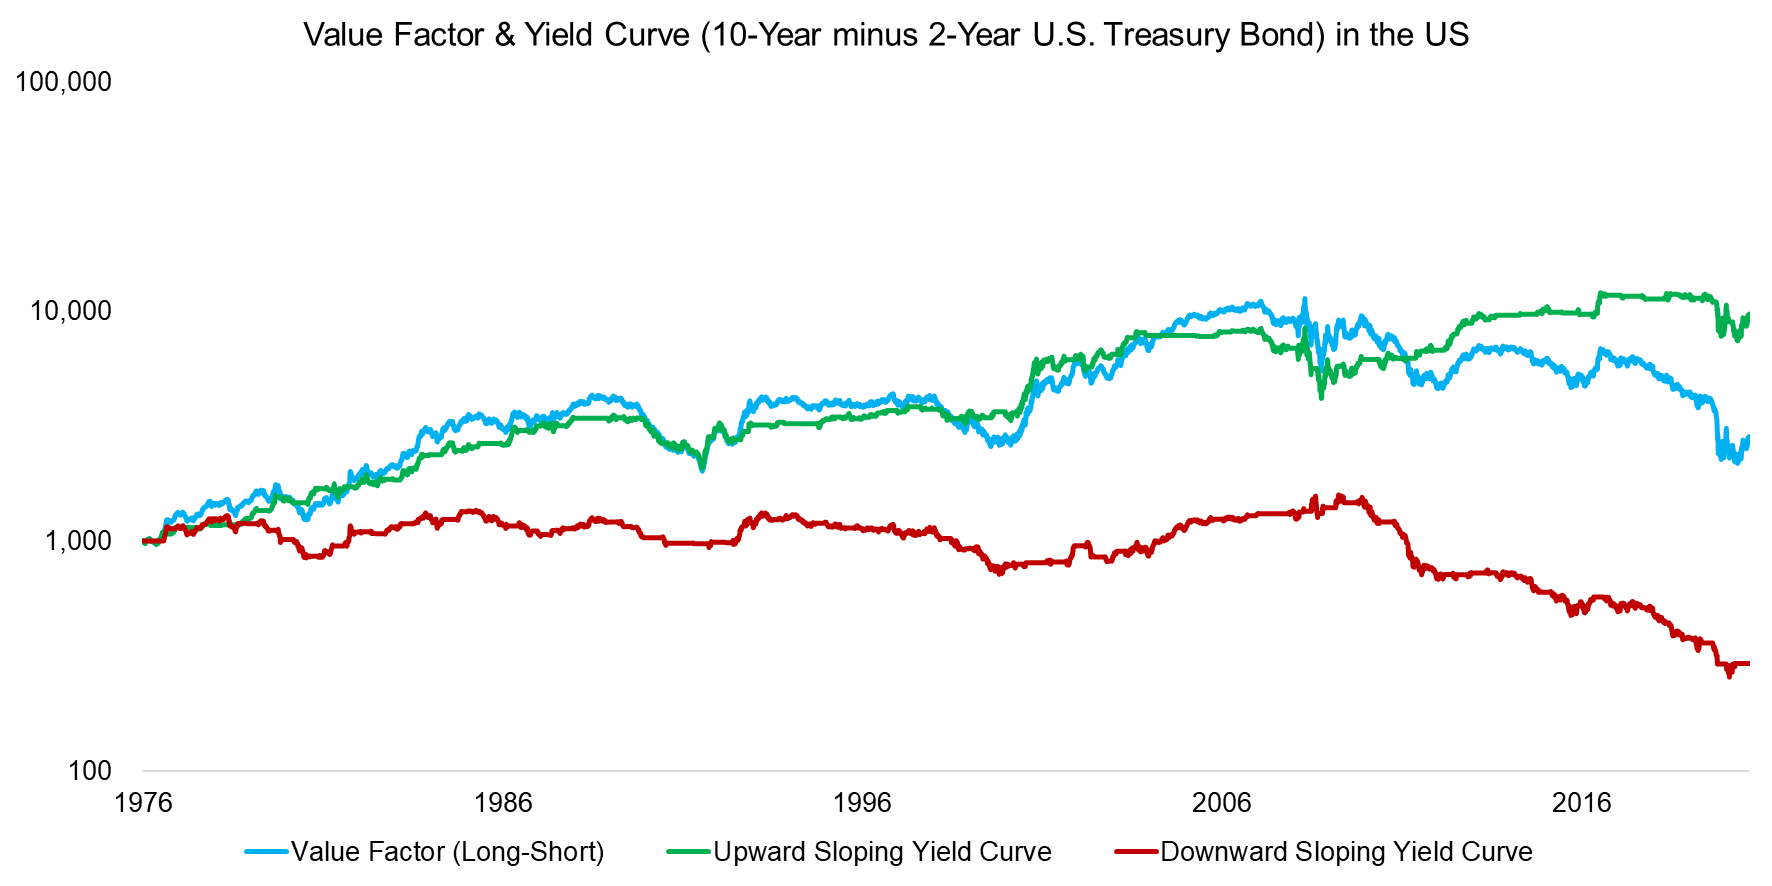
We calculated the yield curve as the difference between the 10-year and two-year US Treasury rates. A downward-sloping yield curve is associated with declining economic growth and an inverted yield curve interpreted as a leading indicator of recession. Unfortunately, the data only goes back to 1976, which limits the scope of our analysis.
We calculated the yield curve’s slope with a Z-score using a three-month lookback. We found that almost all the positive returns of the value factor occurred when the yield curve was upward sloping, or when economic conditions were more bullish.
Source: FRED, Kenneth R. French Data Library, FactorResearch
COMBINING METRICS FOR FACTOR RISK MANAGEMENT
Based on these findings, investors might consider applying these metrics to time the value factor. We recommend approaching this from a risk rather than a return perspective. That is, we advise focusing on avoiding significant drawdowns when the market environment for owning cheap stocks is more negative (read How Risky Are Value Stocks?).
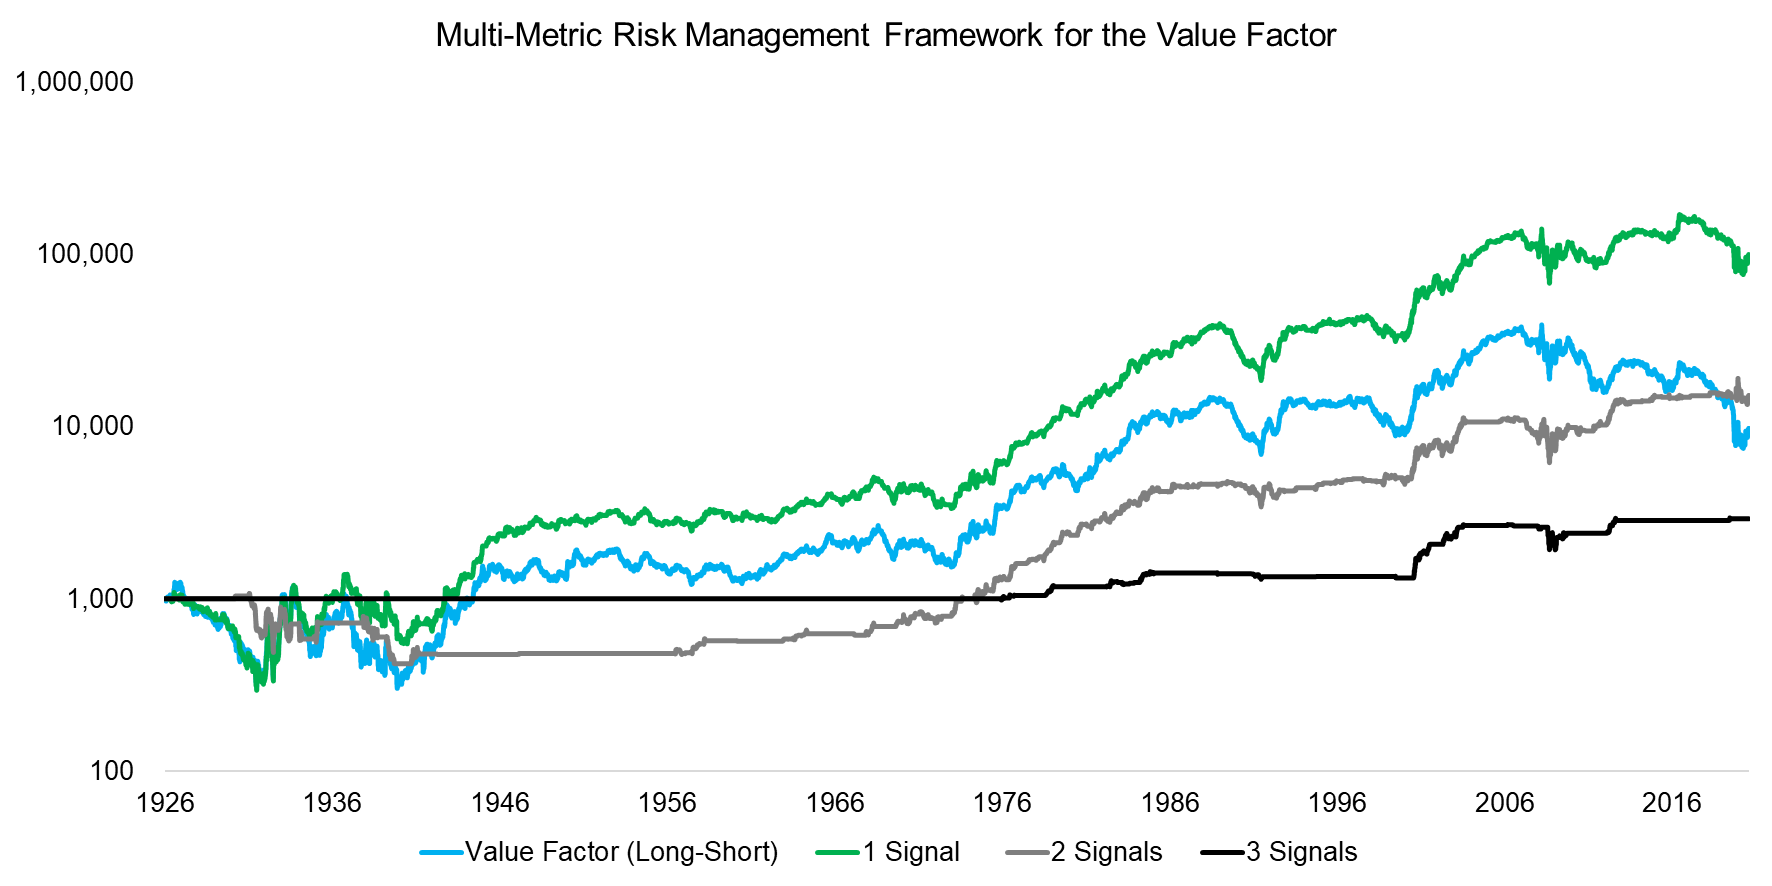
Our multi-metric risk management framework only allocated to the value factor when a combination of stock market volatility, market skewness, and yield curve were favorable. Specifically, we modeled three scenarios in which one, two, or three signals are required for a factor allocation. Without the required signals, zero-interest cash was held instead.
Given the limits of our yield curve data, three positive signals representing a market environment with falling market volatility, positive market skewness, and an upward-sloping yield curve was only possible since 1976.
Our findings are quite typical for multi-metric frameworks: The more filters, the more consistent the returns but the lower the exposure to the factor.
Requiring at least one positive signal generated returns comparable to that of the buy-and-hold value factor. However, with two or even three signals, returns were much more consistent with significantly reduced drawdowns. The overall returns were lower than those of the value factor due to both high cash allocations and the limited yield curve data.
Source: FRED, Kenneth R. French Data Library, FactorResearch
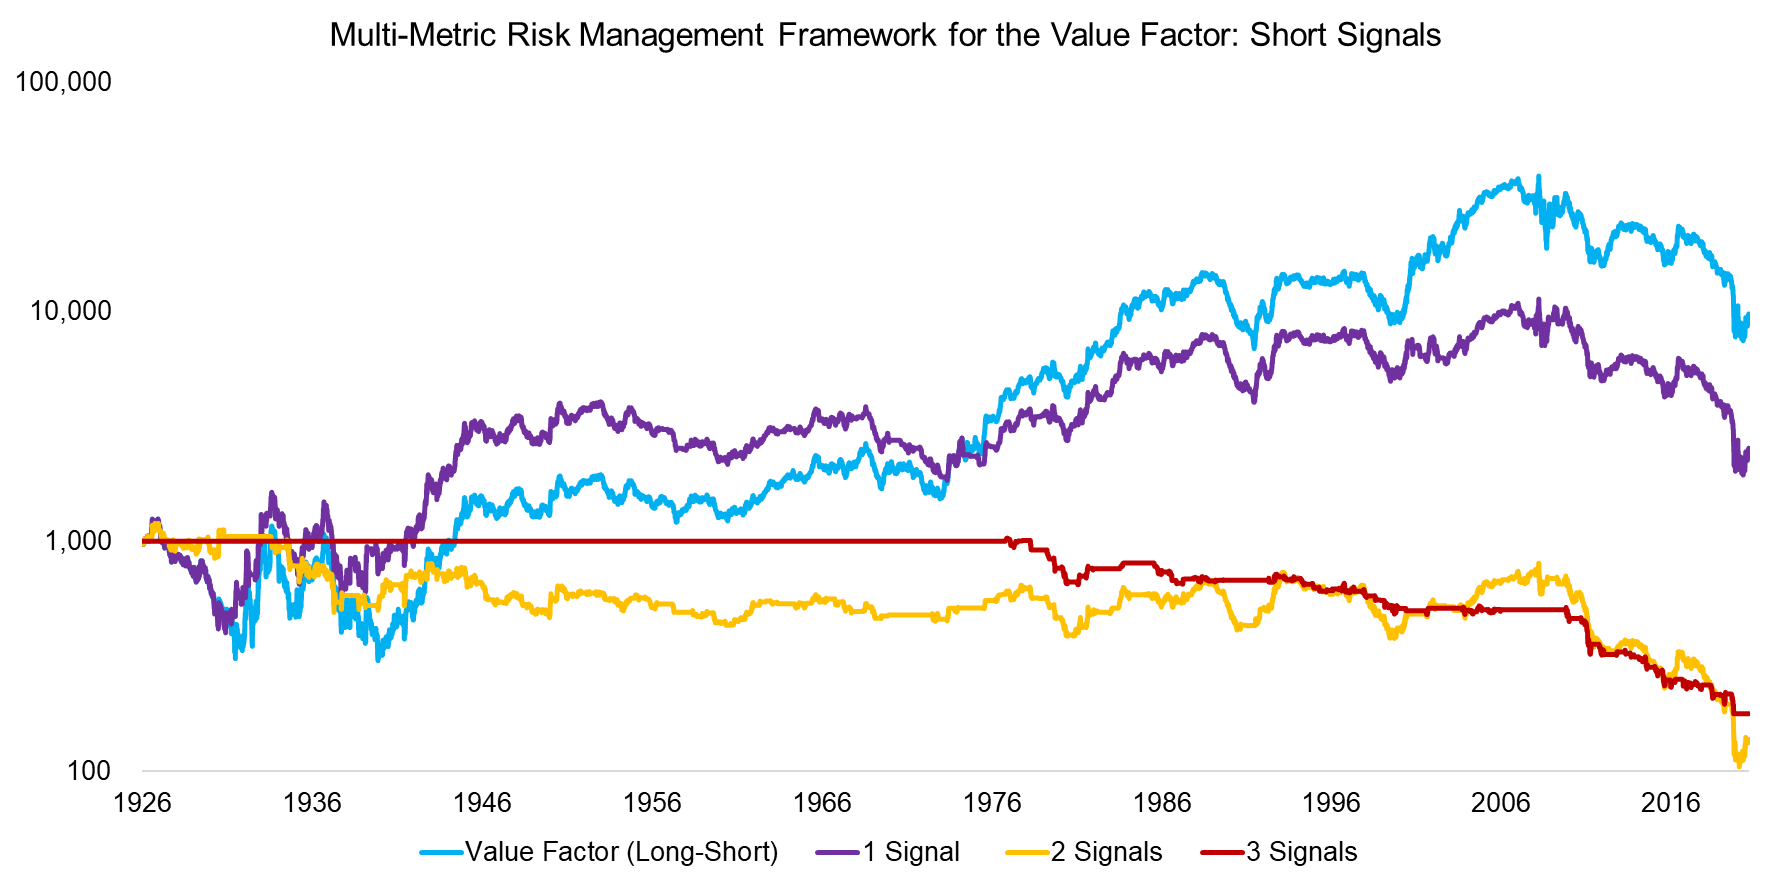
We also evaluated the performance of the value factor when the signals were negative. This could be used to potentially short the factor by buying expensive and selling cheap stocks.
A one-signal requirement generated performance in line with the buy-and-hold value factor. Two or three signals, on the other hand, yielded consistent losses, which represents a market environment of increasing volatility, negative market skewness, and a downward sloping yield curve.
Source: FRED, Kenneth R. French Data Library, FactorResearch
All told, this analysis is far from perfect. We have not thoroughly tested the framework for robustness. We could use price-to-earnings instead of price-to-book for stock selection, change the lookback periods, include transaction costs, apply the framework to international markets and other asset classes, and so on.
But we have used common risk-measurement variables and publicly available data, made few assumptions, and applied our method to more than 90 years of financial history. This provides some comfort in the significance of these results.
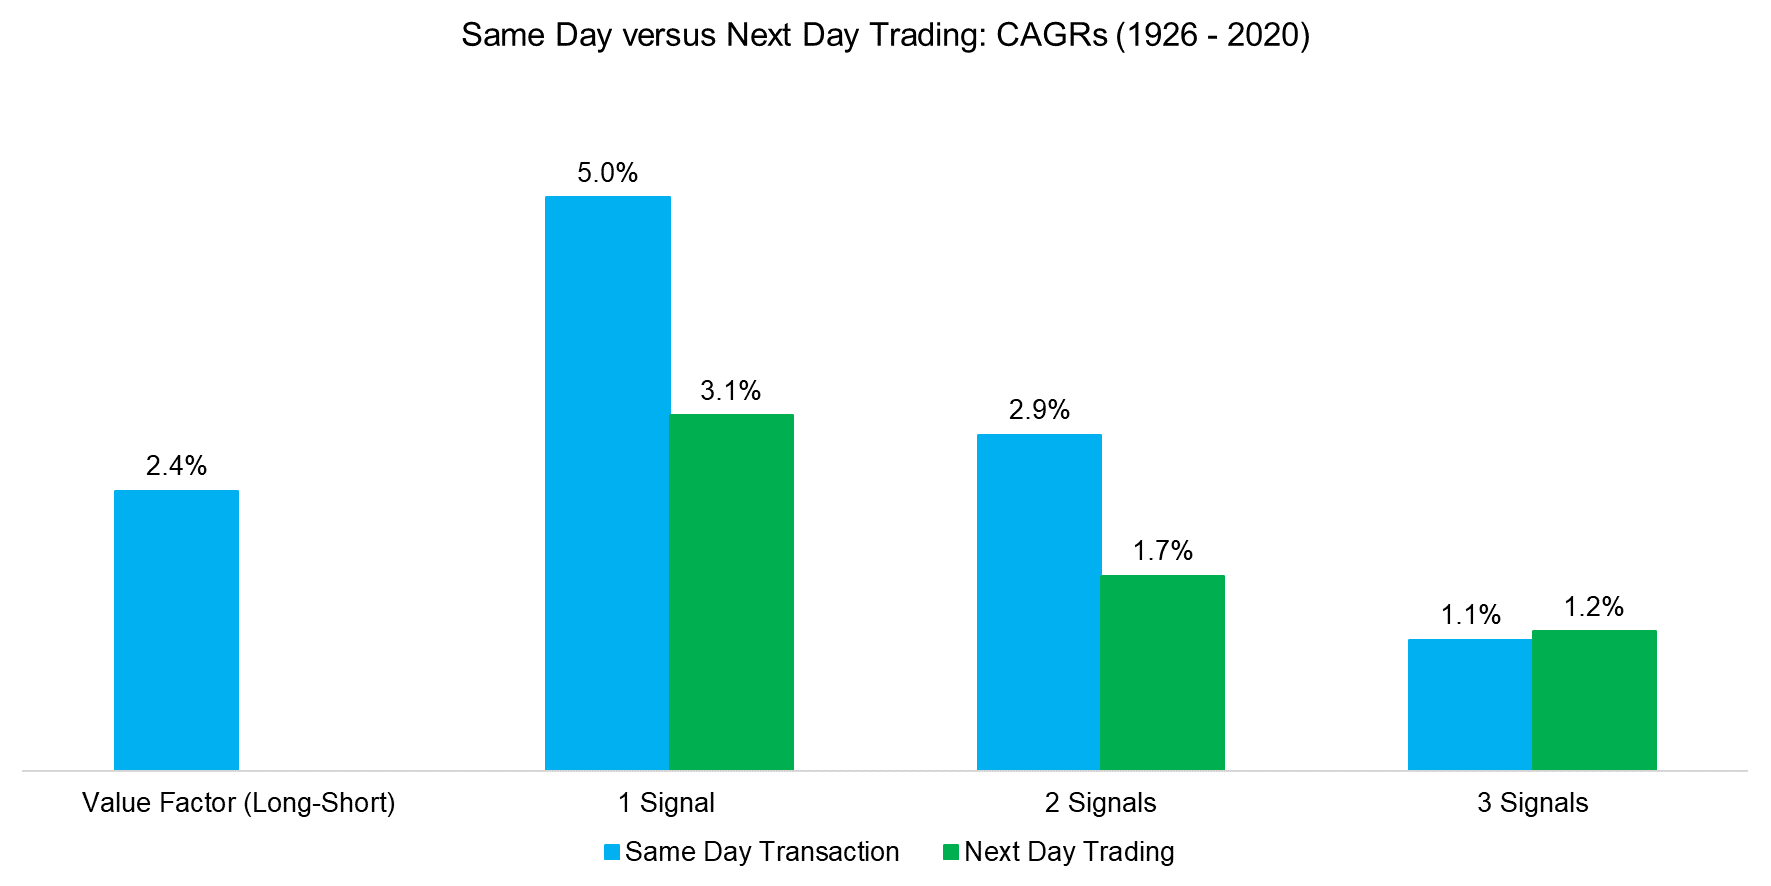
One clearly faulty assumption is our same-day application of the trading signals. This is impossible to implement since changes in the variables and stock markets occur simultaneously.
To make the signals more realistic, we analyzed what would occur if the trades were conducted the next day. That led to significant reductions in the CAGRs for the frameworks requiring one or two positive signals, but not for three positive signals.
Source: Kenneth R. French Data Library, FactorResearch
FURTHER THOUGHTS
Understanding what drives value factor performance is immensely helpful, but implementing a framework around those drivers is challenging. It will work on average, but not consistently.
And the more filters around investor risk sentiment metrics, the lower the actual allocation to the factor and the more often cash is held. Investors don’t like to be out of the market, especially when the value factor is performing well.
It’s great to know how to improve the odds of generating returns with cheap stocks, but it hardly makes value investing easy.
RELATED RESEARCH
The Value Factor’s Pain: Are Intangibles to Blame?
ABOUT THE AUTHOR
Nicolas Rabener is the CEO & Founder of Finominal, which empowers professional investors with data, technology, and research insights to improve their investment outcomes. Previously he created Jackdaw Capital, an award-winning quantitative hedge fund. Before that Nicolas worked at GIC and Citigroup in London and New York. Nicolas holds a Master of Finance from HHL Leipzig Graduate School of Management, is a CAIA charter holder, and enjoys endurance sports (Ironman & 100km Ultramarathon).
Connect with me on LinkedIn or X.

