Intersectional Model: Sorting 7 Factors
Searching for Jack of All Trades on the Stock Market
December 2017. Reading Time: 10 Minutes. Author: Nicolas Rabener.
SUMMARY
- Focusing purely on Value is a difficult strategy
- Sorting by multiple factors improves performance and risk-metrics
- However, factor selection and allocation remain challenging topics
INTRODUCTION
Value is likely the most common strategy for equity fund managers as the principle of buying something at a discount is intuitively appealing to human nature. However, pursuing a pure Value strategy is challenging as the stocks in the portfolio are by nature unpleasant to hold. These tend to be companies that lack a sound corporate strategy, have declining sales and earnings, feature incompetent management, are too highly indebted, or have some other reason that explains why the stocks are trading cheaply. Given that holding pure Value stocks is emotionally difficult, most fund managers add other factors in order to make the portfolio more palatable. In this short research note we will analyse the effect of adding six further factors to a Value portfolio, thus making it a multi-factor portfolio.
METHODOLOGY
There are three types of multi-factor models:
- Combination model: Single factor portfolios are created and combined into one portfolio
- Intersectional model: Stocks are ranked by several factors simultaneously
- Sequential model: Stocks are sorted by factors sequentially
In this research report we will use the intersectional model by sorting stocks for several factors simultaneously, i.e. looking for the stocks in the intersection of the variables. We focus on seven factors namely Value, Size, Momentum, Low Volatility, Quality, Growth and Dividend Yield. The factors are created by constructing long-short beta-neutral portfolios of the top and bottom 10% of stocks of the US stock market. Portfolios rebalance monthly, allocate equally between factors and include 10bps of transaction costs.
VALUE VS VALUE & SIZE
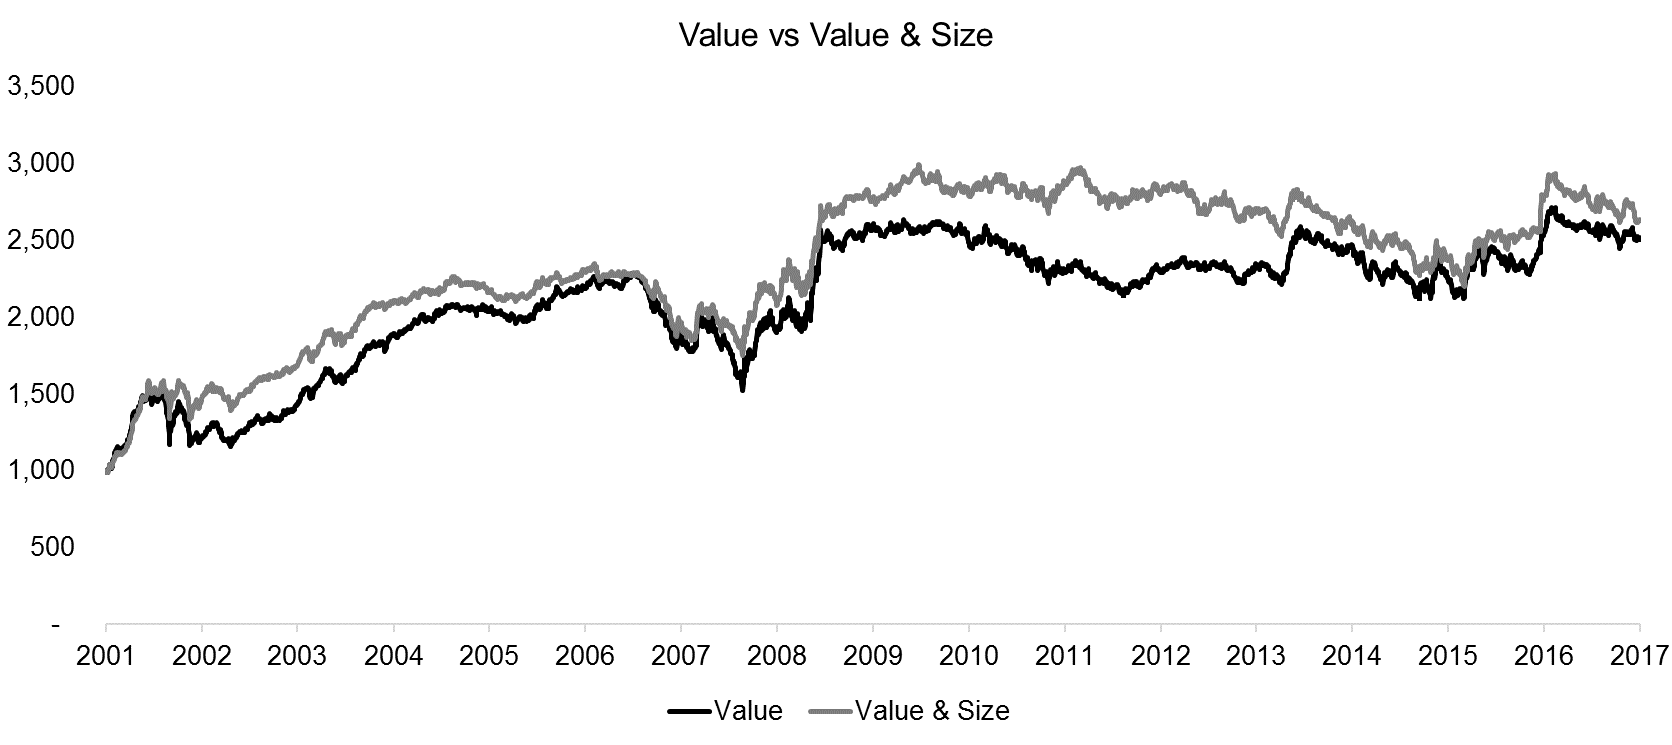
There is a large amount of research on the Value and Size factors given that these are part of the three-factor Fama-French model that created the foundation of factor investing. Although the Size factor has not generated attractive returns after it was identified by Banz in 1981, there is empirical evidence that the Value strategy performs stronger in the small and mid capitalisation space (please see our report Factor Returns: Small vs Large Caps). The chart below shows the performance of the Value factor versus sorting for Value and Size simultaneously with equal weights, which results in a portfolio of cheap and small stocks on the long side and expensive and large stocks on the short side. We can observe that this would have improved the performance of the Value factor only marginally for the period from 2001 to 2017.
Source: FactorResearch
VALUE VS VALUE & SIZE & MOMENTUM
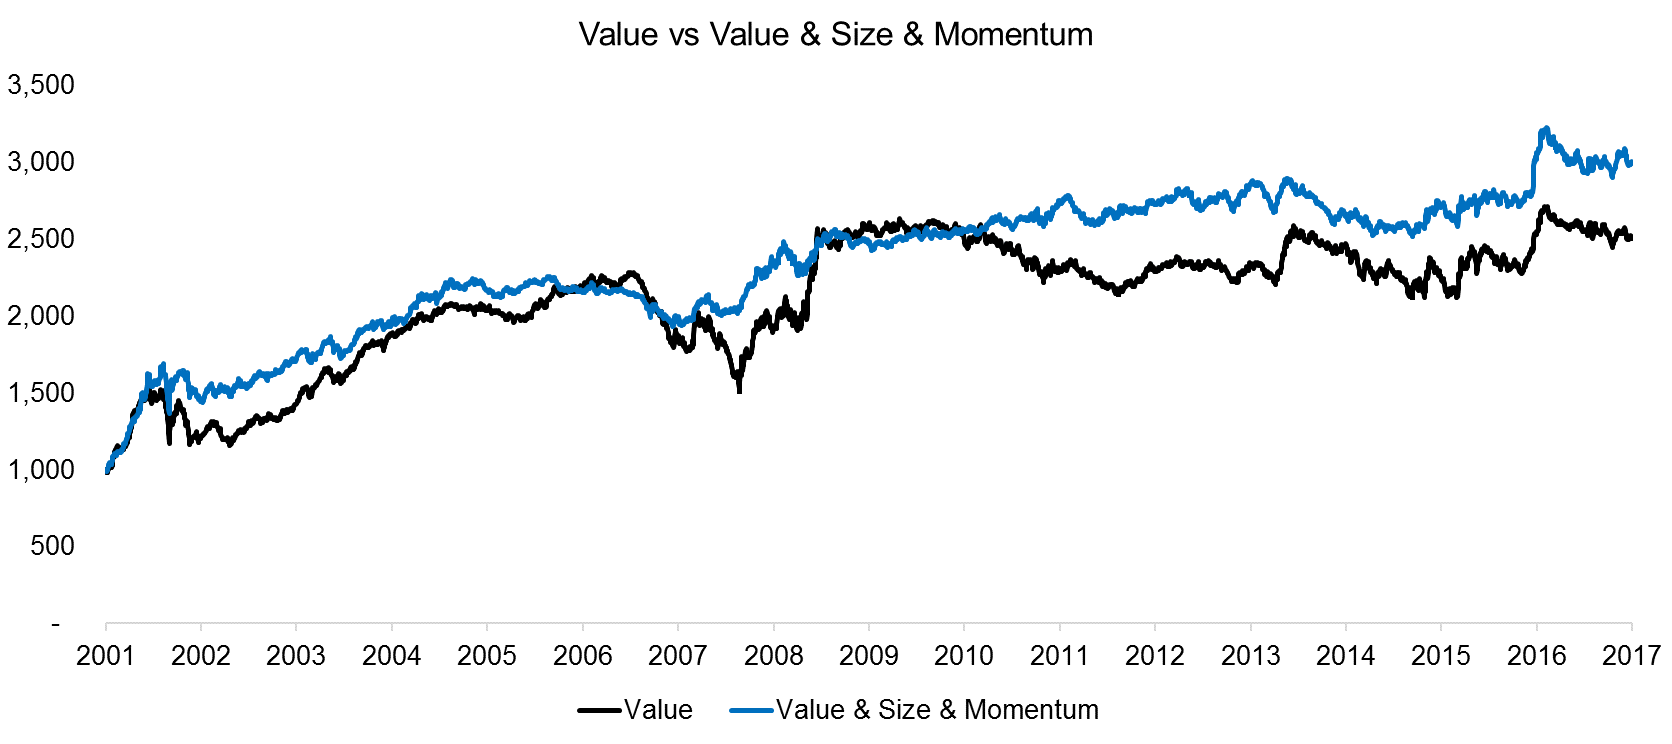
The chart below shows the result of ranking stocks for the Value, Size and Momentum factors simultaneously, i.e. the long portfolio would feature cheap, small and strong performing stocks. We can observe that the profile still looks comparable to the Value factor, but with slightly lower drawdowns, highlighting diversification benefits.
Source: FactorResearch
VALUE VS VALUE & SIZE & MOMENTUM & LOW VOLATILITY
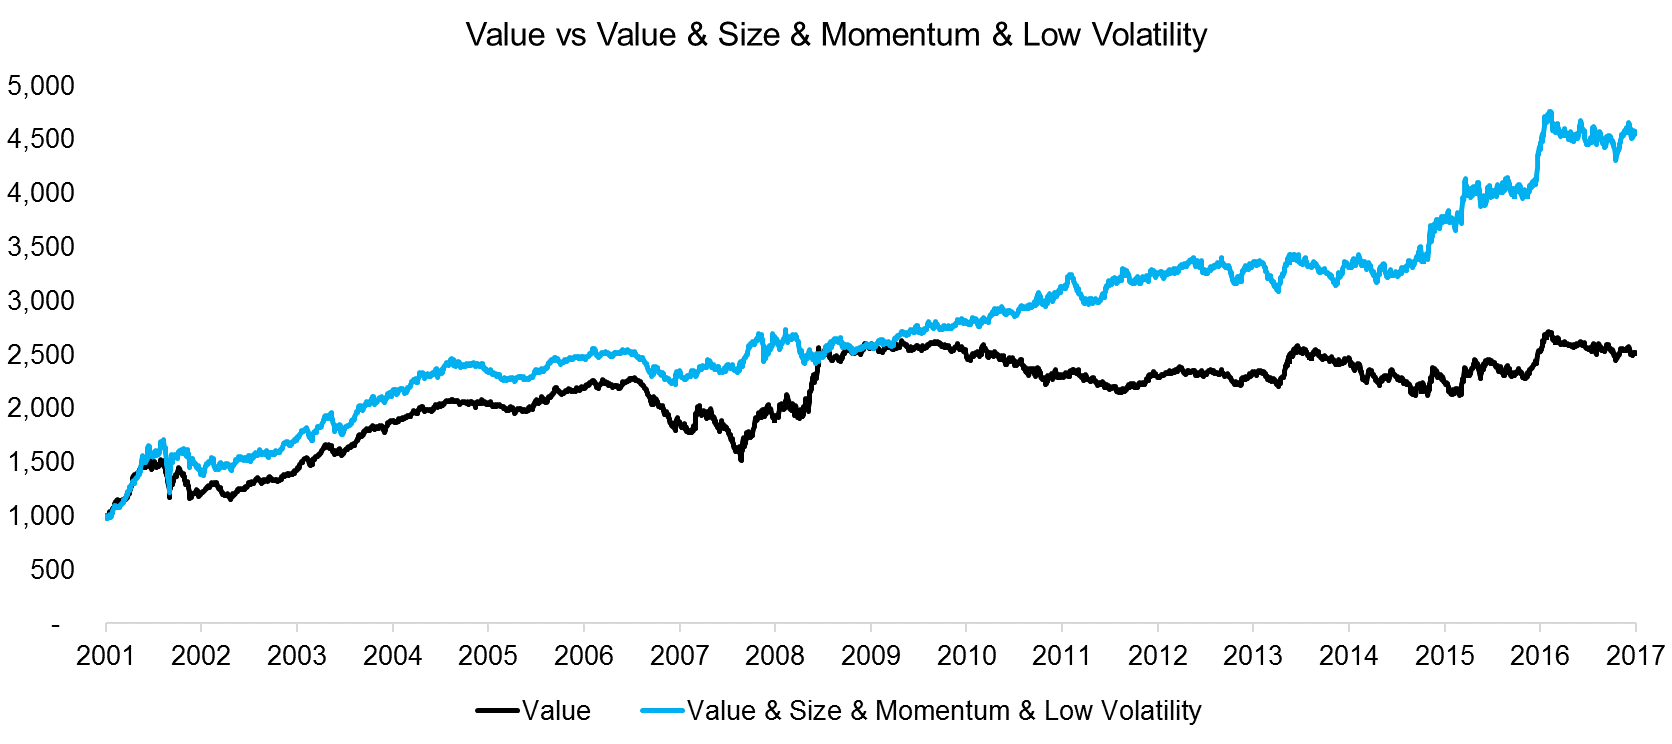
The Low Volatility factor is added next, which has a much larger impact than adding Size or Momentum. We can observe a further reduction in drawdowns and a much higher performance, which is to be expected given that the Low Volatility factor generated the strongest returns compared to the other factors for the period from 2001 to 2017.
Source: FactorResearch
VALUE VS VALUE & SIZE & MOMENTUM & LOW VOLATILITY & QUALITY
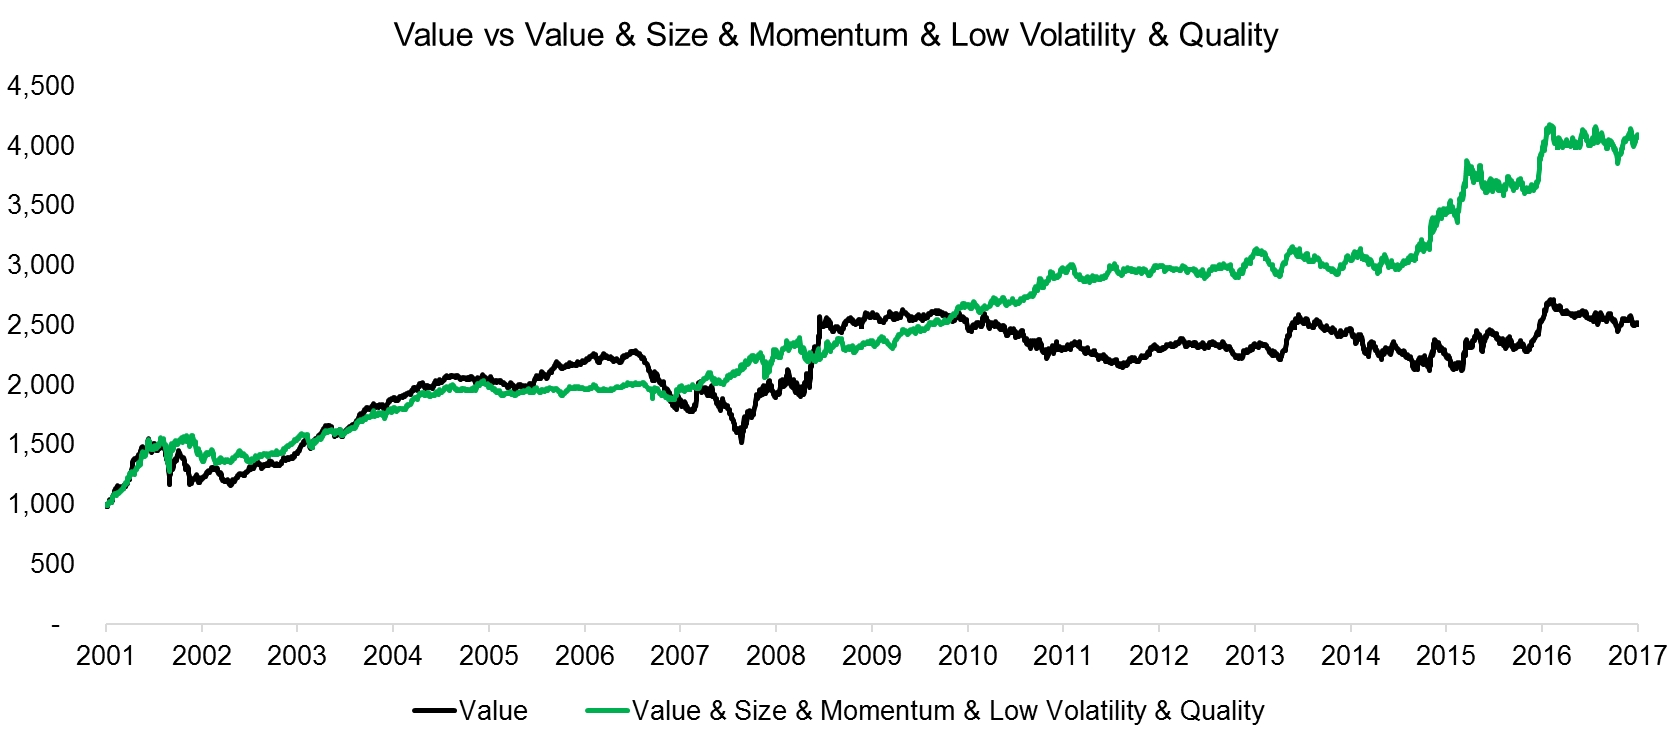
Quality, which is defined as combination between debt-to-equity and return-on-equity ratios, is the fifth factor that is added to the multi-factor portfolio. We can observe no significant change to the previous portfolio, which can be explained by that the Quality factor generated almost zero returns since 2001 (please see our research report Quality Factor: Zero Alpha for Most Investors?).
Source: FactorResearch
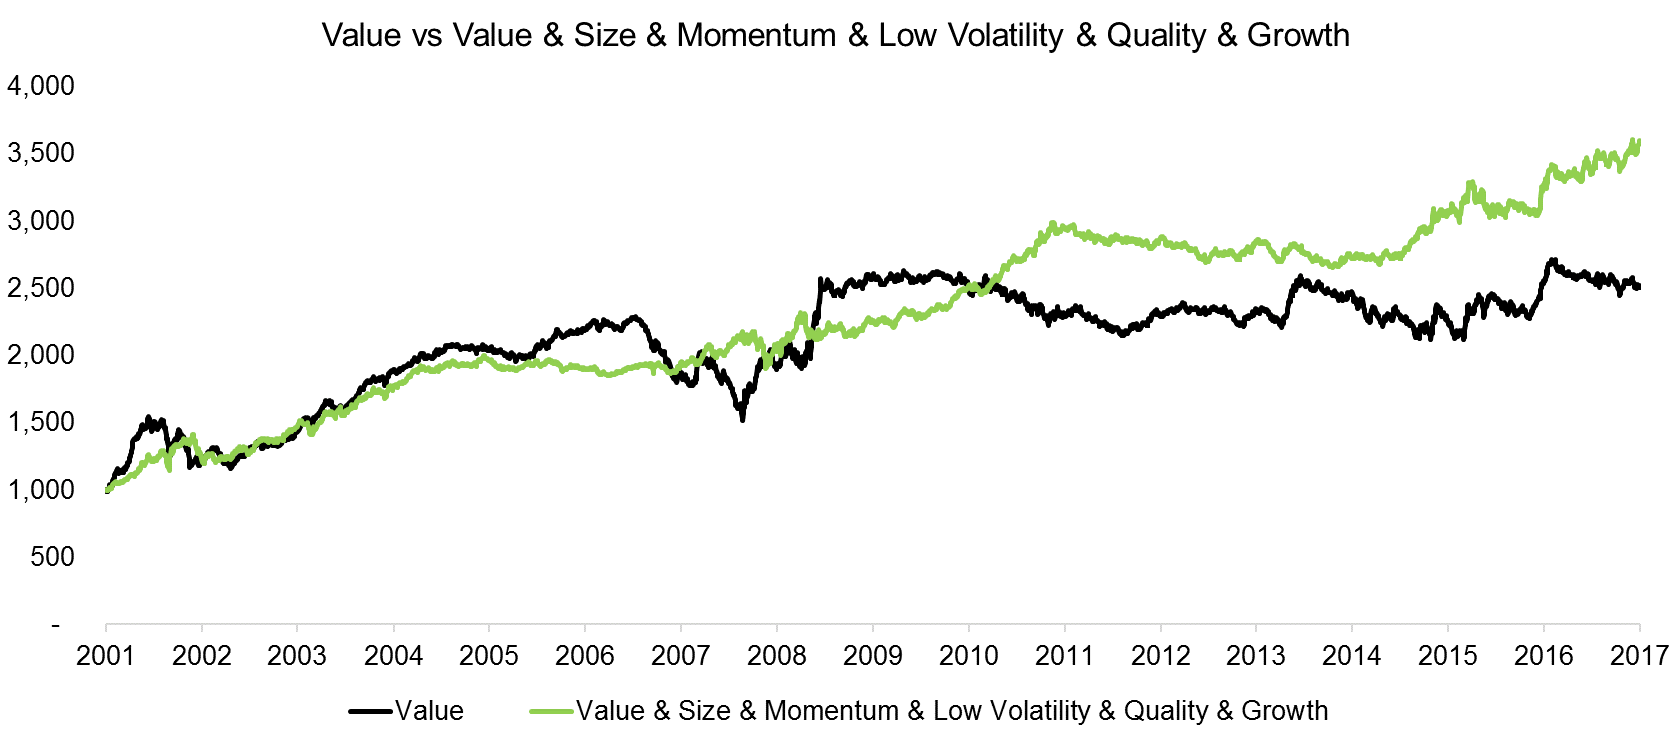
VALUE VS VALUE & SIZE & MOMENTUM & LOW VOLATILITY & QUALITY & GROWTH
Adding Growth, which we define as a combination of the three-year sales and earnings per share growth, as a sixth factor changes the profile only slightly. It is worth highlighting that the Quality and Growth factors have been highly correlated over recent years, implying that we have added more of the same stocks.
Source: FactorResearch
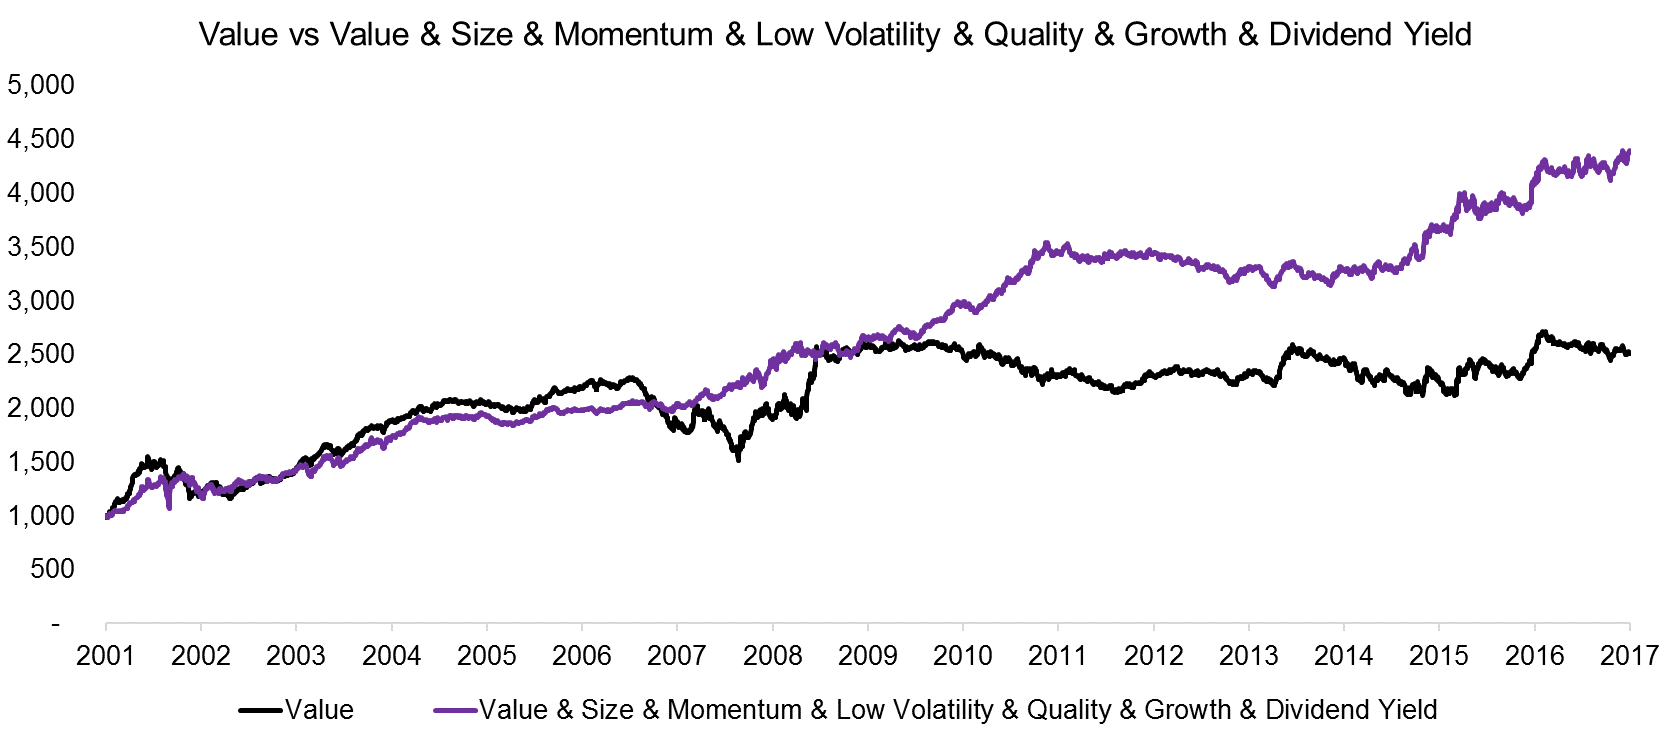
VALUE VS VALUE & SIZE & MOMENTUM & LOW VOLATILITY & QUALITY & GROWTH & DIVIDEND YIELD
The final factor to be added is Dividend Yield, which results in a portfolio that features cheap, small, low volatile, high quality and growing companies with a high dividend yield on the long side. It is surprising that adding the Dividend Yield factor improved the performance of the portfolio given that the factor has not performed well in recent years. It is also worth highlighting that the multi-factor portfolio seems highly correlated to the Value factor from 2001 to 2006, which seems unusual given that the weight of Value is only 14%. The reason for the similarity is that three additional factors namely Size, Low Volatility and Dividend Yield showed similar strong returns for that time period. The Value factor and these three suffered significant drawdowns in the Tech bubble around 2000 and recovered as a group thereafter.
Source: FactorResearch
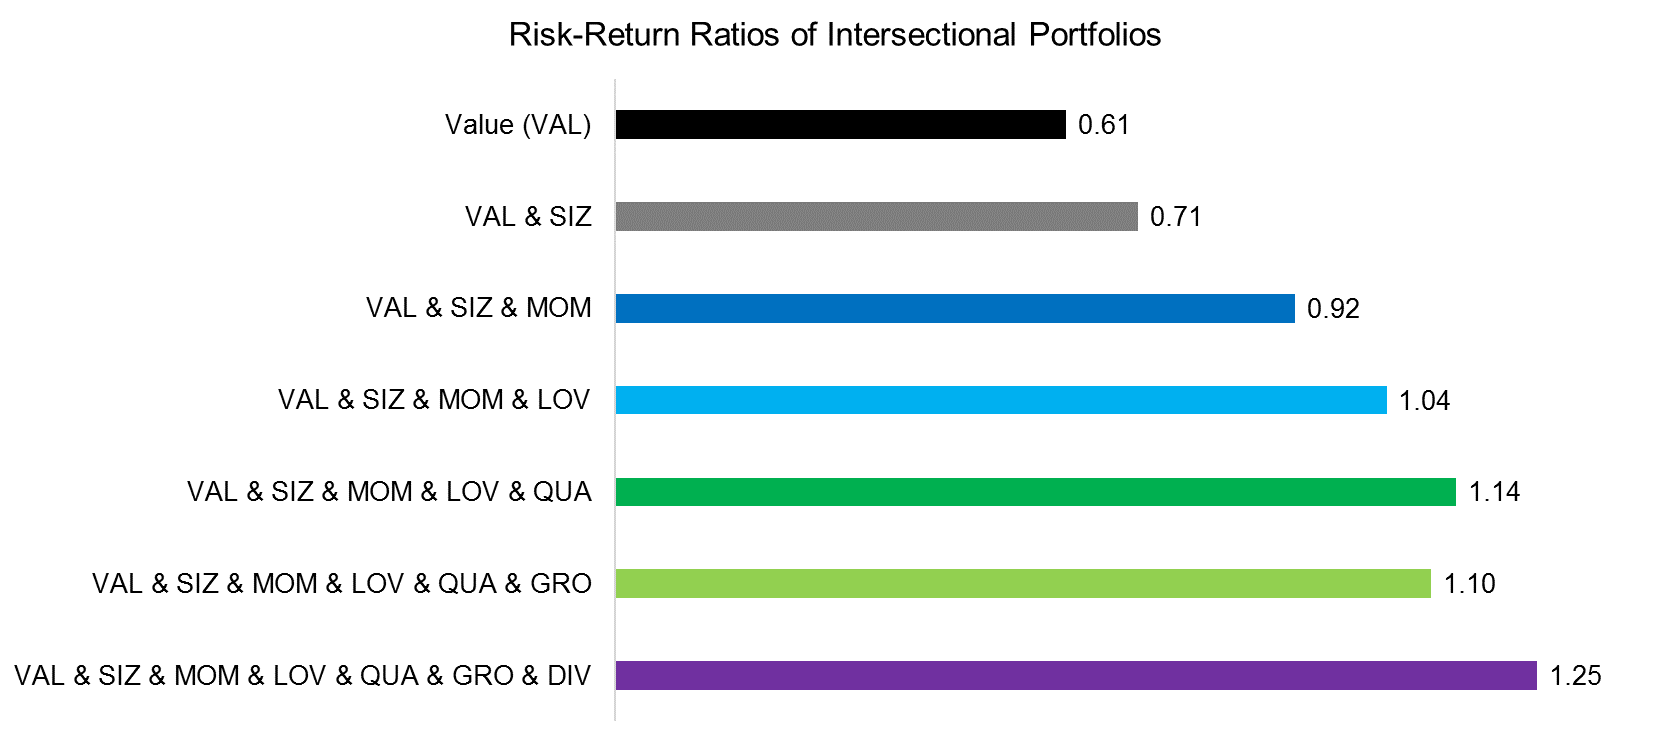
RISK-RETURN RATIOS OF VALUE VS MULTI-FACTOR PORTFOLIOS
The chart below shows the risk-return ratios of the Value factor versus the multi-factor portfolios derived from ranking stocks for several factors simultaneously. We can observe an almost monotonous increase in the risk-return ratio from adding additional factors.
Source: FactorResearch
FURTHER THOUGHTS
This short research note highlights that ranking stocks for several factors simultaneously can significantly improve performance and risk-return ratios. Naturally the question is which factors should be added and the results of this analysis will likely change when replicated over a different time period or in a different country. Investors might rely on factors with strong empirical support, although this approach also has challenges, e.g. the Size factor has not generated attractive returns since it was identified. We believe a sound factor allocation model comprises factors that are supported by a strong rationale and is combined with a solid risk management framework (hint: we are writing a white paper on this topic).
ABOUT THE AUTHOR
Nicolas Rabener is the CEO & Founder of Finominal, which empowers professional investors with data, technology, and research insights to improve their investment outcomes. Previously he created Jackdaw Capital, an award-winning quantitative hedge fund. Before that Nicolas worked at GIC and Citigroup in London and New York. Nicolas holds a Master of Finance from HHL Leipzig Graduate School of Management, is a CAIA charter holder, and enjoys endurance sports (Ironman & 100km Ultramarathon).
Connect with me on LinkedIn or X.

