Intersectional vs Sequential Multi-Factor Models
And the winner is?
- The intersectional and sequential multi-factor models generate comparable results
- The sequential ordering of factors matters less than expected
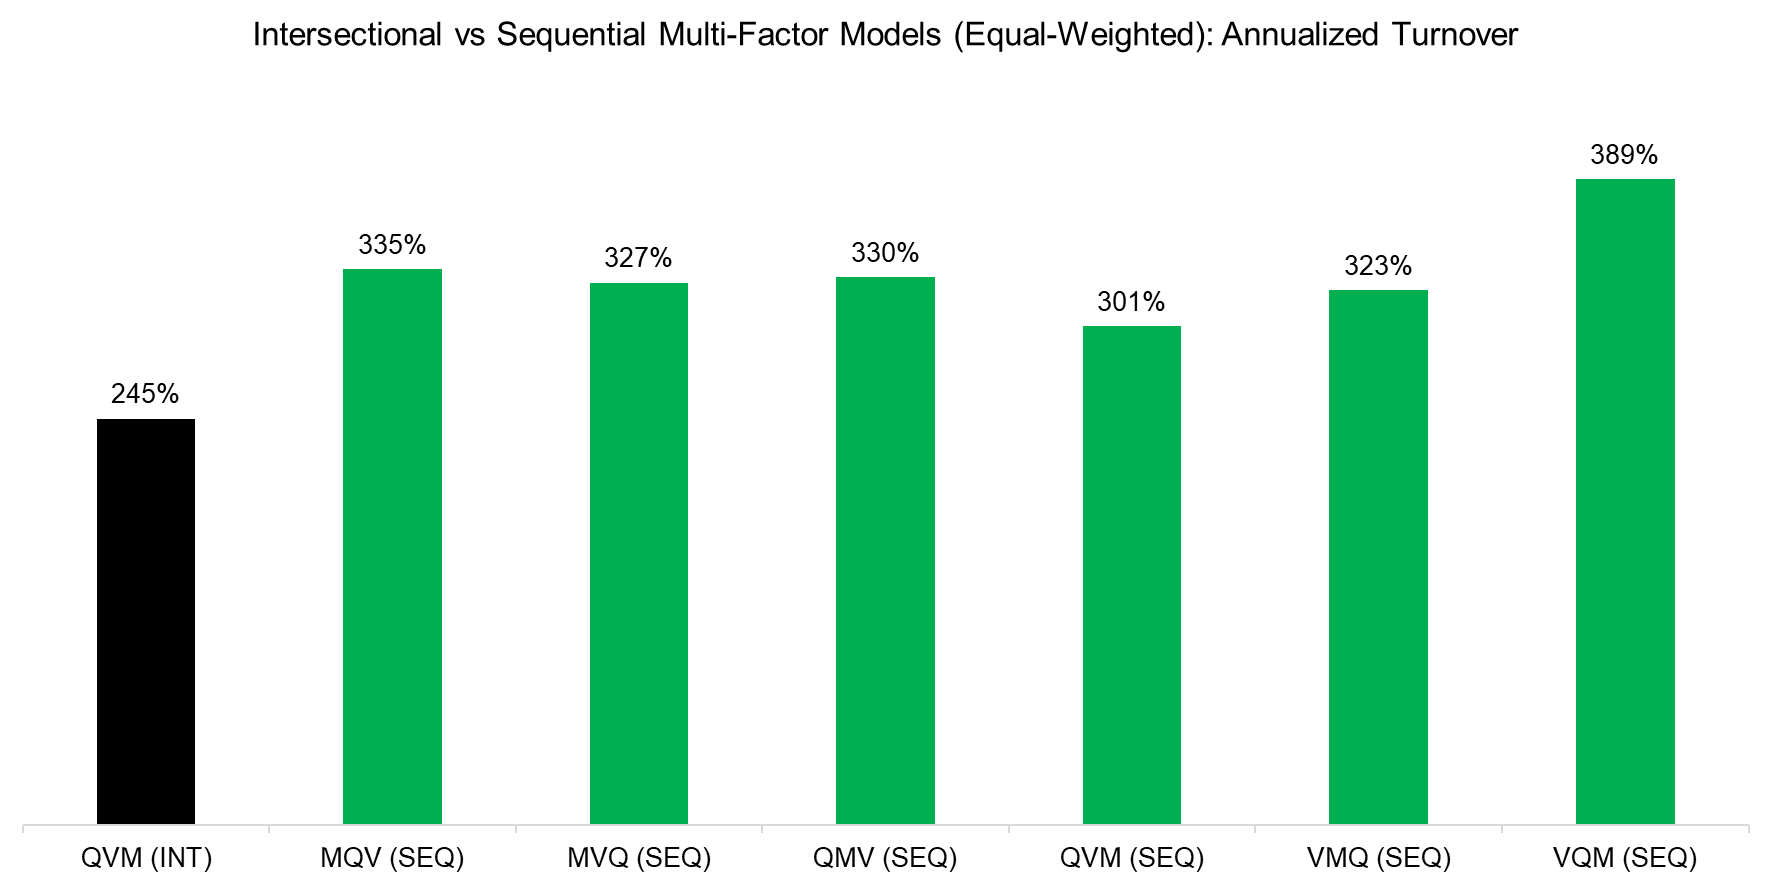
- The intersectional model features lower turnover
INTRODUCTION
Pursuing factor investing is a bit like crafting the perfect dish: it requires a solid base, a careful balance of salty and sweet, and just the right hint of umami. In the world of stock selection, this translates to identifying stocks that outperform the market, aren’t overly expensive, exhibit high-quality traits, and maintain below-average volatility. As in cooking, achieving this blend is no easy task.
Investors often turn to smart beta ETFs for factor exposures. However, these products can carry conflicting factor tilts, which may cancel each other out at the portfolio level (read Factor Exposure Analysis 114: Factor Offsetting). A more effective approach is to build customized portfolios tailored to specific factor goals (read Smart Beta ETF vs Customized Factor Portfolios).
There are three main methods for constructing multi-factor portfolios using stocks: the combination model, the intersectional model, and the sequential model (read Multi-Factor Models 101). Since the combination model often results in the same factor offsetting issue, we will set it aside.
In this research article, we focus on comparing the intersectional and sequential models to understand their respective advantages and trade-offs.
PERFORMANCE COMPARISON
Our analysis focuses on selecting U.S. stocks based on three key factors: quality (Q), value (V), and momentum (M). We construct portfolios using the top 100 stocks meeting these criteria, each with a minimum market capitalization of $1 billion, and rebalance them monthly with 10 bps of transaction costs.
We compare two multi-factor approaches:
- The intersectional model (also known as the integrated model) selects stocks with high average exposure across all three factors.
- The sequential model applies a step-by-step filtering process: it ranks stocks on one factor, narrows the universe, then ranks the remaining stocks on a second factor, and finally selects the top stocks based on the third. With three factors, this approach results in six possible factor orderings.
Each multi-factor portfolio is equally weighted across its 100 selected stocks. We calculate excess returns by subtracting the return of an equal-weighted market index.
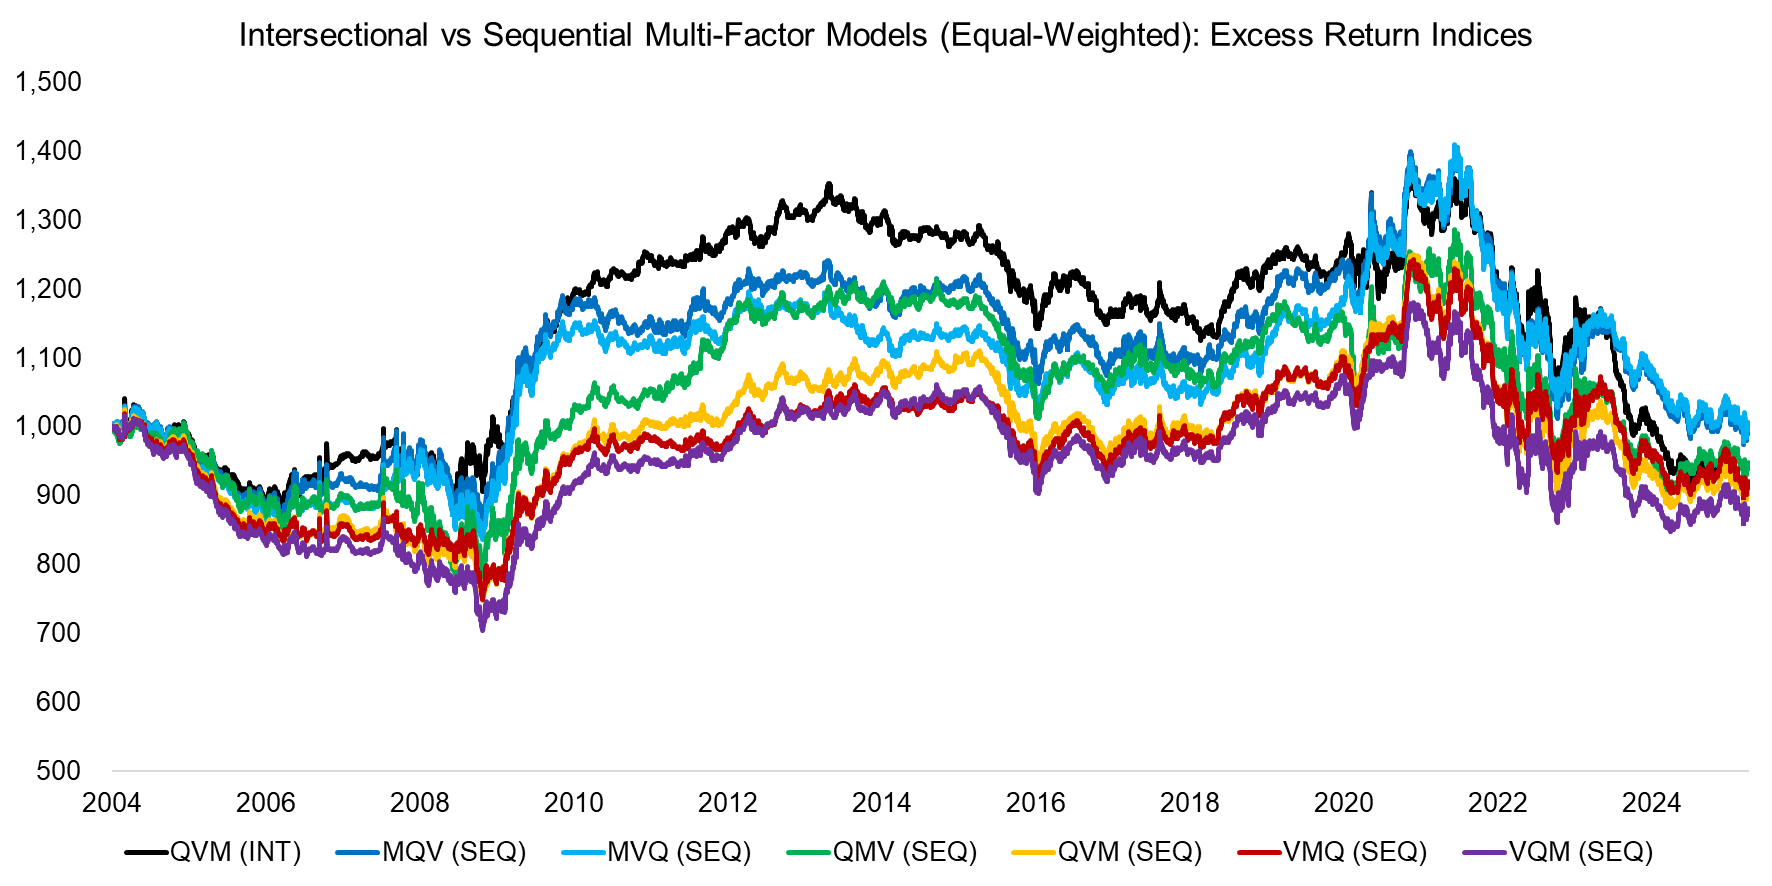
Our findings show that combining quality, value, and momentum (QVM) stocks did not generate positive excess returns over the past 20 years – regardless of whether the intersectional or sequential model was used. Additionally, the performance trends across all seven portfolios (the six sequential combinations plus the intersectional model) were strikingly similar.
Source: Finominal
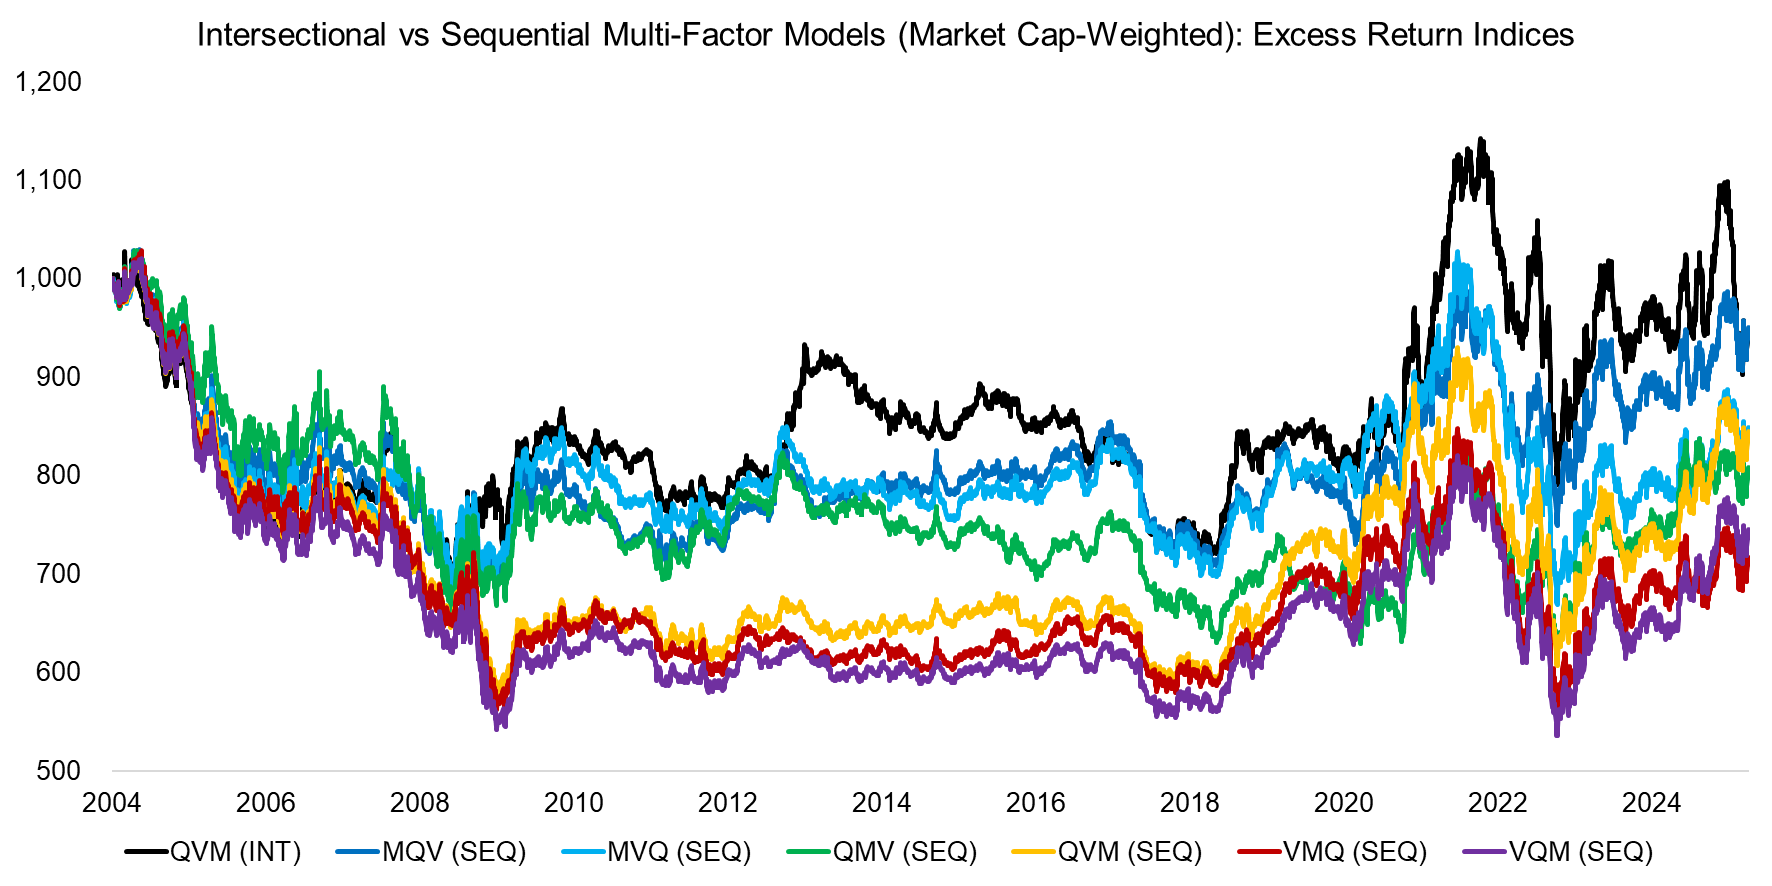
Next, we examine whether switching from equal weighting to market capitalization weighting alters the results. While this adjustment led to more divergent returns across the portfolios during the 2004 to 2025 period, the overall performance trends remained consistent among the seven portfolio combinations and there was no significant difference between the intersectional and sequential porfolios. The excess returns compared to the market cap-weighted U.S. stock market were significantly lower than when using equal-weighting for portfolio construction.
Source: Finominal
SHARPE RATIOS
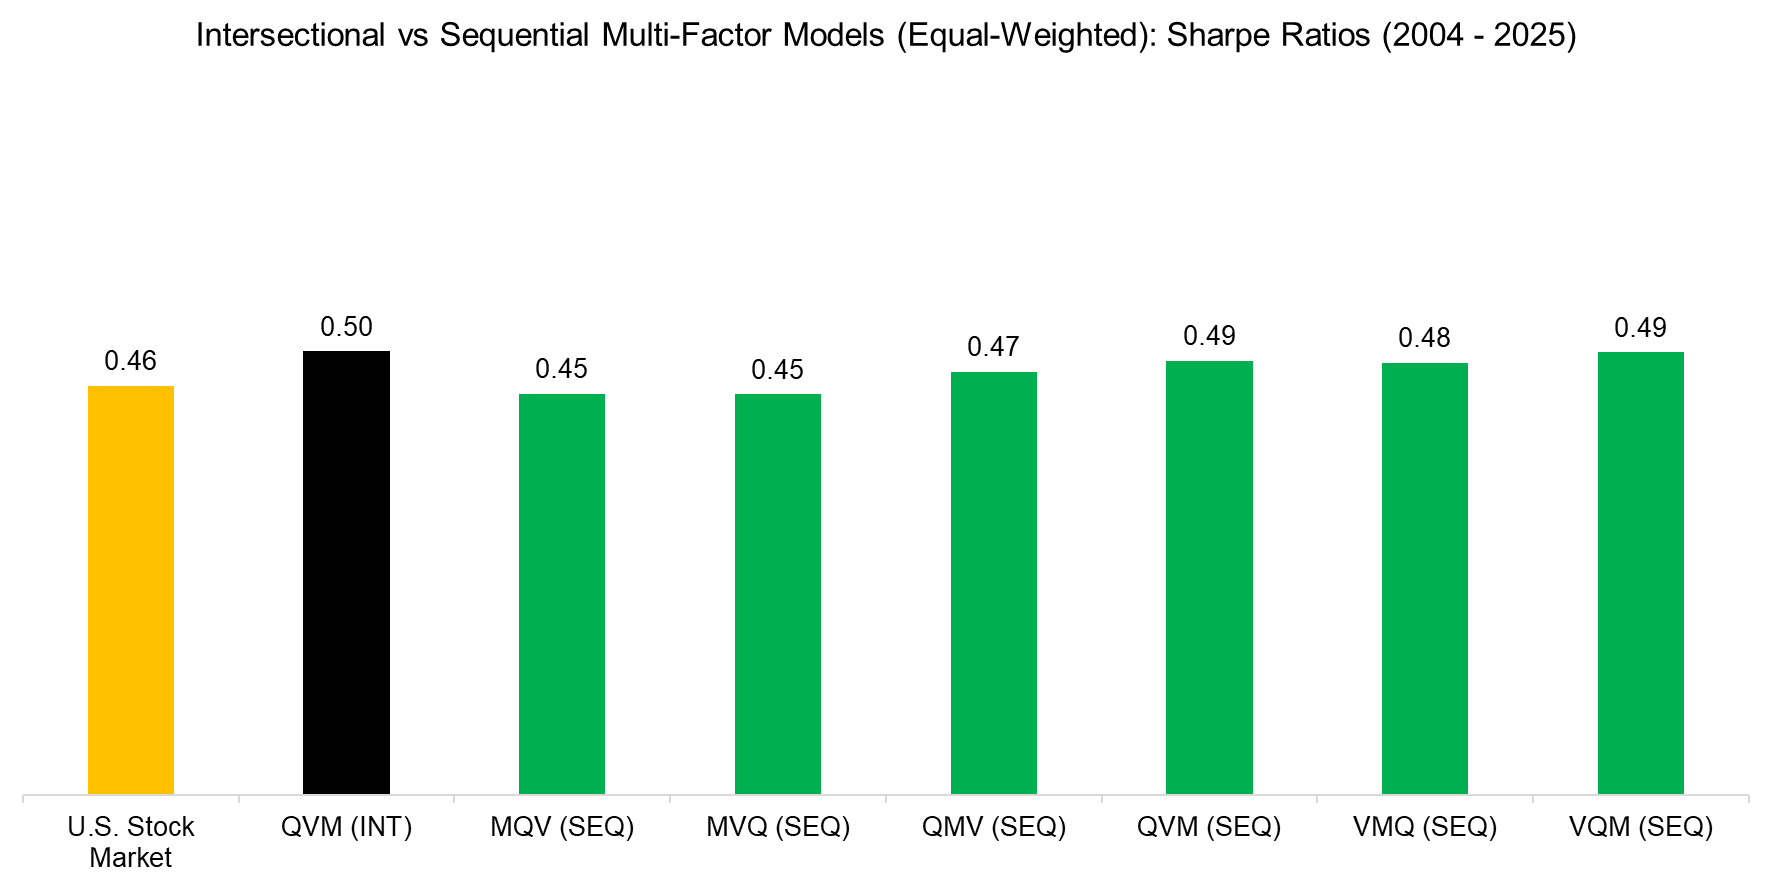
We shift our focus from absolute to risk-adjusted performance by calculating the Sharpe ratios for the seven multi-factor portfolios and the U.S. stock market over the period from 2004 to 2025. Using equal weighting for the top 100 stocks, the sequential combinations produced Sharpe ratios that were comparable to the market’s ratio of 0.46. In contrast, the intersectional model delivered a meaningfully higher Sharpe ratio of 0.50, indicating superior risk-adjusted returns.
Source: Finominal
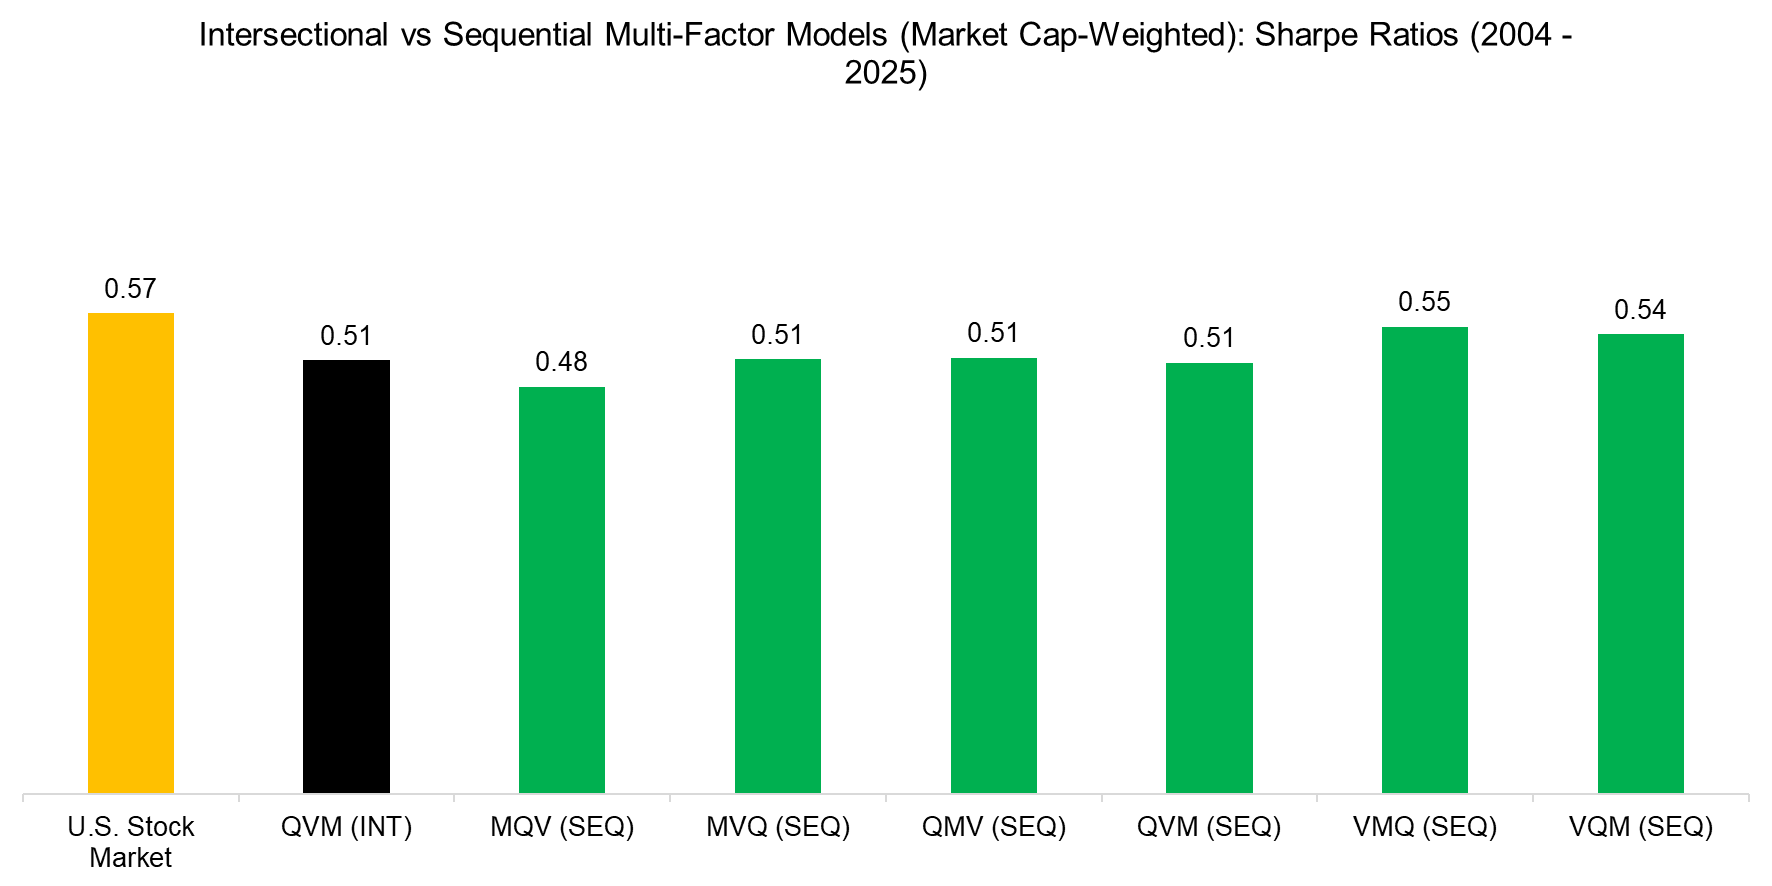
Switching to market capitalization-weighted portfolios shifts the advantage toward the sequential model, as most of its combinations outperformed the intersectional model. However, all multi-factor portfolios underperformed the U.S. stock market in terms of Sharpe ratio, with the market posting a ratio of 0.57. This underperformance underscores the significant impact of a few dominant stocks – such as Amazon and NVIDIA – which were likely not consistently included in the factor-based portfolios.
Source: Finominal
TURNOVER & TRANSACTION COSTS
A key consideration in building multi-factor portfolios is minimizing transaction costs by reducing portfolio turnover. Fundamentally driven factors like quality typically exhibit much lower turnover than price-based factors, particularly momentum.
When comparing annual turnover between the intersectional and sequential models, it becomes clear that the intersectional approach results in significantly lower turnover as selecting stocks on all three factors simultanously somewhat reduces the impact of the momentum factor.
Source: Finominal
FURTHER THOUGHTS
Is there a clear winner between the intersectional and sequential models for constructing a multi-factor portfolio?
Based on our analysis, the intersectional model stands out primarily for its lower turnover, but that also depends on the factor selection. Excluding the momentum factor would likely narrow the difference in turnover.
Surprisingly, the order of factors in the sequential model has little impact on performance, as all variations exhibit similar return patterns. This consistency underscores the robustness of factor investing, yet also highlights its inherent complexity – there appears to be no definitive “right” approach, only trade-offs depending on the investor’s priorities.
RELATED RESEARCH
Factor Exposure Analysis 114: Factor Offsetting
Smart Beta ETF vs Customized Factor Portfolios
Multi-Factor Models 101
Intersectional Model: Sorting 7 Factors
Sequential Model: Sorting by 5 Factors
Integrated Value, Growth & Quality Portfolios
Market-Neutral versus Smart Beta Factor Investing
Multi-Factor Smart Beta ETFs
Factors: Shorting Stocks vs the Index
Factor Investing Is Dead, Long Live Factor Investing!
The Case Against Factor Investing
Smart Beta ETF Construction: High versus Low Factor Exposures
ABOUT THE AUTHOR
Nicolas Rabener is the CEO & Founder of Finominal, which empowers professional investors with data, technology, and research insights to improve their investment outcomes. Previously he created Jackdaw Capital, an award-winning quantitative hedge fund. Before that Nicolas worked at GIC and Citigroup in London and New York. Nicolas holds a Master of Finance from HHL Leipzig Graduate School of Management, is a CAIA charter holder, and enjoys endurance sports (Ironman & 100km Ultramarathon).
Connect with me on LinkedIn or X.

