Is the Carry Trade a Diversifying Strategy?
Only if you have zero equity exposure.
October 2022. Reading Time: 10 Minutes. Author: Nicolas Rabener.
SUMMARY
- The carry trade was positive across most asset classes in YTD 2022
- The correlations to the S&P 500 were low historically
- However, the carry trade crashed when stocks crashed, ie provided limited diversification benefits
INTRODUCTION
After a few years in unchartered territories, most bonds have normalized by showing positive yields again. Naturally, this implies that almost all bonds will have lost in value this year. Although painful, monetary tightening is required to fight inflation, and it increases the expected return of fixed-income securities, at least in nominal terms.
Higher bond yields do not only make single securities more attractive, but also related strategies such as the carry trade. For example, the U.S. 10-Year Treasury bond is yielding close to 4%, compared to 0% for the Japanese equivalent. Given that the JPY has been trading consistently lower against the USD since 2020, this makes the trade all the more alluring, and has become a feedback loop.
Some investors argue that almost all capital market activity can be explained by the carry trade as that continuously shifts capital through the global economy, mostly seeking high returns, but occasionally also safety and security. However, although the carry strategy is well-researched and can be applied across asset classes, it has not performed well in recent years (read Don’t Get Carried Away by Carry).
In this research article, we will explore the performance of carry strategies and their use case for portfolio diversification.
CARRY STRATEGIES ACROSS ASSET CLASSES
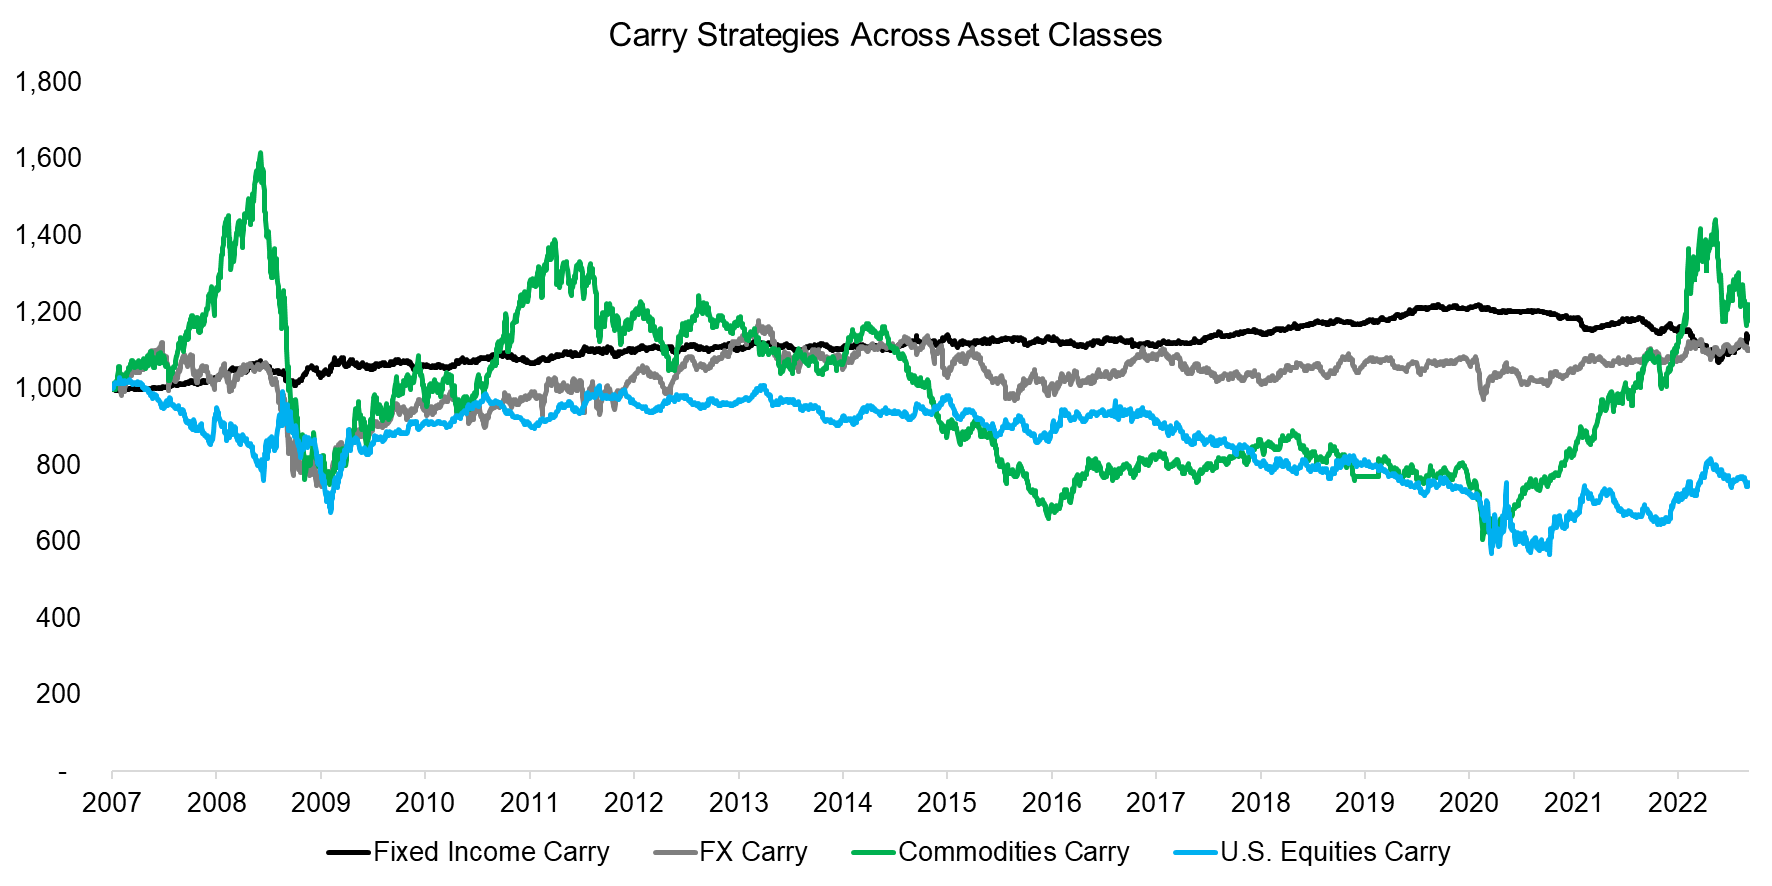
We use indices from Societe Generale in this analysis, which highlight the excess returns for carry strategies across four major asset classes. The portfolios are constructed by going long high-yielding securities and shorting low-yielding ones. For foreign exchange (FX), bonds, and equities this requires bond and dividend yields, while in commodities the differences between spot and forward prices are used for security selection.
We observe that the performance of carry strategies across asset classes has been poor since 2007. The strategy has lost money in equities, and only resulted in insignificant gains in fixed income, FX, and commodities. The volatility of carry strategies varied dramatically across asset classes, ranging from 4% for fixed income to 16% for commodities (read Value, Momentum & Carry Across Asset Classes).
Source: Societe Generale, Finominal
DIVERSIFICATION BENEFITS OF CARRY STRATEGIES
The carry trade is one of the classic risk premia strategies that has been backtested across decades and various asset classes. It is also called alternative beta, but that term implies uncorrelated returns to traditional asset classes like stocks or bonds.
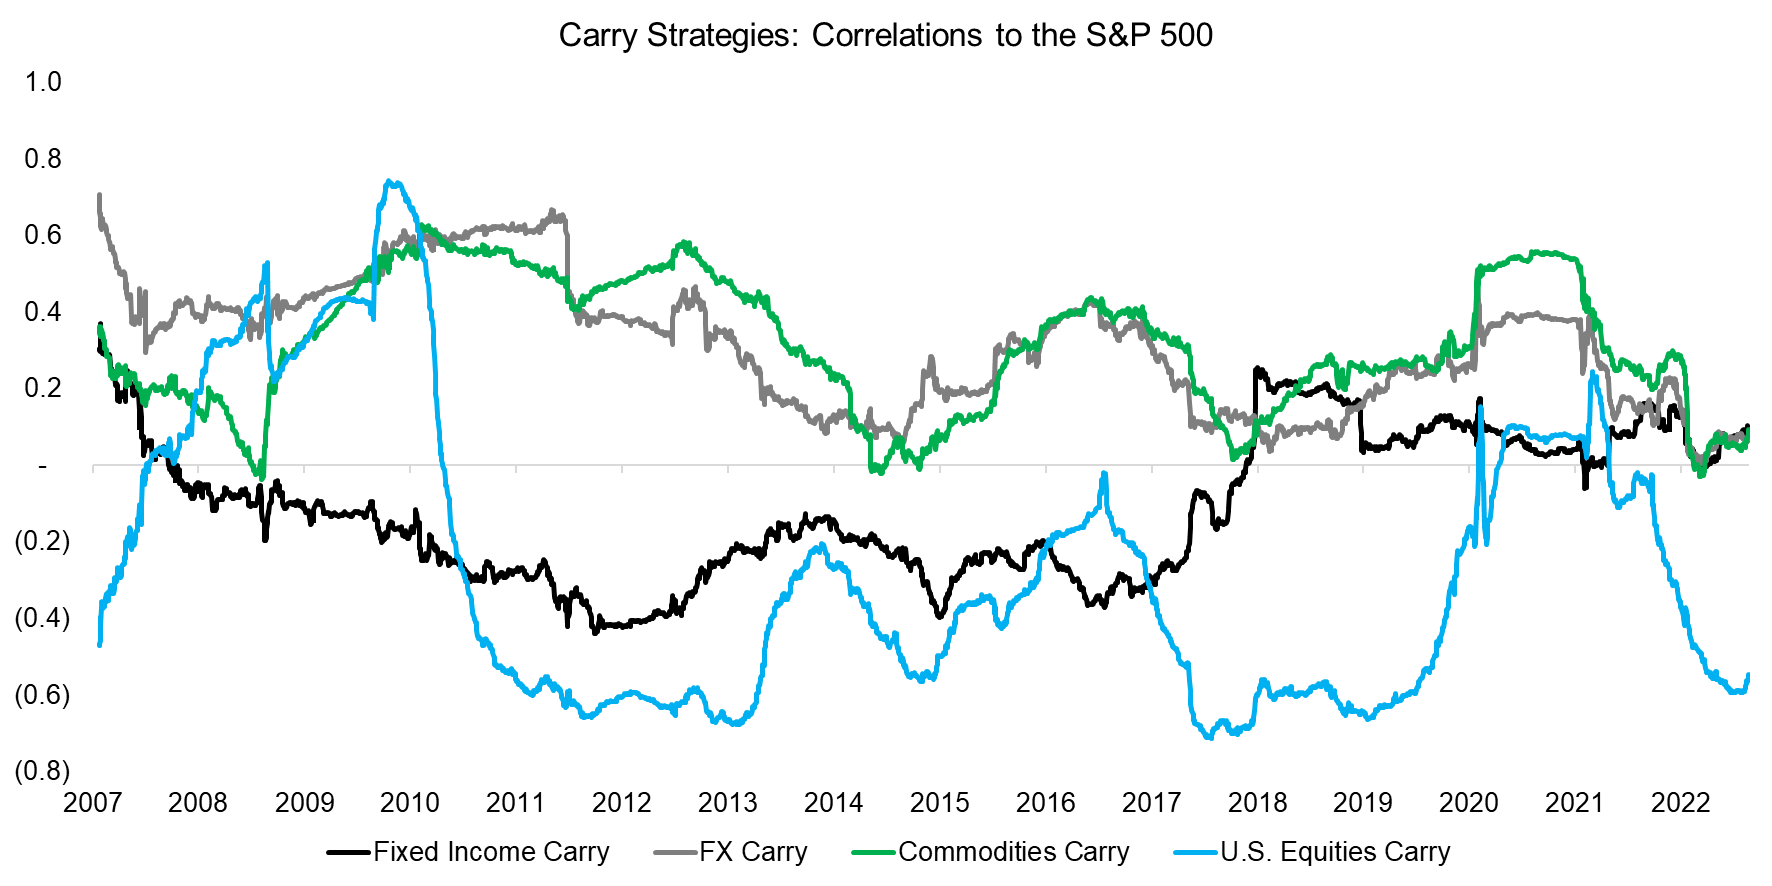
We calculate the correlations of carry strategies to the S&P 500, which ranged between -0.3 and 0.3 in the period between 2007 and 2015. It is interesting the equities carry was most negatively correlated to stocks, which is perhaps explained by investors preferring growth stocks that often pay a low or no dividend since the global financial crisis in 2008.
Source: Finominal
CARRY STRATEGIES DURING MARKET CRASHES
The low correlations of carry strategies to the S&P 500 should make them excellent candidates as portfolio diversifiers. However, the correlations were time-varying, which makes average correlations less meaningful.
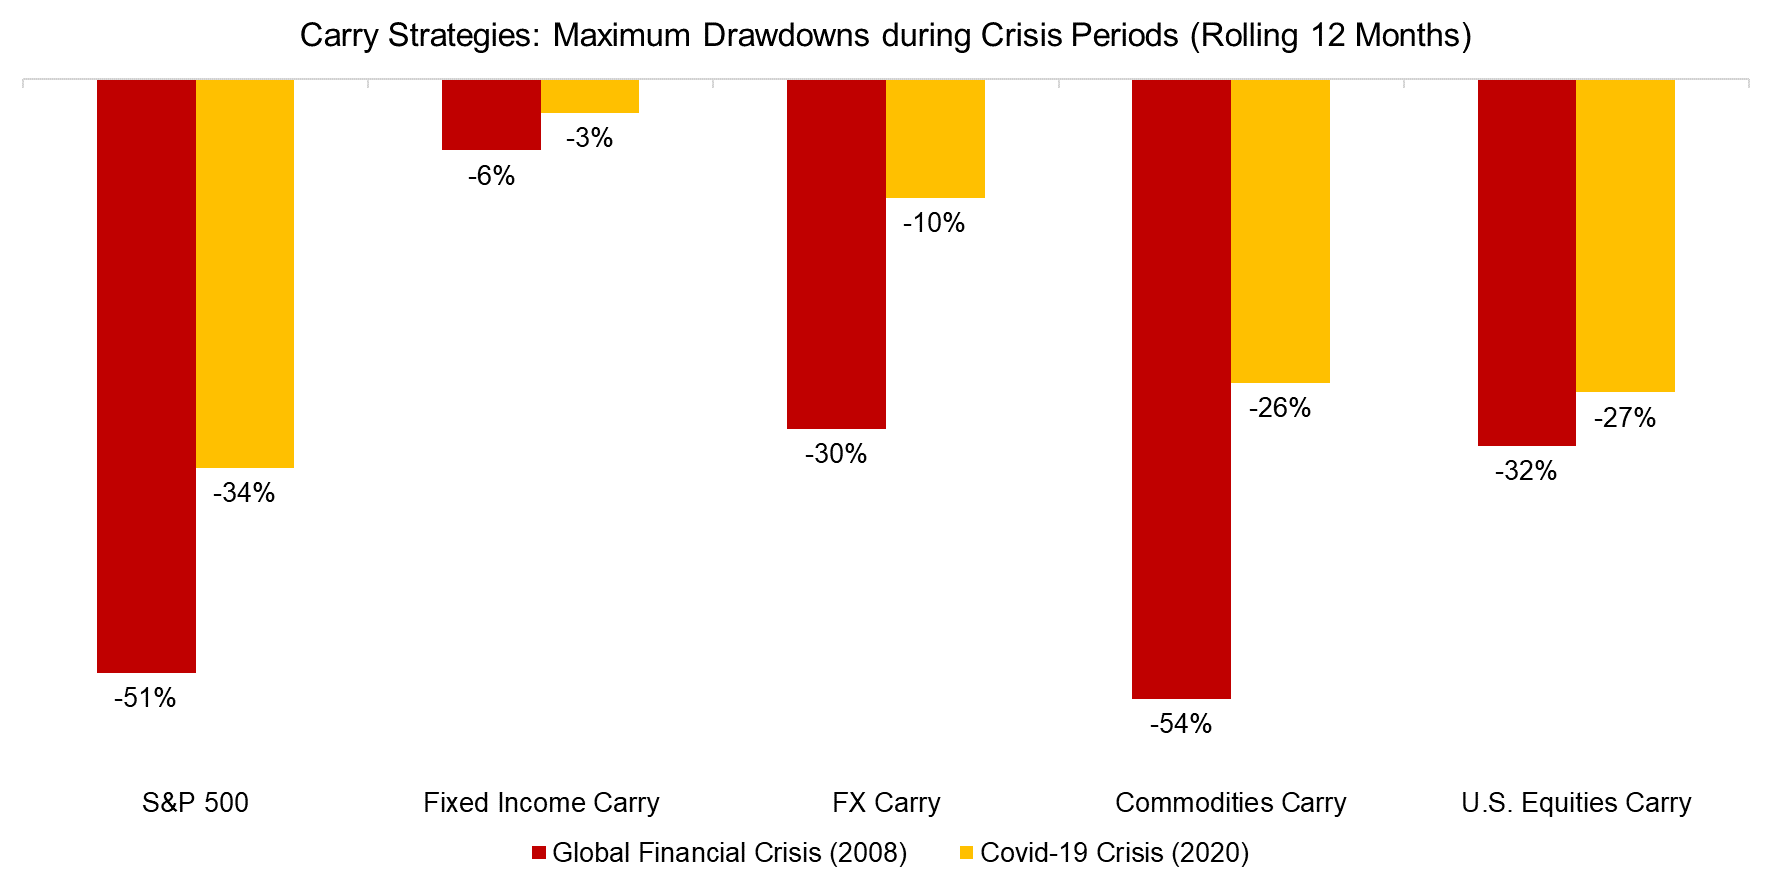
Specifically, we observe that the correlations to stocks spiked during crisis periods. Given this, we calculate the maximum drawdowns of carry strategies during the global financial crisis in 2008 and COVID-19 crisis in 2020.
Unfortunately for investors, all carry strategies lost significantly during those two periods, which reduced the diversification benefits. The drawdowns of fixed income carry were relatively low, but so were the returns. Considering these drawdowns highlights that the carry trade provides essentially the same exposure as equities, ie beta to the economic cycle. When investors become cautious or start panicking, then allocations to the carry trade and equities are reduced simultaneously.
Source: Finominal
DIFFERENT DATA, DIFFERENT PERSPECTIVE
However, we also need to note that the performance and risk evaluation of carry strategies strongly depends on which data set is chosen. The analysis above is based on carry indices from Societe Generale, but there are many investment banks and data providers offering these, often with substantially different returns.
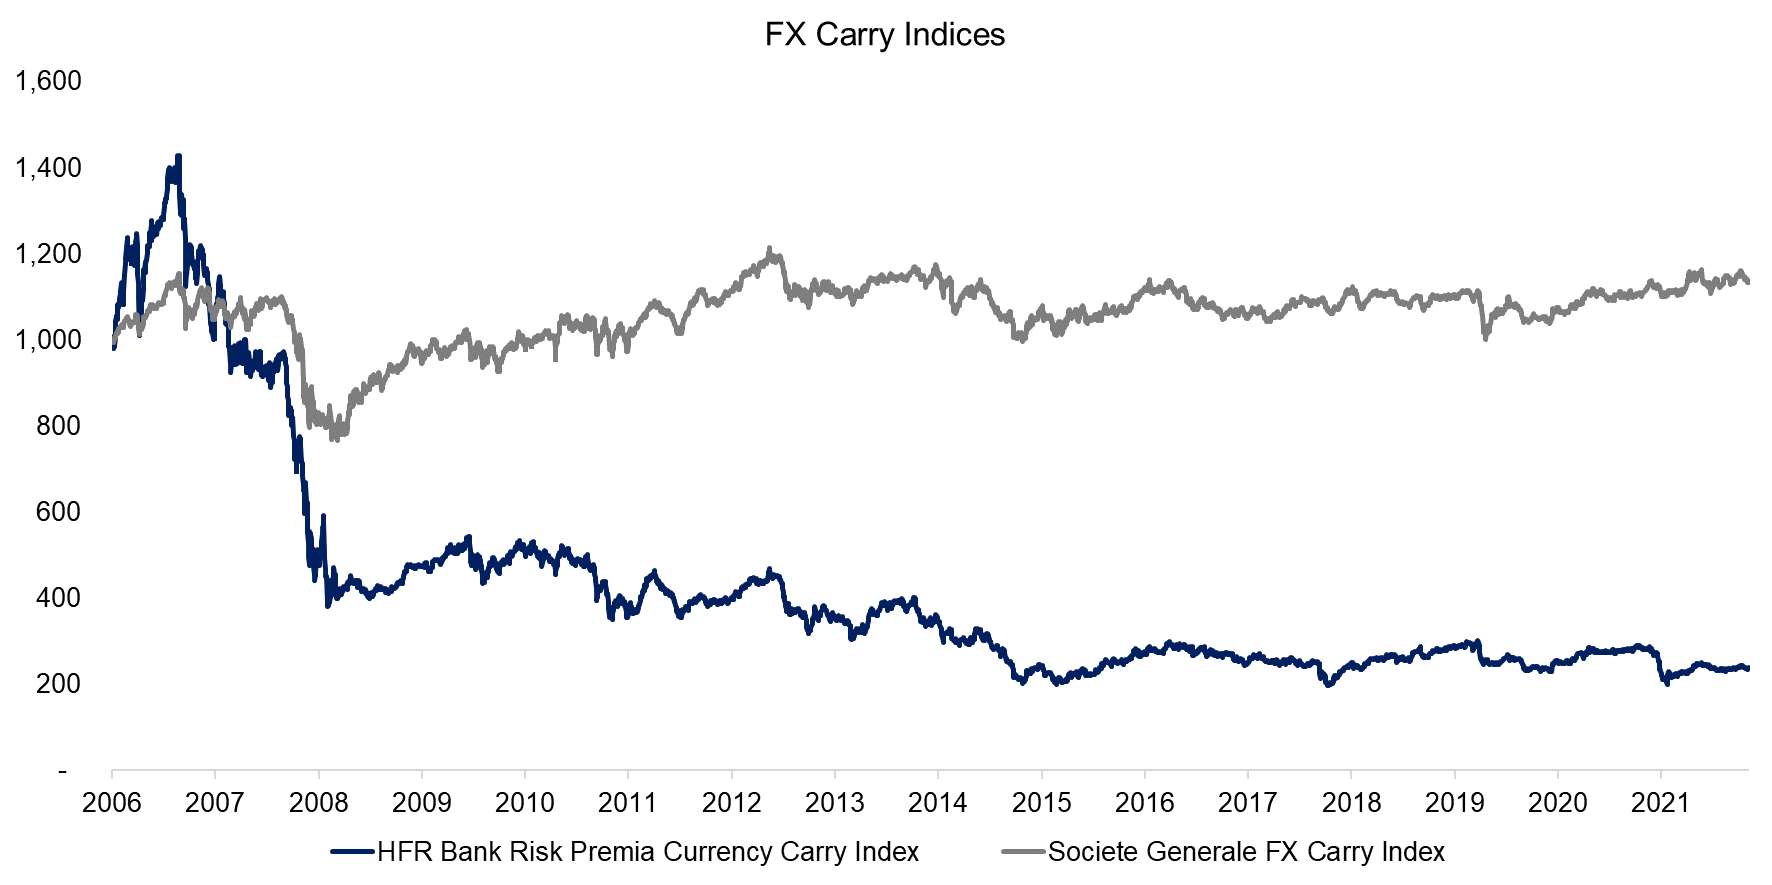
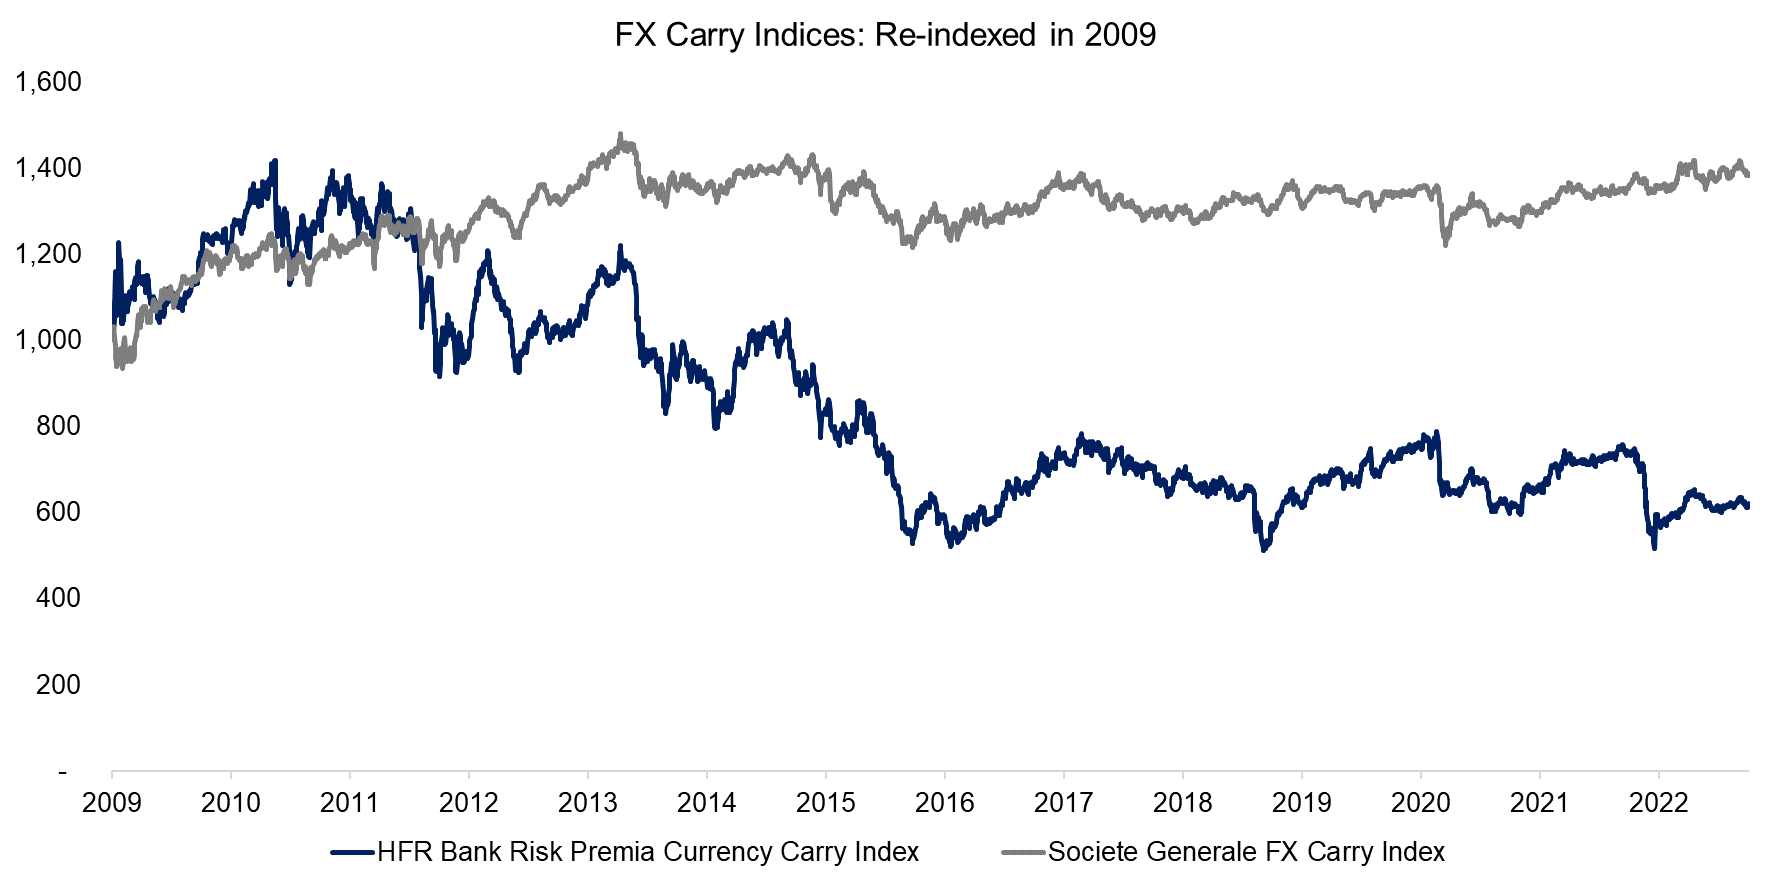
For example, we can contrast the FX Carry Index from Societe Generale with the HFR Bank Risk Premia Currency Carry Index, which aggregates many of these indices, likely including the one from Societe Generale. Theoretically, these indices should be similar as FX carry is simple to calculate – only a few time series are required and their data quality is high. Most focus on the G10 currencies and a portfolio is constructed by going long three currencies where short-term yields are high, and shorting three currencies where yields are low. Portfolios are typically rebalanced on a monthly basis.
However, we observe that the returns of these two indices since 2006 were substantially different, especially around the global financial crisis where the HFR Bank Risk Premia Currency Carry Index lost significantly more than the index from Societe Generale.
Source: Finominal
Perhaps the returns of these two indices were more similar if we remove the global financial crisis, where the volatility of all asset classes, including currencies, was exceptionally high. We re-index both indices to 2009, but observe that the returns were still quite different. The correlation decreased from 0.6 to 0.5 when excluding the GFC.
Naturally, this raises the question of which data set is more trustworthy. Intuitively an index that averages across several sub-indices should be a better representation of realizable returns, but this might also include indices that are poorly constructed or use a larger set of currencies than the G10 universe. Calculating a carry index for the G10 currencies is not difficult and has a relatively low model risk, so Societe Generale’s index should be a good representation, but this requires more due diligence.
However, regardless of the data set, the perspective on FX carry having been a poor trade does not change.
Source: Finominal
FURTHER THOUGHTS
Except for fixed income, the carry strategy has generated positive returns in all other asset classes, with commodities carry leading with an attractive 17% in year-to-date 2022. Given that stocks and bonds have lost money over the same period, investment banks and hedge funds are likely to start marketing carry as a diversifying strategy again.
Although that is true for this year, it is worth recalling the drawdowns of the carry strategy during previous stock market crashes. It seems that the carry trade represents a fair weather strategy, i.e. uncorrelated returns in calm times and correlated returns when markets crash, which is of little use for portfolio diversification.
RELATED RESEARCH
Don’t Get Carried Away by Carry
Value, Carry, and Momentum Across Asset Classes
Bank Risk Premia Indices: Unbankable?
Defensive & Diversifying Strategies in YTD 2022
ABOUT THE AUTHOR
Nicolas Rabener is the CEO & Founder of Finominal, which empowers professional investors with data, technology, and research insights to improve their investment outcomes. Previously he created Jackdaw Capital, an award-winning quantitative hedge fund. Before that Nicolas worked at GIC and Citigroup in London and New York. Nicolas holds a Master of Finance from HHL Leipzig Graduate School of Management, is a CAIA charter holder, and enjoys endurance sports (Ironman & 100km Ultramarathon).
Connect with me on LinkedIn or X.

