
Long-Short vs Long-Only Factor Investing
These are comparable, right?
September 2026. Reading Time: 10 Minutes. Author: Nicolas Rabener.
SUMMARY
- Long-short and long-only factor returns vary significantly
- Differences are attributable to portfolio construction
- Matters more for some factors than others
INTRODUCTION
Academic research on equity factor performance would lead most investors to focus on the low volatility factor. Data from AQR’s data library shows that this factor, taking Betting-Against-Beta (BAB) as a proxy, has generated the highest returns since 1930: an excess return of 7.4% per annum, compared to 6.2% for momentum, 2.9% for value, and 2.2% for size.
In practice, the largest U.S. low volatility ETF, Invesco’s S&P 500 Low Volatility ETF (SPLV, $7bn in assets under management), generated a CAGR of 10.1% since its inception 15 years ago, compared to 14.1% for the S&P 500. Naturally, the academic argument is that low-risk stocks outperform on a risk-adjusted, not absolute, basis – yet SPLV’s Sharpe ratio was 0.59, compared to 0.73 for the S&P 500.
The largest U.S. multi-factor ETF, Goldman Sachs’ ActiveBeta U.S. Large Cap Equity ETF (GSLC, $15bn in assets under management), generated a CAGR of 14.2% and a Sharpe ratio of 0.69 since its inception 11 years ago, compared to 15.2% and 0.73 for the S&P 500 over the same period.
By contrast, AQR’s Equity Market Neutral Fund (QMNIX), which pursues long-short multi-factor investing as seen in academic research, is trading close to an all-time high.
As we noted before, a significant difference exists between academic long-short factor investing and its long-only implementation via smart beta funds, which most investors have actually allocated to (read Market-Neutral versus Smart Beta Factor Investing and Smart Beta: Broken by Design?). In this research article, we show these differences in the simplest possible way.
LONG-SHORT VS LONG-ONLY FACTOR INVESTING
We compare long-short factor investing, as studied in academic research, with its most popular practical implementation: long-only smart beta strategies. Specifically, we use Finominal’s global factor indices, constructed by going long the top 20% of stocks ranked on metrics such as value or momentum and shorting the bottom 20%. Stocks are equally weighted, portfolios are rebalanced monthly and are constructed beta-neutral, and transaction costs are excluded. The global portfolios are created by weighting the underlying country portfolios by their market capitalization.
The global long-only portfolios are constructed in the same fashion, but consider only the top 20% of stocks, weighted by market capitalization. We deduct the return of the global market-cap-weighted index to generate excess return indices.
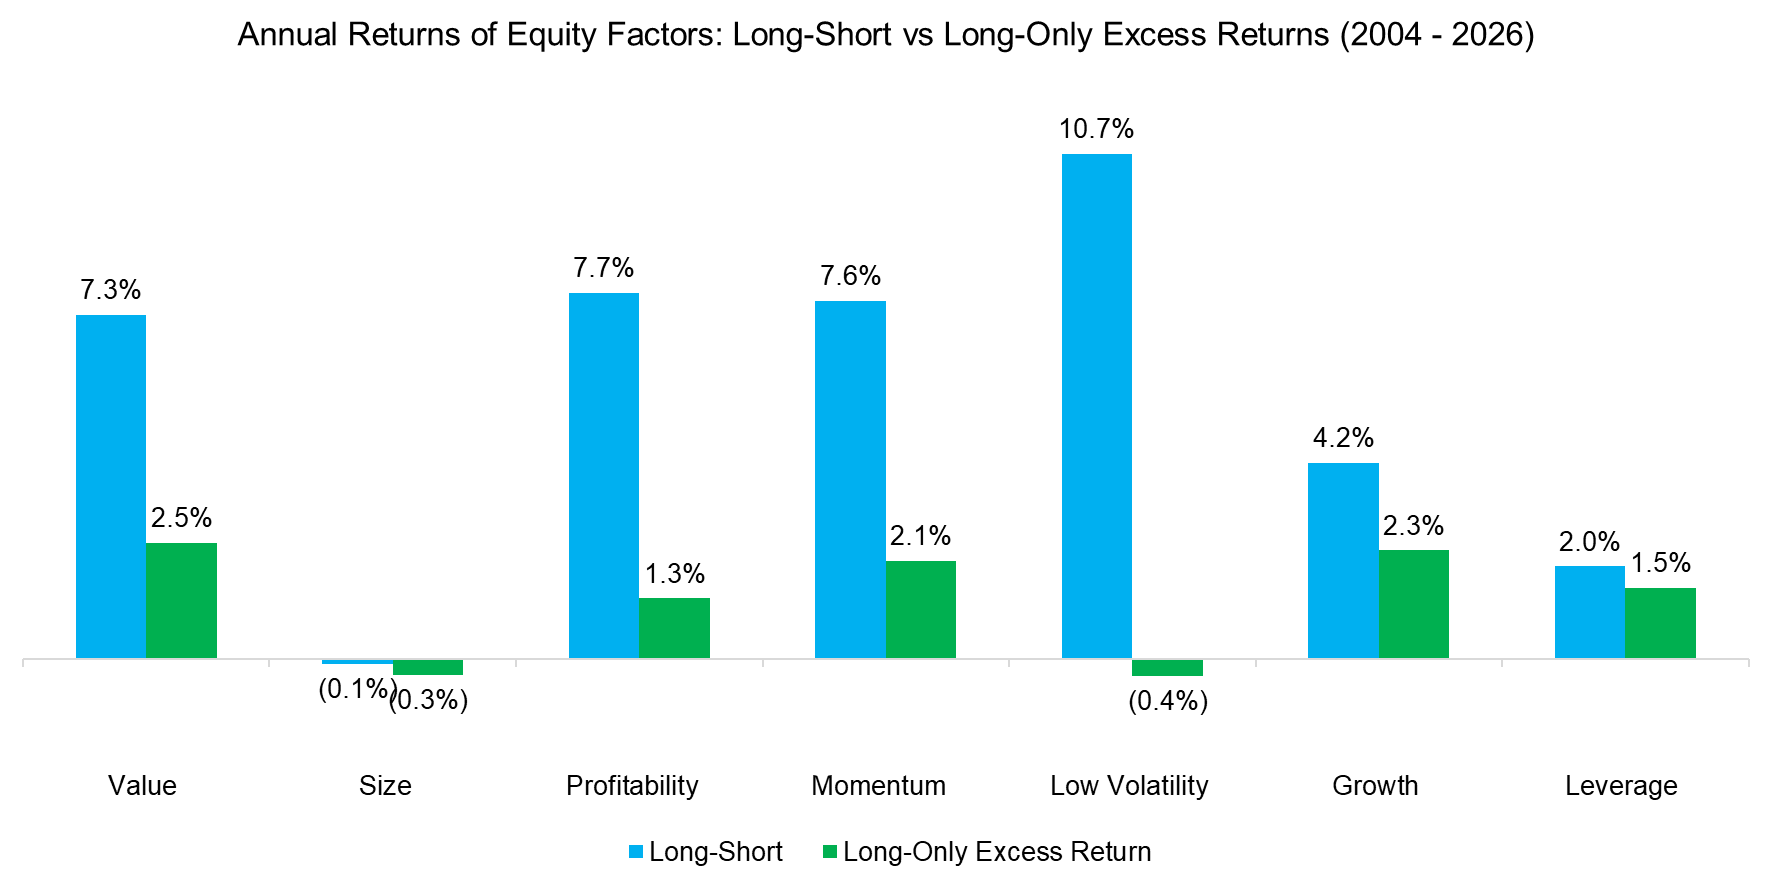
Comparing the long-short and long-only excess returns across seven equity factors highlights that long-short investing has been far more attractive than long-only investing between 2004 and 2026.
Source: Finominal
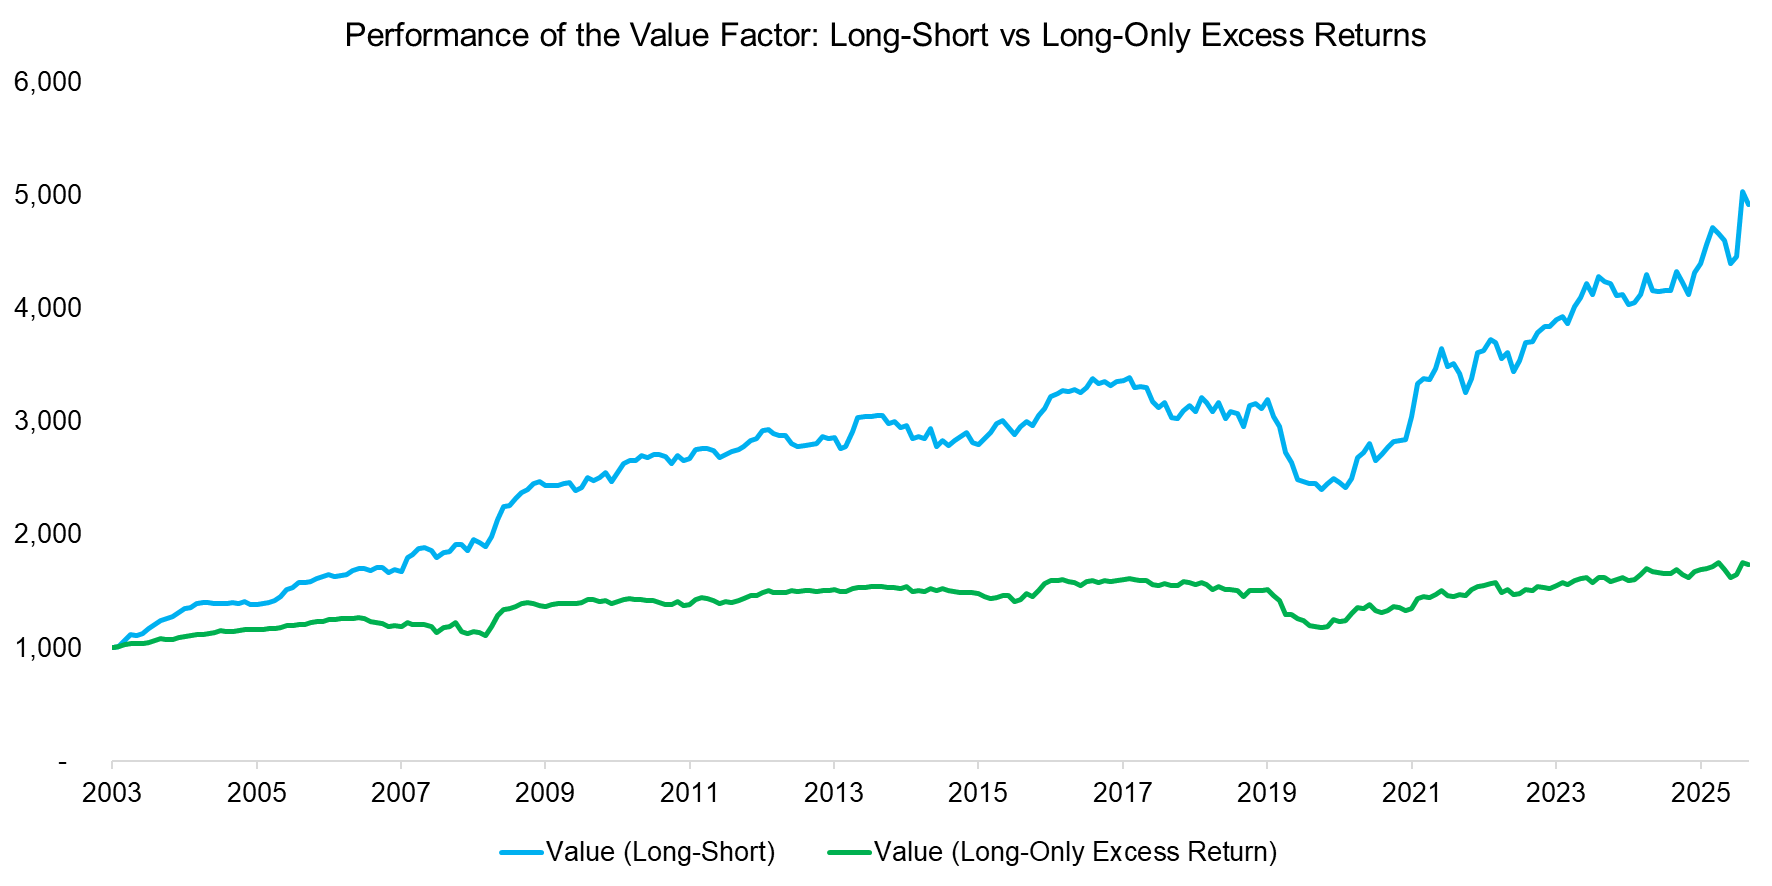
Visualizing the difference in returns makes the contrast even clearer. Taking the value factor as an example, the performance chart shows similar trends over the last two decades, but steady positive excess returns from long-short investing versus roughly zero excess returns from value investing, as pursued by most investors.
Source: Finominal
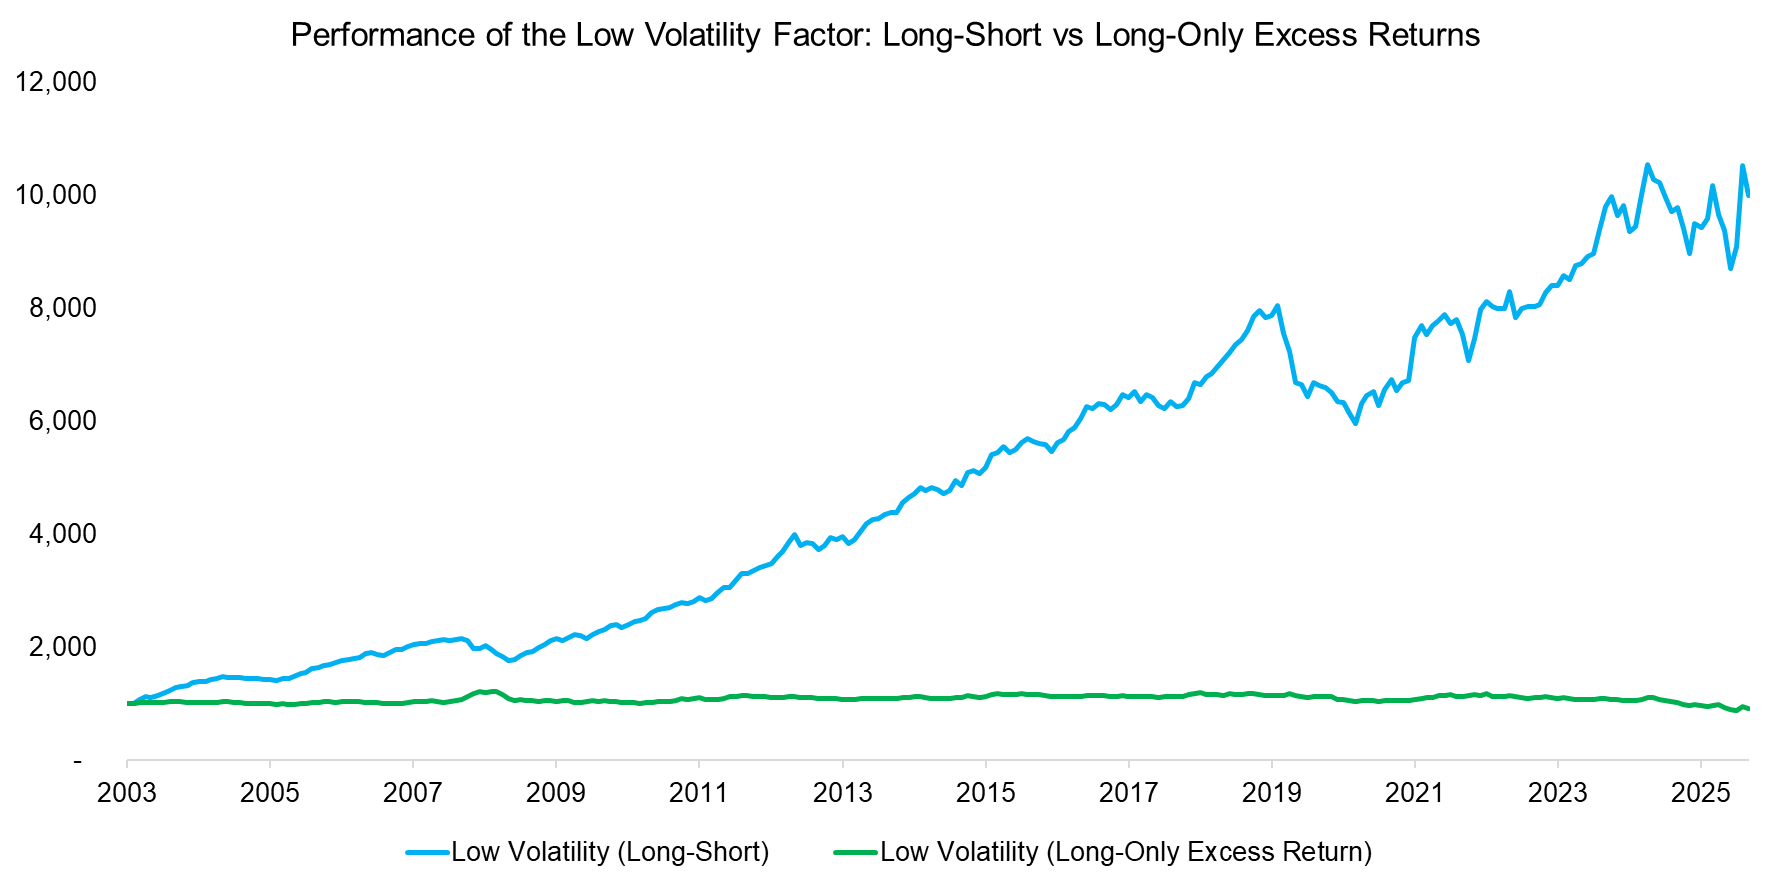
The largest return difference was observed for the low volatility factor, where the long-short version produced 10.7% per annum between 2004 and 2026, compared to -0.4% for the long-only version. In this case, the difference is attributable to the use of leverage. The long portfolio has a beta well below one, and the short portfolio has a beta above one, implying leverage on the long side and deleverage on the short side to construct the beta-neutral portfolio.
Long-only funds, however, tend not to use leverage, which means low volatility funds like SPLV carry a beta below one to the stock market. Since the global stock market has risen steadily over the last 20 years, this sub-one beta has penalized the performance of such funds (read Low Volatility Funds: Lost Decade or Flawed Design?).
Source: Finominal
SHARPE RATIOS
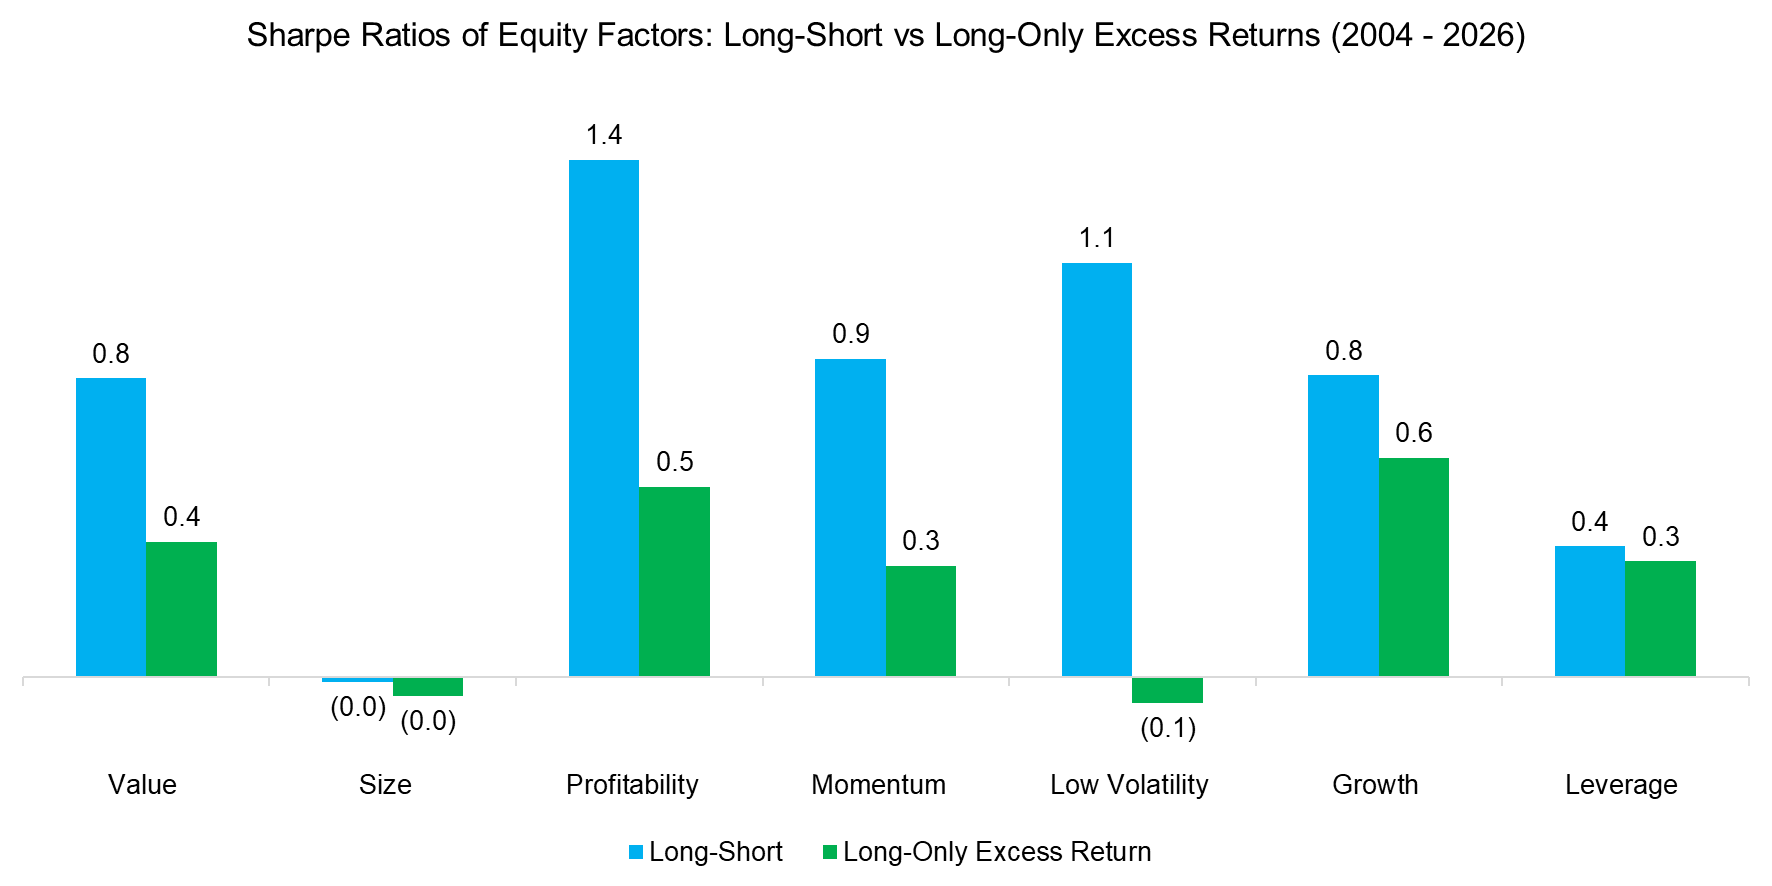
Next, we review the Sharpe ratios of the long-short versus long-only excess return factor indices. The difference narrows slightly, but for every one of the seven equity factors, the long-short version generated more attractive risk-adjusted returns.
Source: Finominal
CORRELATION ANALYSIS
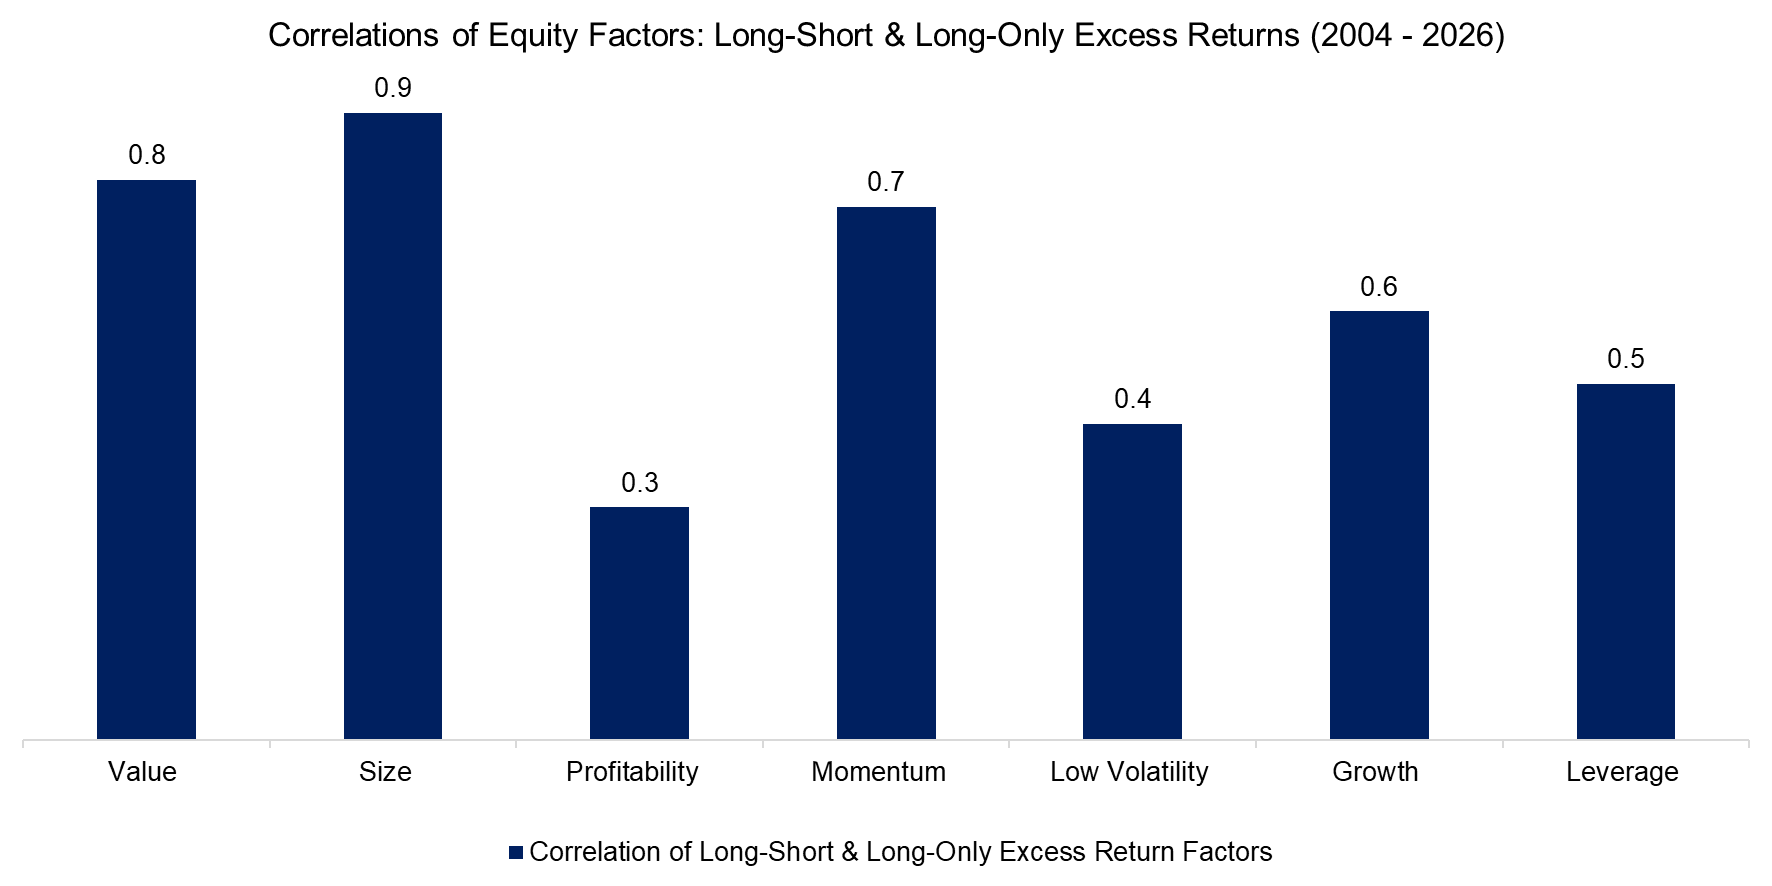
Finally, we compute the correlations between the long-short and long-only excess return factor indices, which range from 0.3 to 0.9 between 2004 and 2026. This implies that, despite the significant return differences, investors capture most of the trends for the value, size, and momentum factors. However, this is less true for profitability and low volatility, where correlations were only 0.3 and 0.4, respectively.
The differences in portfolio construction, i.e., being able to use leverage and having a short portfolio with stocks selected by factor metrics, have a meaningful impact.
Source: Finominal
FURTHER THOUGHTS
We understand that for many investors, long-short multi-factor products like QMNIX are challenging, as they can exhibit long periods of poor returns. The same is true of bonds, which many investors have come to realize over the last few years as interest rates have risen. Diversifying strategies should provide uncorrelated returns, and periods of different performance are the price of that diversification.
The annual returns of most factors in their long-only implementation were positive, at least before transaction costs and management fees, so long-only factor investing remains a viable strategy for investors aiming to outperform the stock market. However, investors should acknowledge significant differences between what they read in research and what they implement in practice.
RELATED RESEARCH
Market-Neutral versus Smart Beta Factor Investing
Smart Beta: Broken by Design?
Low Volatility Funds: Lost Decade or Flawed Design?
Combining Smart Beta Funds May Not Be Smart
Timing Luck in Factor Investing
Factor Investing Is Dead, Long Live Factor Investing!
Smart Beta vs Alpha + Beta
How Painful Can Factor Investing Get?
Factor Exposure Analysis 114: Factor Offsetting
Improving Smart Beta Attribution Analysis II
Smart Beta ETF vs Customized Factor Portfolios
Smart Beta ETF Construction: High versus Low Factor Exposures
Multi-Factor Smart Beta ETFs
Factor Optimization via ETFs
Factor Performance vs Portfolio Concentration – II
Multi-Factor Investing: Intersectional vs Combination Models
ABOUT THE AUTHOR
Nicolas Rabener is the CEO & Founder of Finominal, which empowers professional investors with data, technology, and research insights to improve their investment outcomes. Previously he created Jackdaw Capital, an award-winning quantitative hedge fund. Before that Nicolas worked at GIC and Citigroup in London and New York. Nicolas holds a Master of Finance from HHL Leipzig Graduate School of Management, is a CAIA charter holder, and enjoys endurance sports (Ironman & 100km Ultramarathon).
Connect with me on LinkedIn or X.