LOVM Portfolios Around the World
Betting On Boring Winners
March 2020. Reading Time: 10 Minutes. Author: Nicolas Rabener.
SUMMARY
- Low Volatility-Momentum portfolios outperformed markets across regions over the last 30 years
- The combination model generated consistently the highest excess returns
- Low correlation between the two factors provided significant diversification benefits
INTRODUCTION
A Springbok antelope can reach a top speed of 55 miles per hour in the African savanna, whereas the fastest human manages barely half that speed and only for a few meters. In a short race, we are left in the dust.
However, we are built for endurance and can run for hours at an almost constant speed, ultimately even run a Springbok into exhaustion. Persistence hunting is one of the earliest human hunting strategies and still practiced by the San people in the Kalahari Desert and the Raramuri people of Northwestern Mexico.
Factor investing includes strategies where stocks feature high absolute as well as high risk-adjusted performance – namely Momentum and Low Volatility. In a recent research note, we highlighted that combining both strategies generated attractive excess returns in the US in the period from 1989 to 2018.
In this research note, we will analyze Low Volatility-Momentum (“LOVM”) portfolios in international markets (read LOVM: Low Volatility-Momentum Portfolios).
MULTI-FACTOR PORTFOLIO CONSTRUCTION
We focus on all stocks in the US, European, and Japanese stock markets above a market capitalization of $1 billion. Combining factors into a multi-factor portfolio can be achieved by three methodologies, which are as follows:
- Intersectional Model: The universe of stocks is sorted simultaneously by both factors and the stocks in the intersection are chosen.
- Sequential Model: Stocks are first ranked by one factor and the resulting universe of stocks is then sorted by a second factor.
- Combination Model: The universe of stocks is sorted by factors separately and the two portfolios are then combined.
We create long-only Low Volatility-Momentum portfolios by utilizing these three methodologies. The stocks are weighted by market capitalization, rebalanced monthly, and include 10 basis points of costs for each transaction. The portfolios are constructed to hold the same amount of stocks, which is 10% in the US and 20% in other markets (read Multi-Factor Models 101).
LOVM PERFORMANCE ACROSS MARKETS
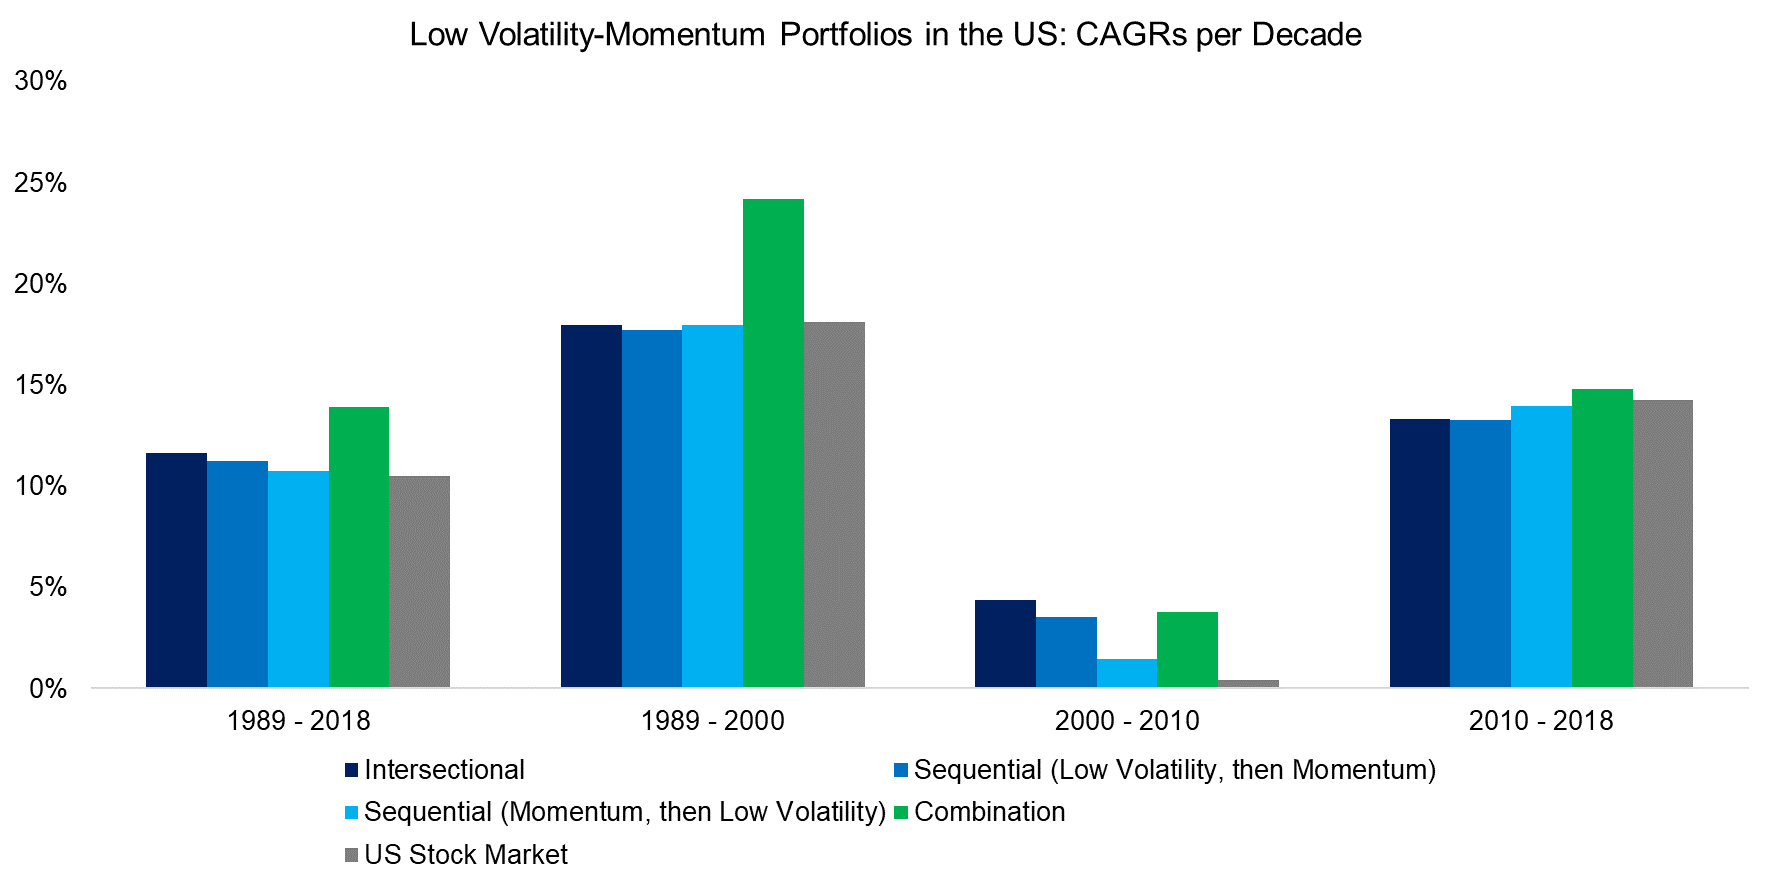
We analyze the performance of the LOVM portfolios in the US for the entire period between 1989 and 2018 as well as per decade. We observe that all portfolios outperformed the stock market over the 30 years, but that most of the excess returns can be attributed to the period between 2000 and 2010, which includes the tech bubble implosion and global financial crisis.
Furthermore, the analysis highlights that the combination model, which effectively represents a barbell strategy of combining the extreme portfolios of the best-performing and lowest-risk stocks, generated excess returns most consistently across time.
Source: FactorResearch
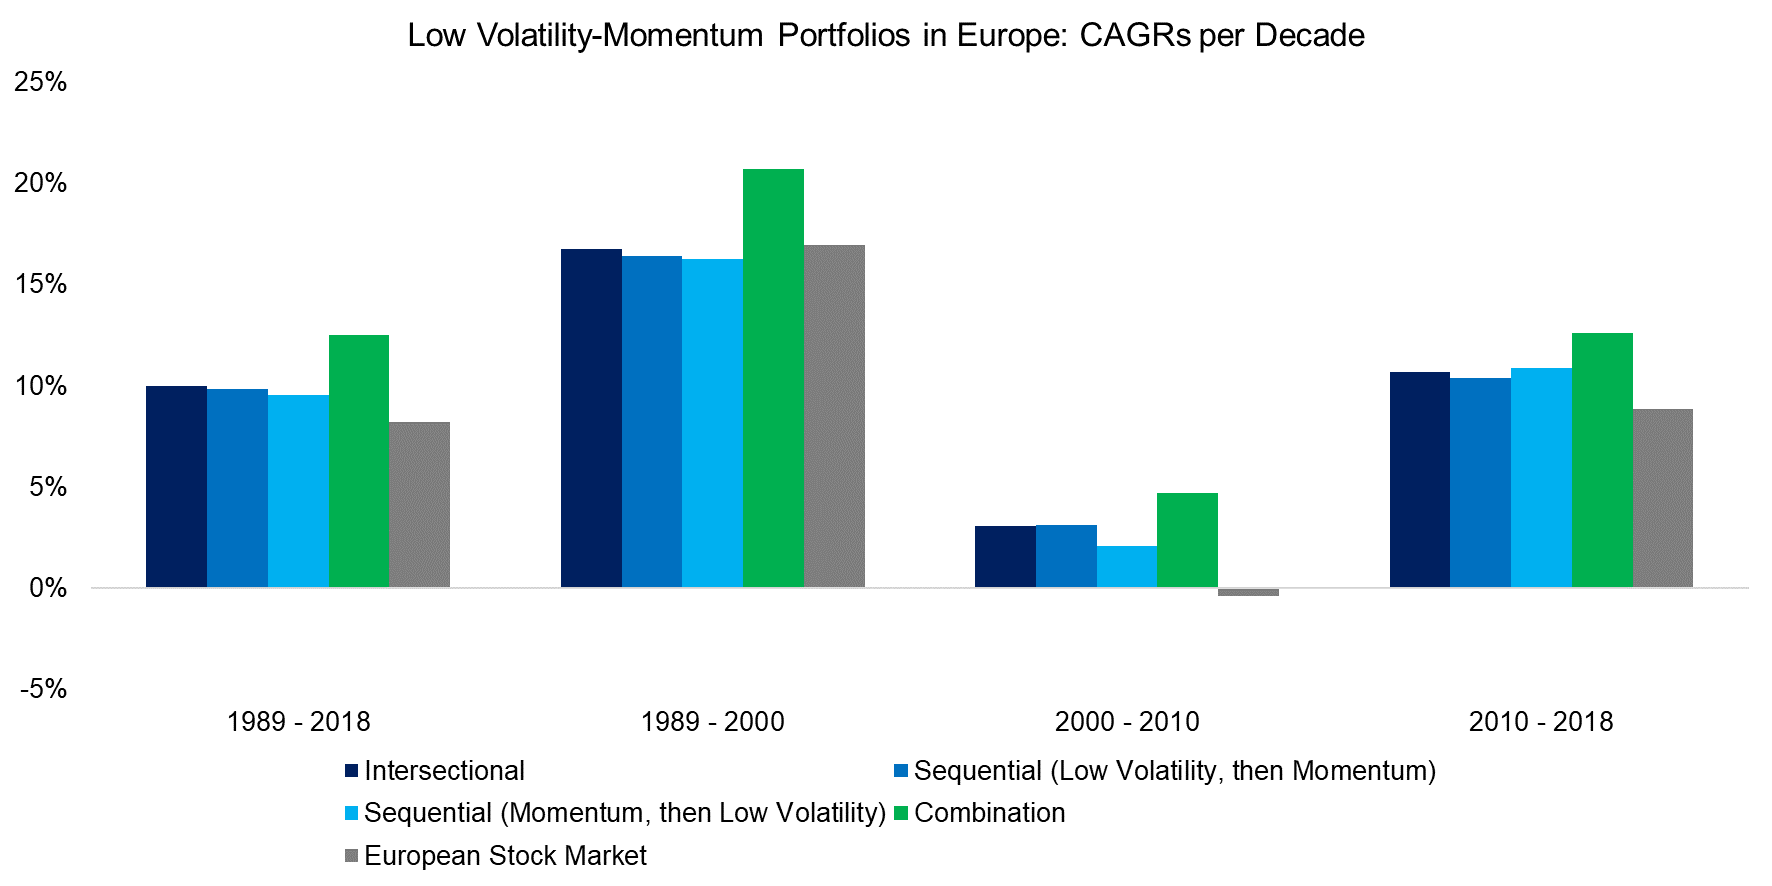
The performance of the LOVM portfolios in Europe is comparable to the US as all outperformed the stock market, which is not unexpected as factors tend to show the same trends across markets. The combination model was again the most attractive methodology for combining these two factors.
Source: FactorResearch
Some research indicates that specific factors like Momentum perform worse in Japan than globally, which might be explained by Japanese investors preferring mean-reversion strategies like Value over trend-following ones like Momentum.
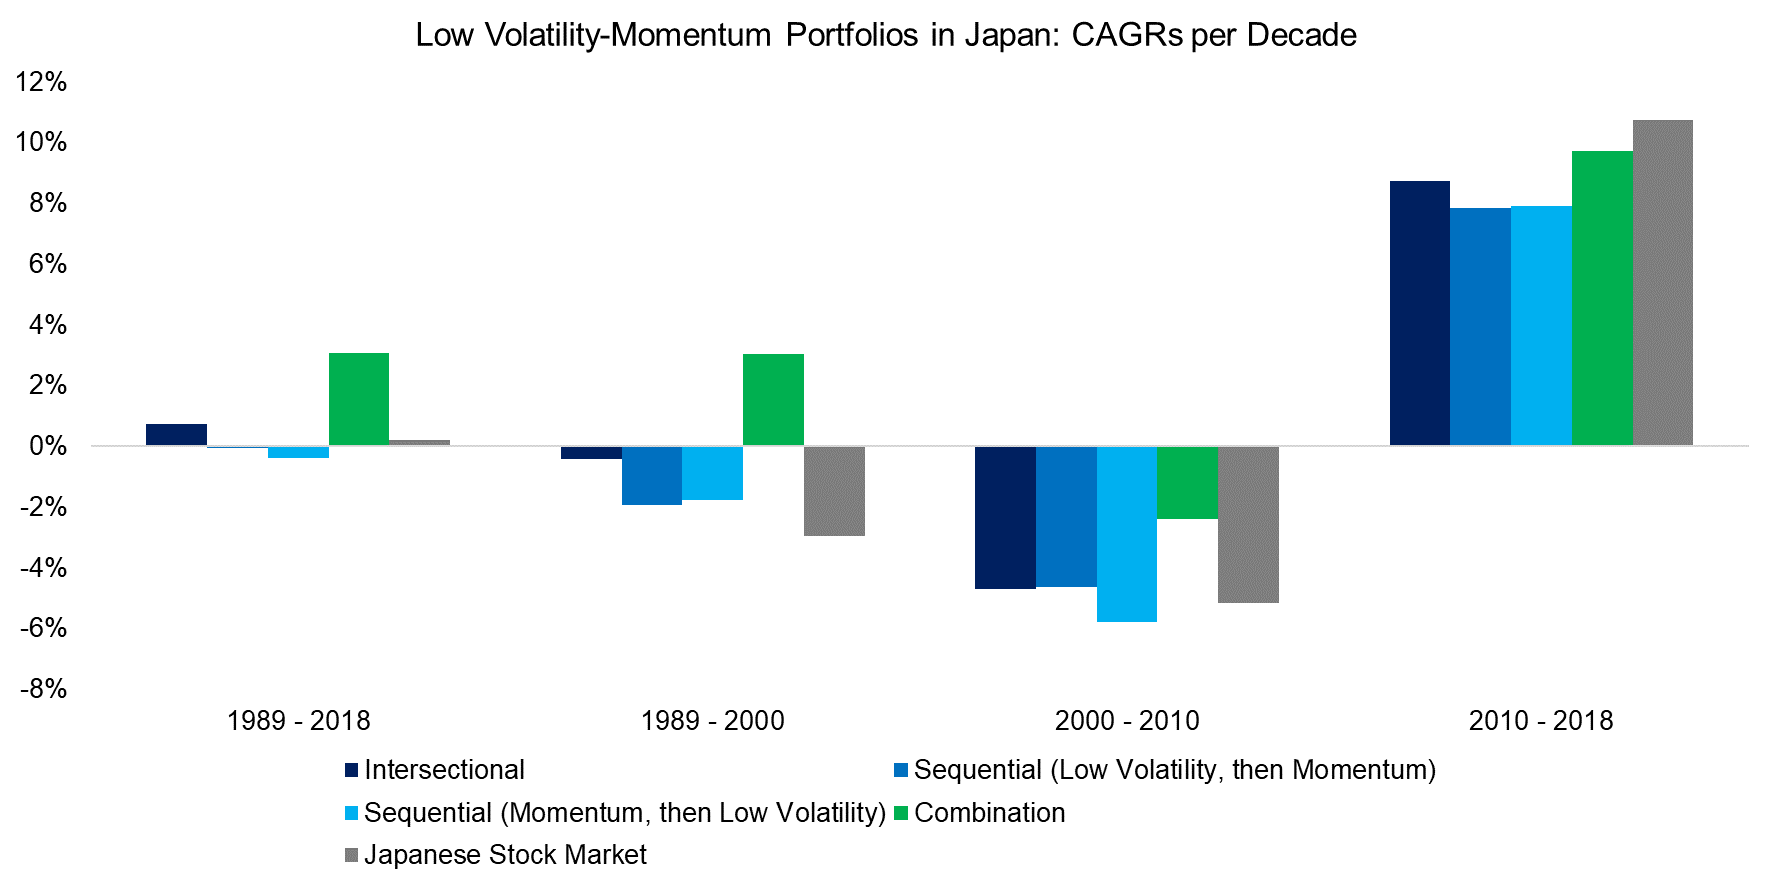
The results highlight that the performance of the LOVM portfolios in Japan was more differentiated than in the US or Europe. The combination model was the only approach that generated significant excess returns, but only between 1989 and 2010. None of the portfolios outperformed the stock market in the last decade.
A second reason for lower excess returns from LOVM portfolios in Japan is likely that quantitative easing has been orchestrated far longer by the BoJ than the US Fed or ECB. The Low Volatility factor exhibits interest-rate sensitivity and rates have been low in Japan for decades, which provided a less positive tailwind.
Source: FactorResearch
LOVM PORTFOLIO CHARACTERISTICS
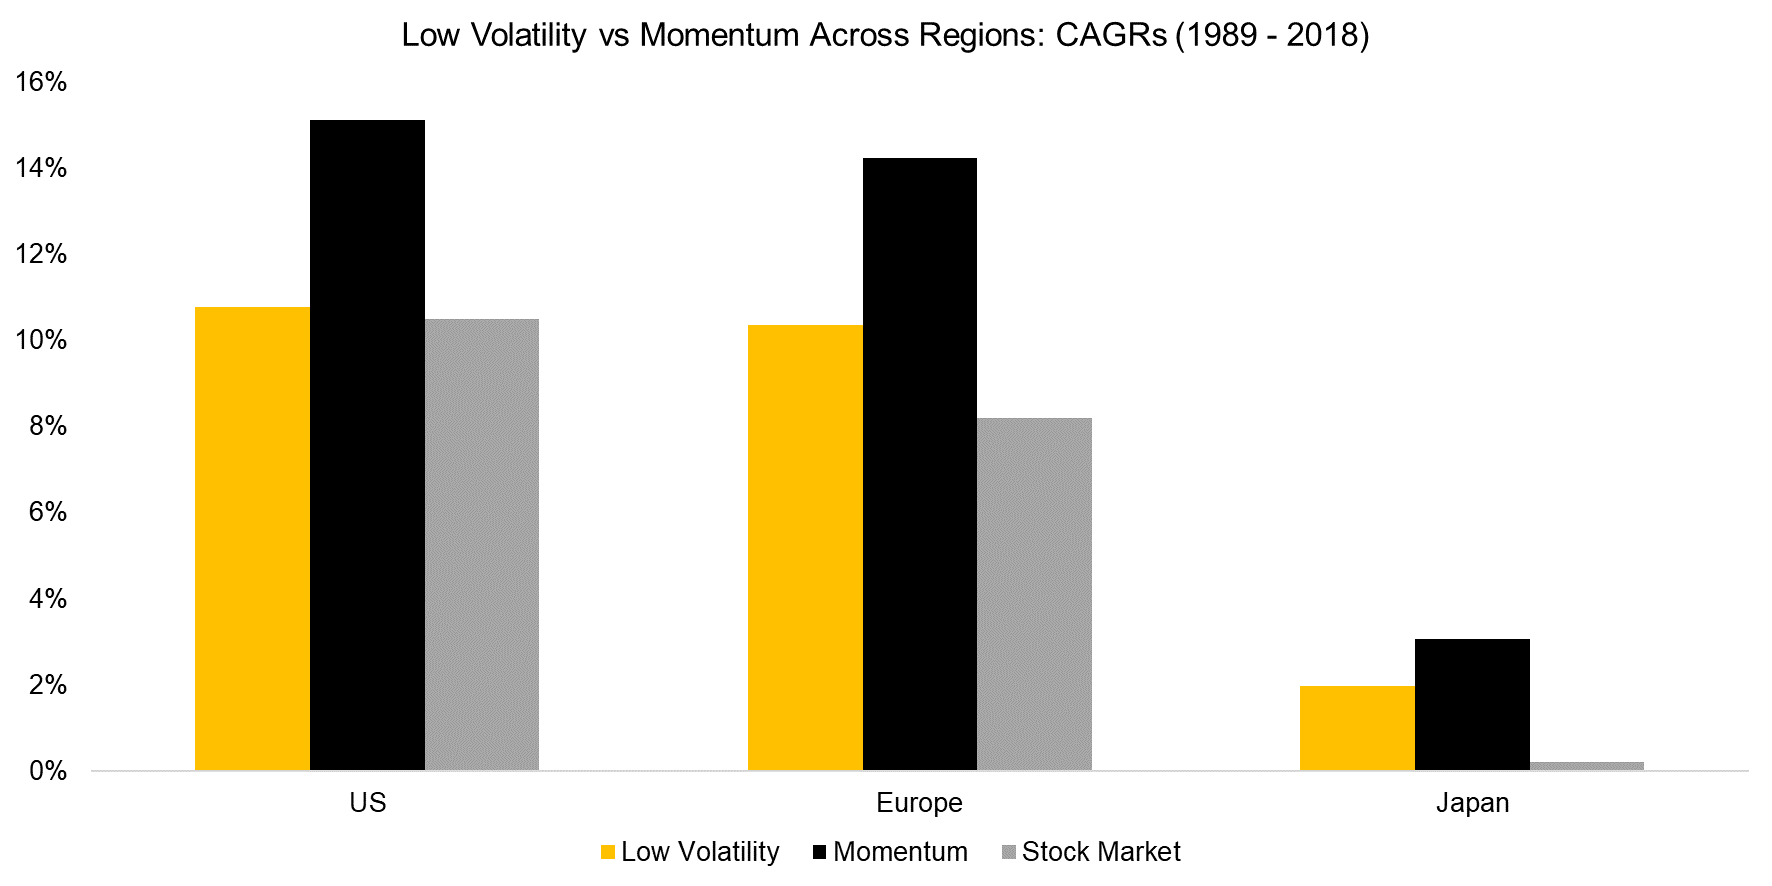
Given the attractive characteristics of LOVM portfolios across markets, it is worth exploring the performance drivers. First, we analyze the returns of the single factors and observe that both generated higher returns than the stock markets, but also that Momentum clearly dominated in generating excess returns.
It is worth noting that the excess returns have been declining across time. The average excess return of the LOVM portfolios was 4.5% per annum from 1989 to 2000, 3.2% from 2000 to 2010, and only 1.1% from 2010 to 2018.
Source: FactorResearch
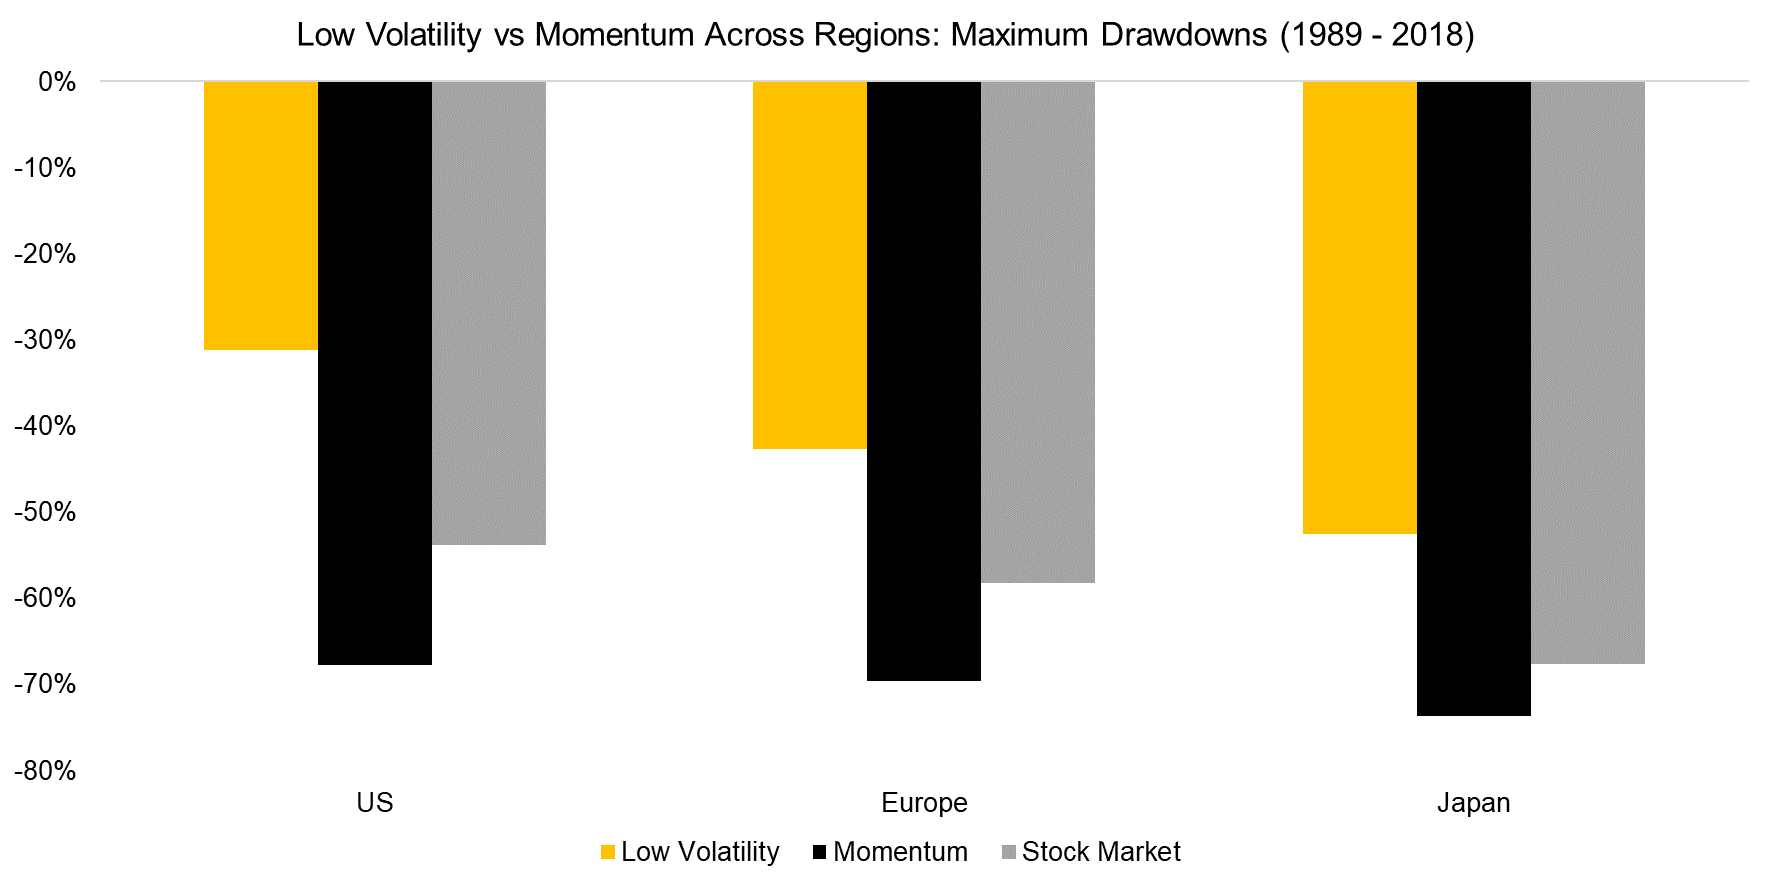
However, returns are only half of the equation and risk the other. As a second step, we calculate the maximum drawdowns over the 30-year period, which highlights that winning stocks lost more than the stock markets when these crashed, but low-risk stocks significantly less.
Analyzing the maximum drawdowns reveals that these occurred in different time periods. The Momentum strategy in the US had its largest cumulative loss in 2002 after a strongly negative performance during the tech bubble implosion. In contrast, the Low Volatility portfolios and the stock markets experienced their worst drawdowns during the global financial crisis in 2009.
Source: FactorResearch
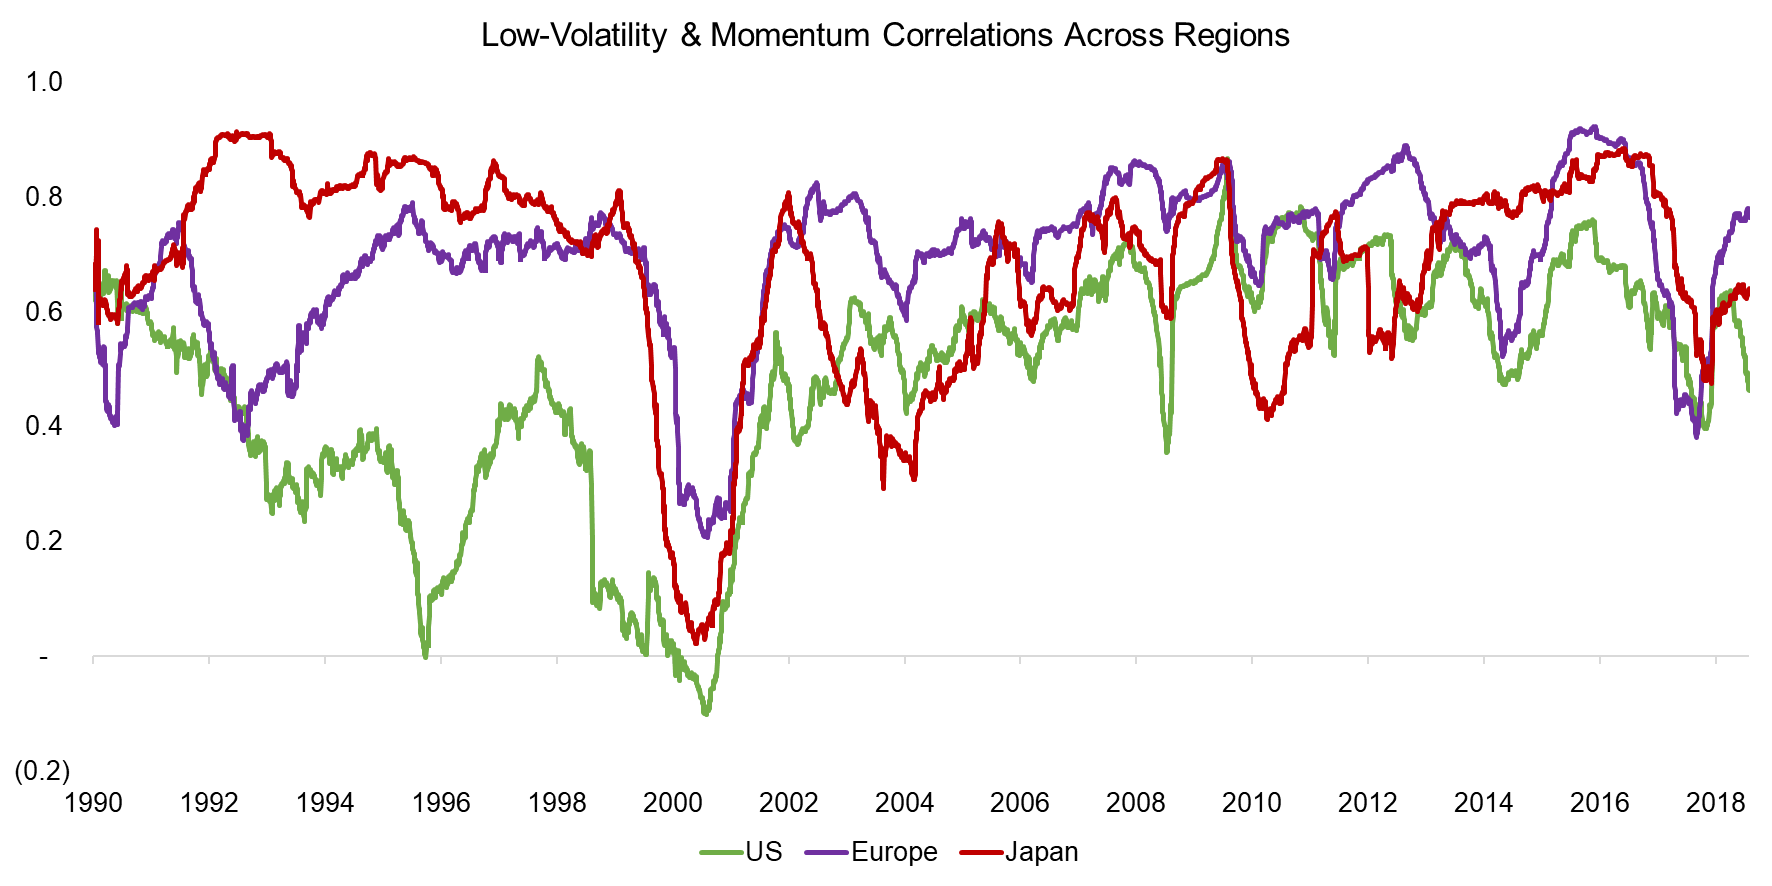
The attractiveness of LOVM portfolios can, therefore, be attributed to the strong performance of Momentum and defensive characteristics of low-risk stocks. However, what has made this factor combination particularly powerful was the low levels of correlation between the two factors across time, especially when combined in a barbell approach like the combination model.
For example, Momentum stocks suffered significantly during the tech bubble implosion post-2000, but had almost a zero correlation to low-risk stocks, which created significant diversification benefits.
Source: FactorResearch.
FURTHER THOUGHTS
Investors have been screening stocks by metrics since the inception of the stock market itself. Although factor investing has merit, performance is cyclical and no factor or combination generates consistent excess returns. Betting on boring stocks has been an attractive strategy over the last few decades, but so has speculating on cheap small caps or cheap winners at other points in time.
Further research is required to establish if there is something particularly unique when combining Low Volatility and Momentum. Value and Momentum also feature low correlations, but have made a far less attractive combination in recent years.
RELATED RESEARCH
ABOUT THE AUTHOR
Nicolas Rabener is the CEO & Founder of Finominal, which empowers professional investors with data, technology, and research insights to improve their investment outcomes. Previously he created Jackdaw Capital, an award-winning quantitative hedge fund. Before that Nicolas worked at GIC and Citigroup in London and New York. Nicolas holds a Master of Finance from HHL Leipzig Graduate School of Management, is a CAIA charter holder, and enjoys endurance sports (Ironman & 100km Ultramarathon).
Connect with me on LinkedIn or X.

