Low Vol Factor: From Obscurity to Stardom
Has Low Vol Changed Given the Rise in Popularity?
August 2019. Reading Time: 10 Minutes. Author: Nicolas Rabener.
SUMMARY
- Given the popularity of Low Volatility, investors might expect structural shifts in the factor characteristics
- Betas, valuations, sector biases, interest rate sensitivity, and factor exposures are highly time-varying
- Although these are worth monitoring from a risk perspective, none seem particularly concerning currently
INTRODUCTION
Germans call a product or service that solves all problems without any compromises a “Eierlegende Wollmilchsau”, which literally means egg-laying wool-milk-pig. Naturally there are few items, if any, that can achieve such a status, although the Swiss might have come close with their multi-functional Swiss army knife, which has proved so useful that even NASA used it in space missions.
Investors are perpetually looking for equivalent products in the investment world. These should feature high returns and low risks. Low Volatility strategies are often thought of approximately providing such desirable characteristics and became popular after 2009 as a portfolio of low-risk stocks experienced a significantly lower drawdown than that of the stock market during the global financial crisis.
The interest has remained strong in recent years as highlighted by the iShares MSCI Min Vol US ETF (USMV), which gathered approximately $6 billion in assets and accordingly became the third-most popular ETF in the US in the first half of 2019. However, although a certain amount of interest in a strategy is needed to generate positive performance, too much can cause crowding and the factor to trade at expensive valuations (read Low Volatility: High Factor Valuation).
In this short research note, we will investigate if the Low Volatility factor has changed structurally over the last 30 years as its status changed from obscurity to a common staple in investment portfolios.
METHODOLOGY
We focus on the Low Volatility factor in the US stock market. The factor performance is calculated by constructing a long-short beta-neutral portfolio of the top and bottom 10% of stocks ranked by their 12-month volatility. Only stocks with a minimum market capitalization of $1 billion are included. Portfolios are rebalanced monthly and each transaction incurs costs of 10 basis points.
LOW VERSUS HIGH VOLATILITY STOCKS
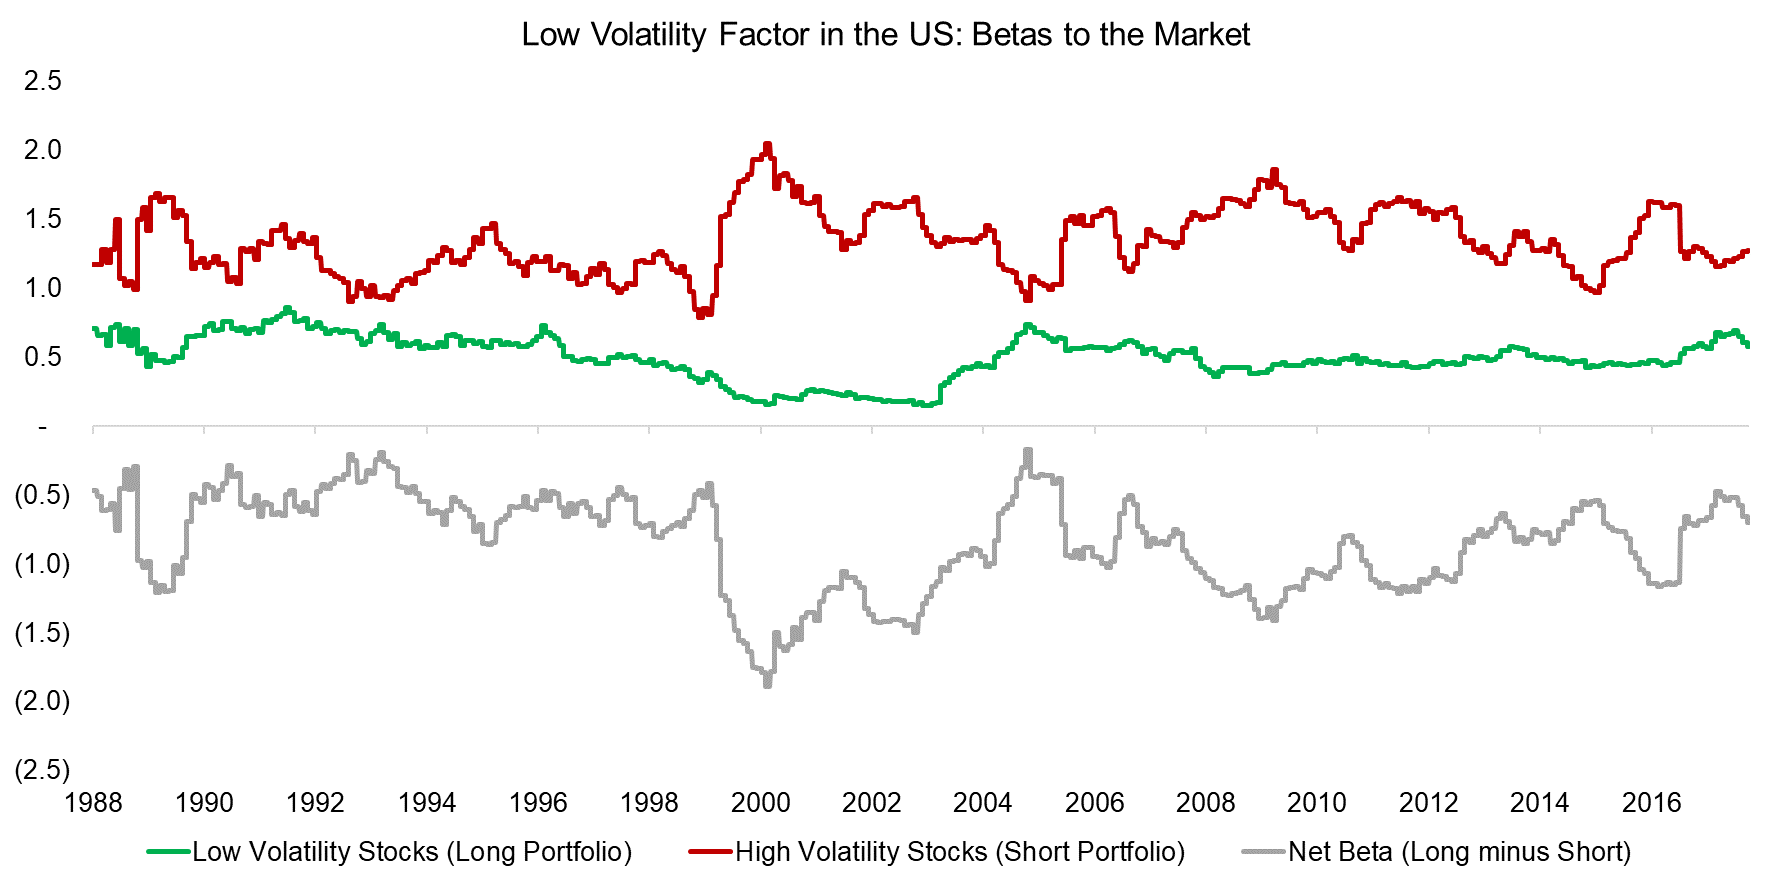
The long portfolio of the Low Volatility factor consists of stocks that exhibited relatively little price volatility over the last year, which is reflected in an average beta of 0.5 to the stock market since 1988, compared to 1.3 for the high-risk stocks that comprise the short portfolio.
We observe that the difference in betas between the long and short portfolios varied significantly across time, but that there have been no structural shifts. The peak difference was reached in 2000, where technology stocks exhibited abnormal amounts of volatility. Overall, the net beta time series exhibits mean-reversion characteristics, which is to be expected given that the portfolio comprises exclusively US stocks, i.e. securities from the same asset class.
Source: FactorResearch
BREAKDOWN BY SECTORS
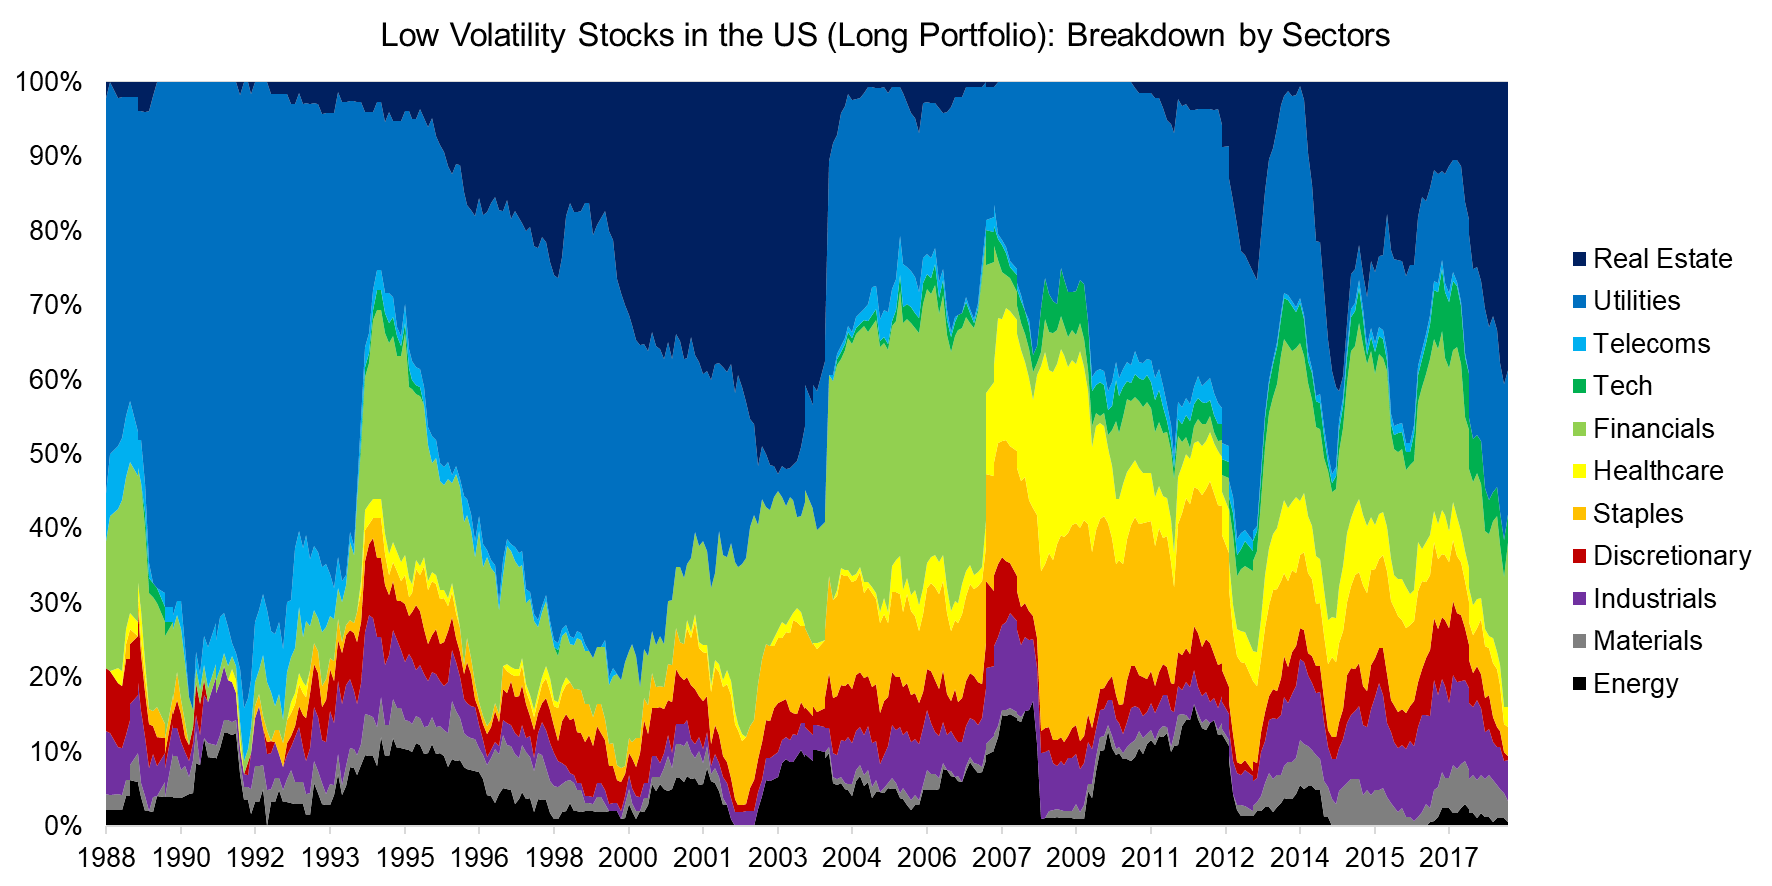
Sectors like real estate and utilities feature companies that have stable cashflows and moderate growth, which reflects in low share price volatility. In contrast, other sectors like technology or energy are comprised of companies that either have high idiosyncratic risks or exposure to commodities like oil, which results in high stock price volatility (read Low Volatility Factor: Interest Rate Sensitivity & Sector-Neutrality).
A long-short Low Volatility portfolio that weights stocks equally therefore exhibits large structural sector biases. These change only slightly over time when industry-specific boom and bust cycles occur. For example, the allocation to the financial sector in the long portfolio decreased to almost zero in 2008 and 2009 as these stocks were in the epicenter of the global financial crisis and became highly volatile.
Source: FactorResearch
FUNDAMENTAL FACTOR VALUATION
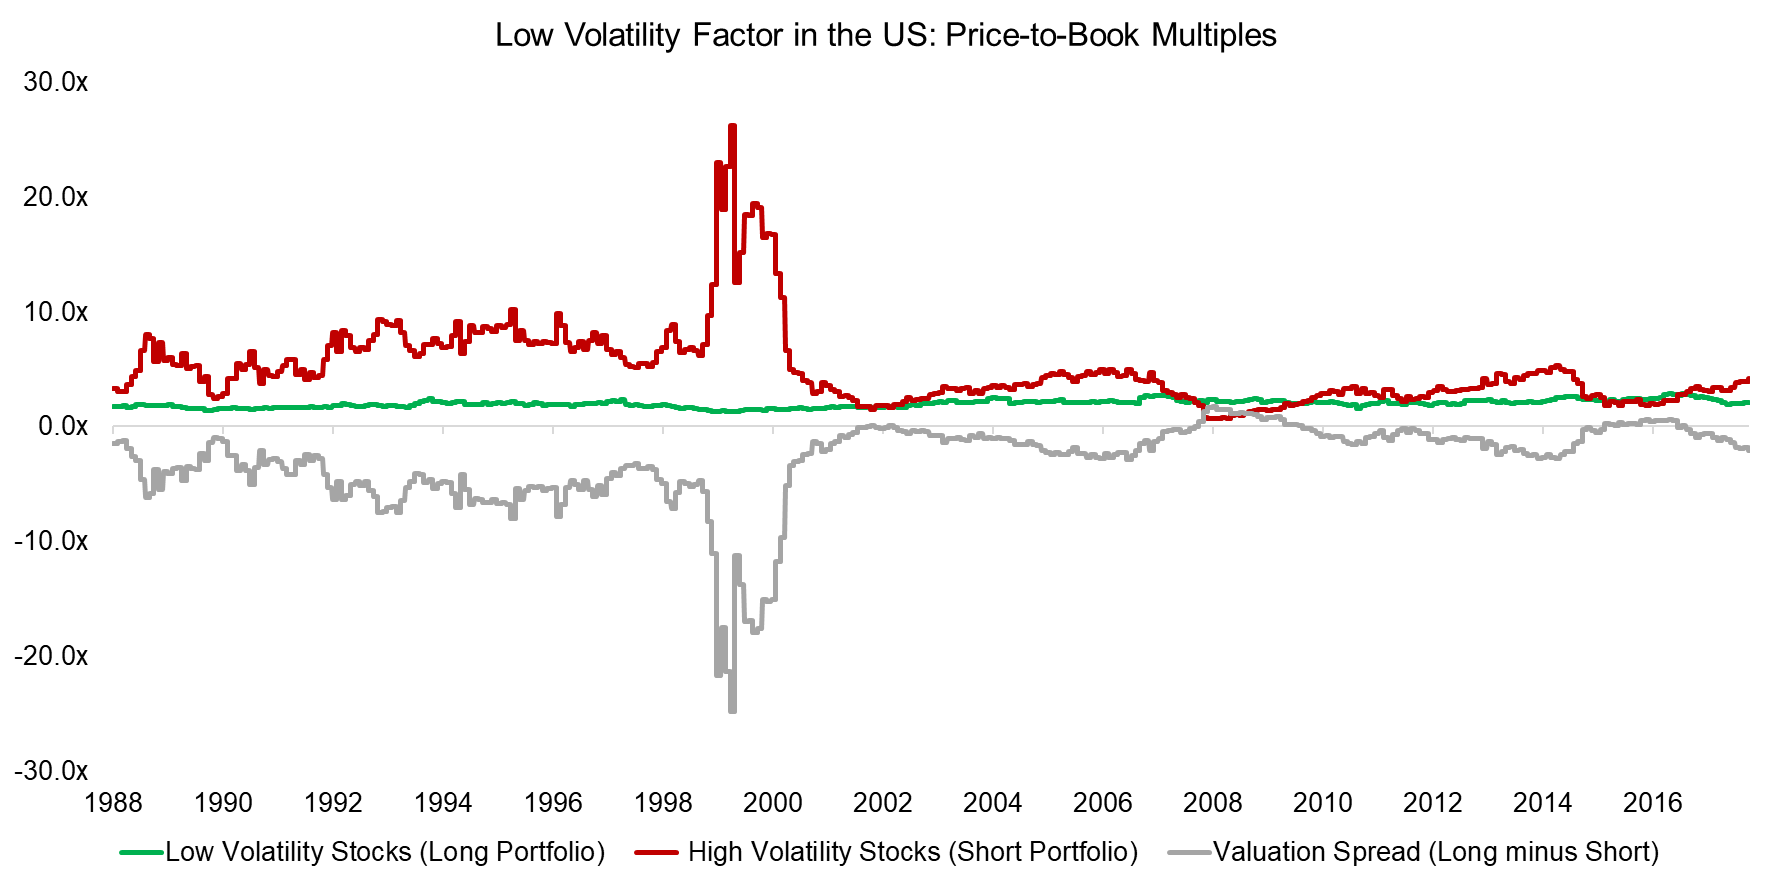
Given the large inflows into Low Volatility products such as smart beta ETFs, investors might question if low-risk stocks have become expensive over time. Factors can be deemed cheap or expensive with valuation metrics similar to when evaluating single stocks. Specifically, we can measure the difference in valuation multiples between the long and short portfolios and compare the current to the historical spread.
We observe that the valuation spread was most negative during the tech bubble in 2009, when volatile technology stocks were trading at abnormally high multiples. The current valuation spread can almost be considered cheap, despite the significant increase in allocations to the strategy in recent years.
Source: FactorResearch
SENSITIVITY TO INTEREST RATES
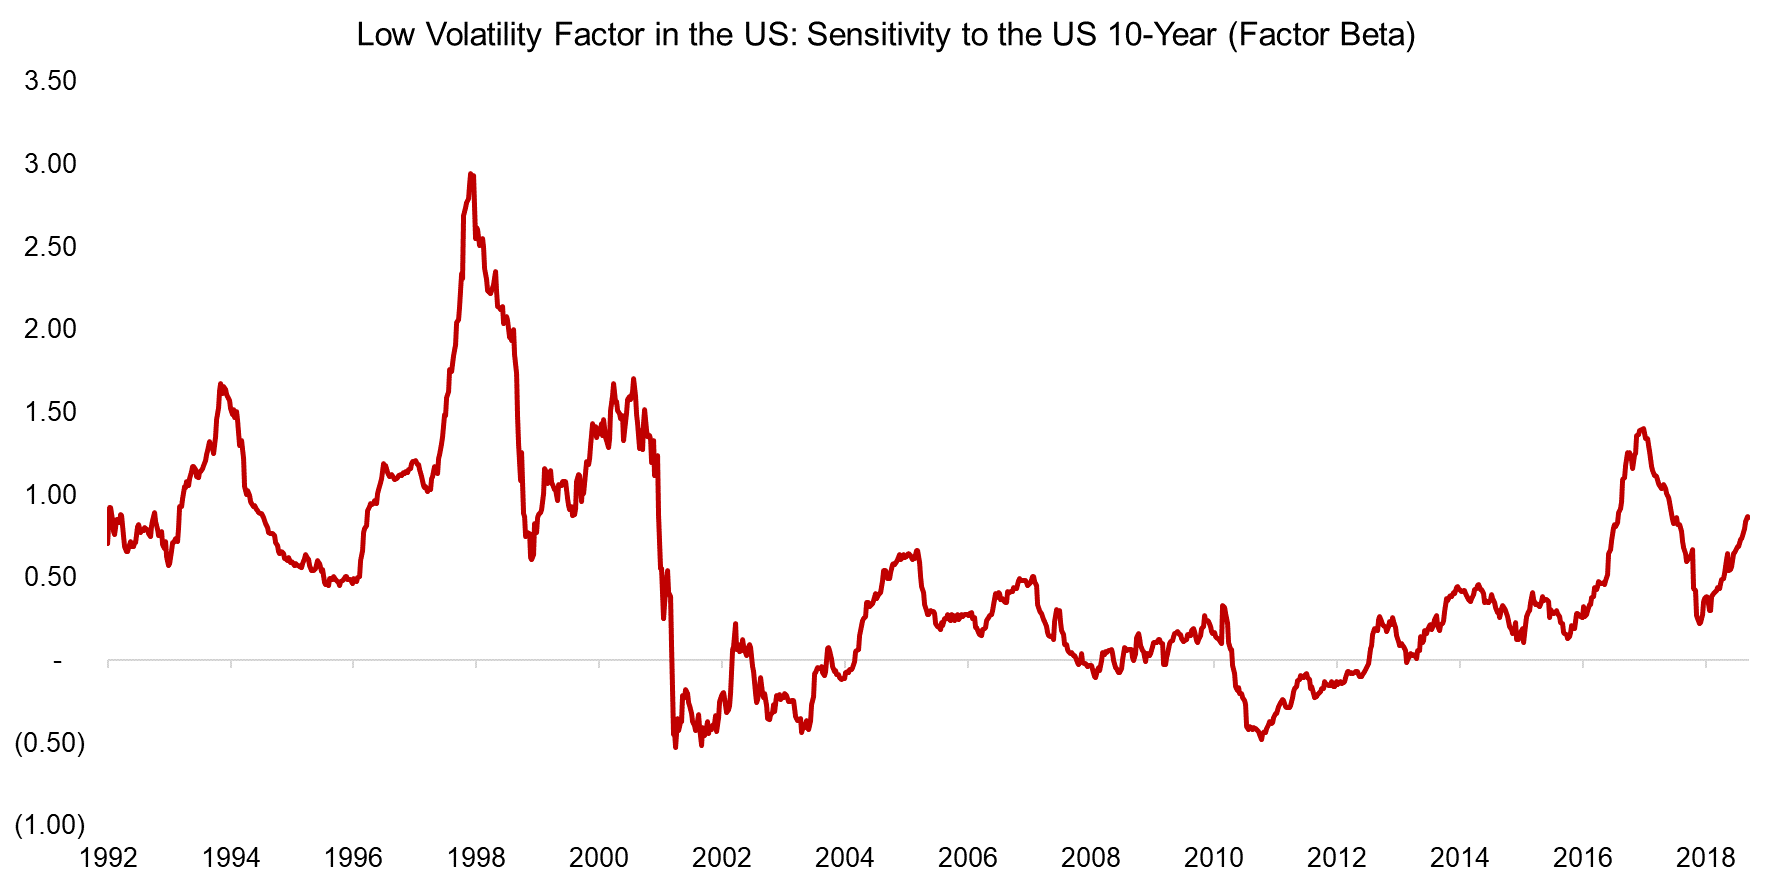
Companies in sectors like utilities and real estate feature low, but stable growth in sales and earnings, which typically results in high corporate leverage. Given the factors’ bias towards these interest rate-sensitive sectors, it exhibited a positive exposure to the US 10-year bond, although it was highly time-varying.
The strong factor performance over the last 30 years can partially be attributed to falling interest rates, which boosted the earnings of highly levered stocks. An environment of rising interests rates would make the strategy less attractive.
Source: FactorResearch
FACTOR EXPOSURE ANALYSIS
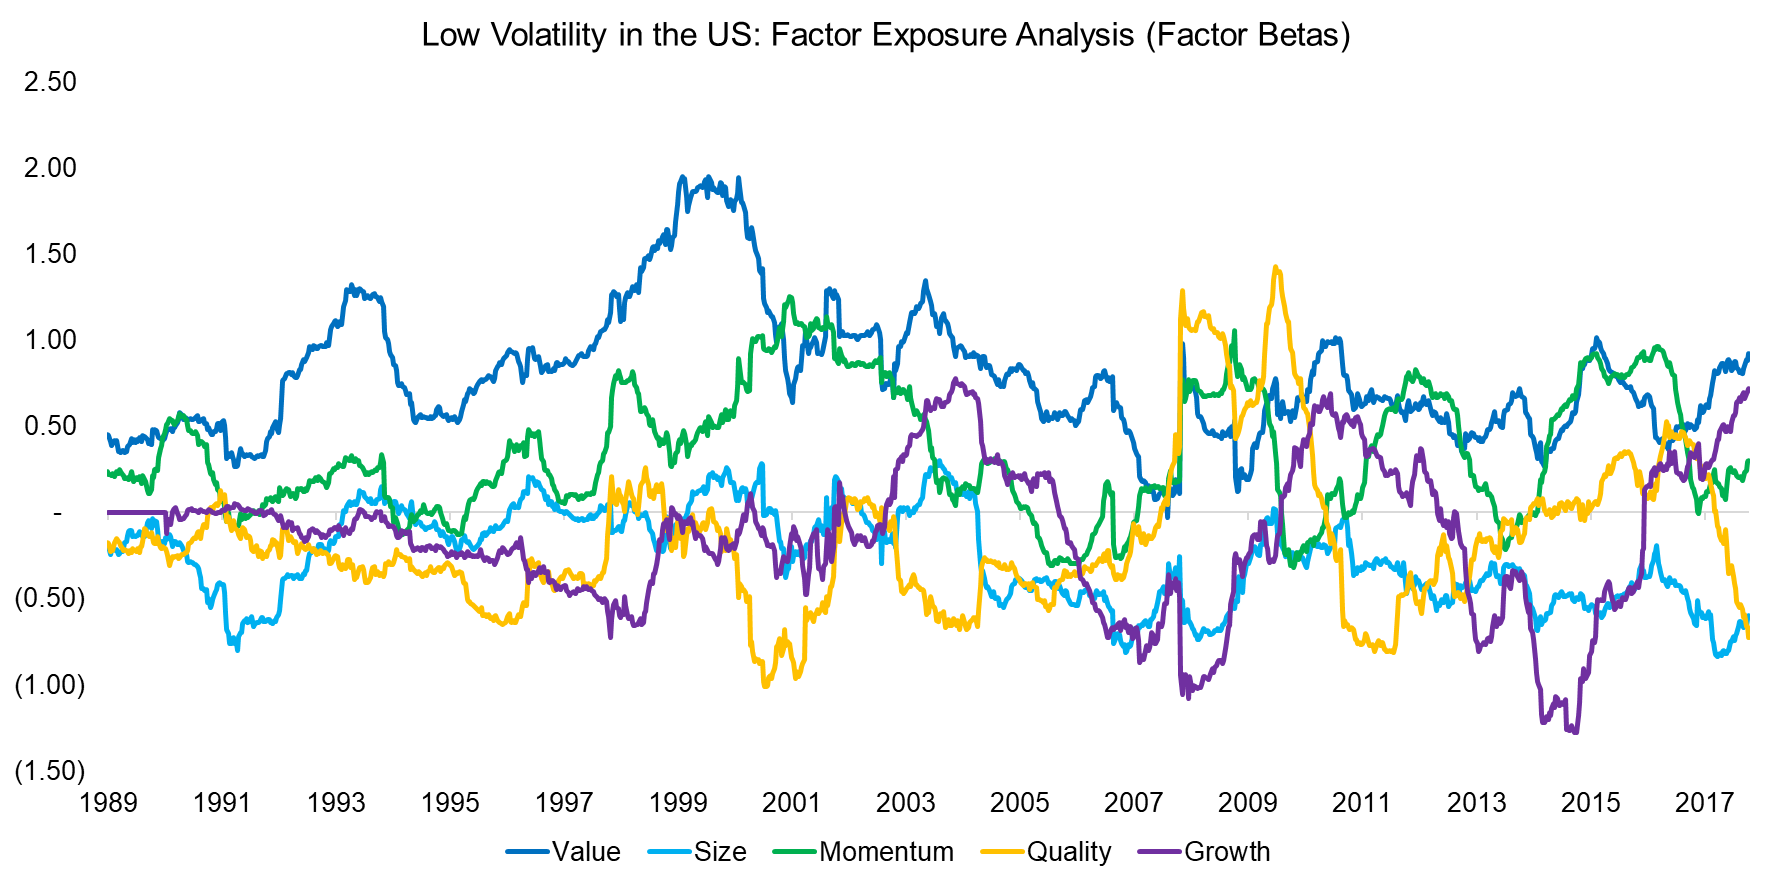
Investors might question if the Low Volatility factor is a proxy for Value, given that both feature cheap stocks in the long and expensive stocks in the short portfolio. A regression analysis confirms exposure to the Value factor, especially in the 1990s.
The exposure to other factors was less extreme and is often intuitive. For example, low-risk stocks are more likely to be large, diversified companies with moderate growth in sales and earnings, which reflects in negative exposure to the Size and Growth factors. It is worth noting that the analysis does not highlight any meaningful structural shifts in factor exposure since 1989.
Source: FactorResearch
OPTIMIZED LOW VOLATILITY FACTOR
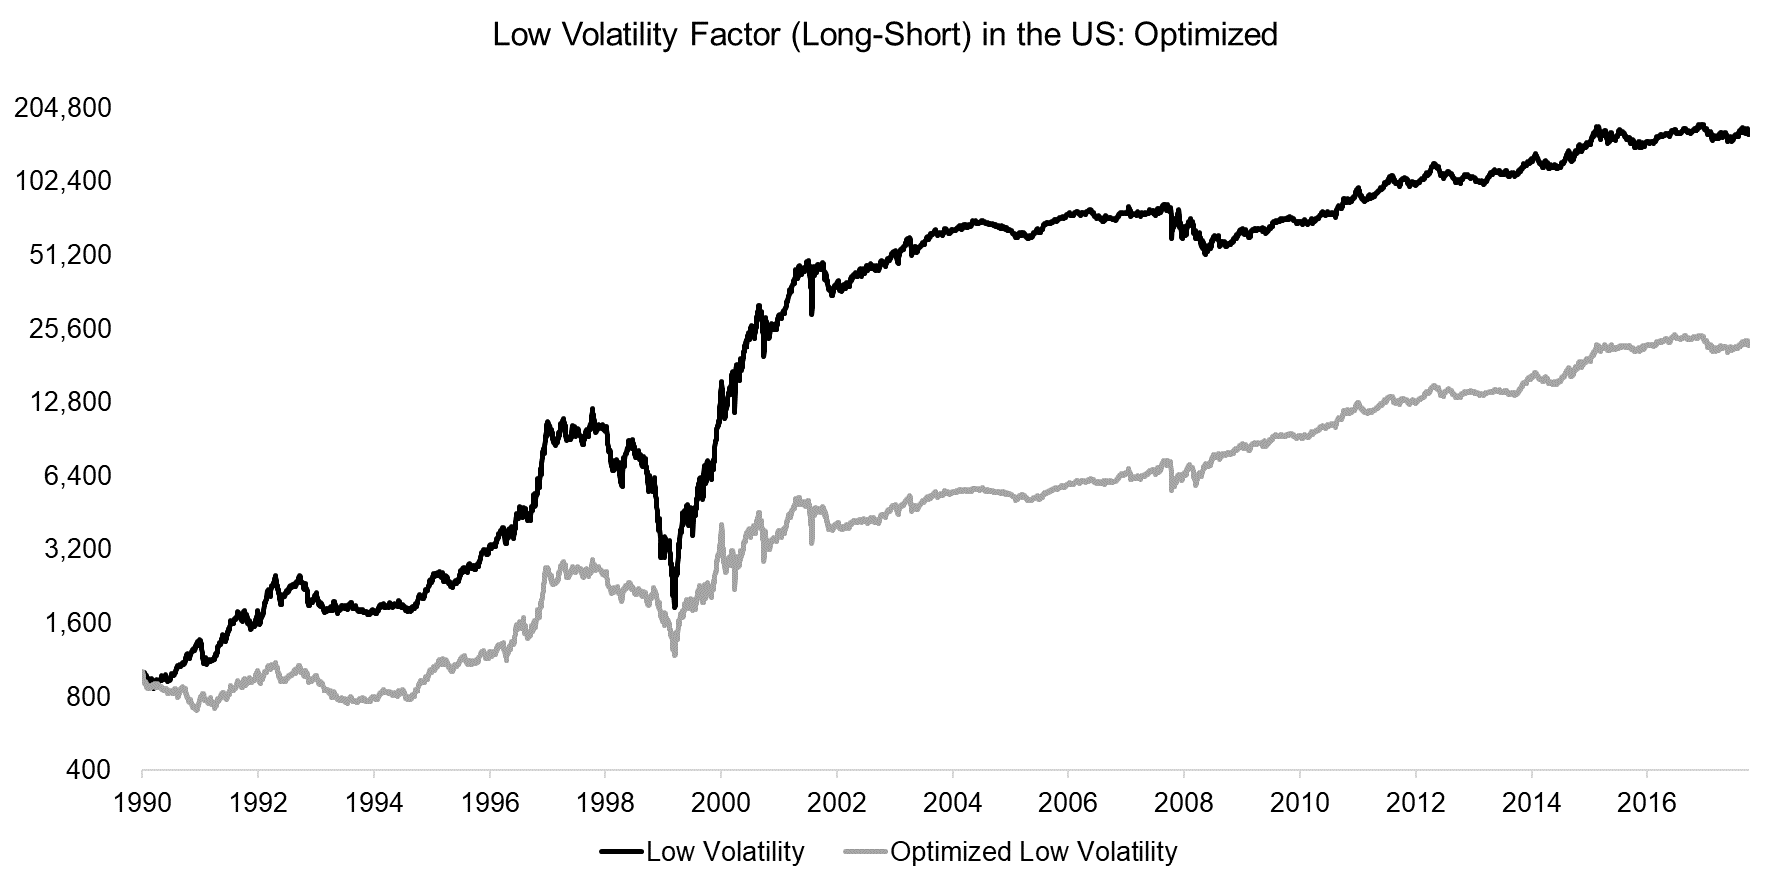
The Low Volatility factor has been the best performing factor in the US over the last 30 years and outperformed other common equity factors like Value, Size, and Momentum by a large margin. We observe that the performance has been relatively consistent across time, except for a significant drawdown during the tech bubble in 2000. Despite the name, the Low Volatility factor occasionally features extreme levels of volatility.
Given the exposure to other factors, it is interesting to explore the residual performance of the Low Volatility factor. We run an optimization process that maximizes the exposure to Low Volatility and minimizes the exposure to common equity factors. The analysis highlights that the optimized Low Volatility factor generated slightly lower returns, which implies that the exposure to other factors like Value was accretive during that time period.
Source: FactorResearch
FURTHER THOUGHTS
This short research note analyses the long-short Low Volatility factor from various perspectives with the objective of detecting any structural changes due to its increase in popularity in recent years. Intuitively the factor would be trading at a more expensive level as measured by the valuation spread, but the results indicate the contrary.
However, the analysis also revealed that during certain periods the factor had significant exposure to interest rates and other common equity factors, which should be monitored as these likely represent unwanted risks.
RELATED RESEARCH
Minimum Variance versus Low Volatility
ABOUT THE AUTHOR
Nicolas Rabener is the CEO & Founder of Finominal, which empowers professional investors with data, technology, and research insights to improve their investment outcomes. Previously he created Jackdaw Capital, an award-winning quantitative hedge fund. Before that Nicolas worked at GIC and Citigroup in London and New York. Nicolas holds a Master of Finance from HHL Leipzig Graduate School of Management, is a CAIA charter holder, and enjoys endurance sports (Ironman & 100km Ultramarathon).
Connect with me on LinkedIn or X.

