Low Volatility Factor: High Valuation
Low Vol Does Not Need to Have Low Vol
July 2017. Reading Time: 10 Minutes. Author: Nicolas Rabener.
SUMMARY
- The Low Volatility factor has generated stellar abnormal returns over the last decades
- Current factor valuations are expensive compared to historical valuations
- Factor volatility is at record lows and will likely surprise investors going forward
INTRODUCTION
The term “low volatility” has been used increasingly in finance over the last two years, on the one hand for describing the current market conditions and alternatively in reference of the large amounts of low volatility products that have been issued. The later describes investment products that buy stocks with low volatility or beta as academics and finance professionals have concluded that these stocks offer more return for their risk than stocks with higher volatility, which is at odds with traditional finance theory. This phenomena can be explained by several behavioural biases, which are mainly a preference for lottery stocks (think “Tesla”) and restrictions on leverage. In this short research note we will analyse the valuation of the low volatility factor across developed markets (read Value & Quality Factor Valuations).
METHODOLOGY
We construct long and short portfolios by ranking stocks according to their one-year volatility. In the US, Europe, and Japan we take the top and bottom 10% of the stock universes while we take the 20% in the other markets due to smaller stock universes. The portfolios are constructed beta-neutral, which does imply significant net exposure as the long portfolio, containing stocks with lower volatility, is levered up while the short portfolio, containing stocks with higher volatility, is levered down. It’s necessary to highlight that the stock universes in Singapore, Hong Kong, and Australia were quite small before 2000, which does have an impact on the meaningfulness of the results.
LOW VOLATILITY FACTOR (LONG / SHORT) PERFORMANCE
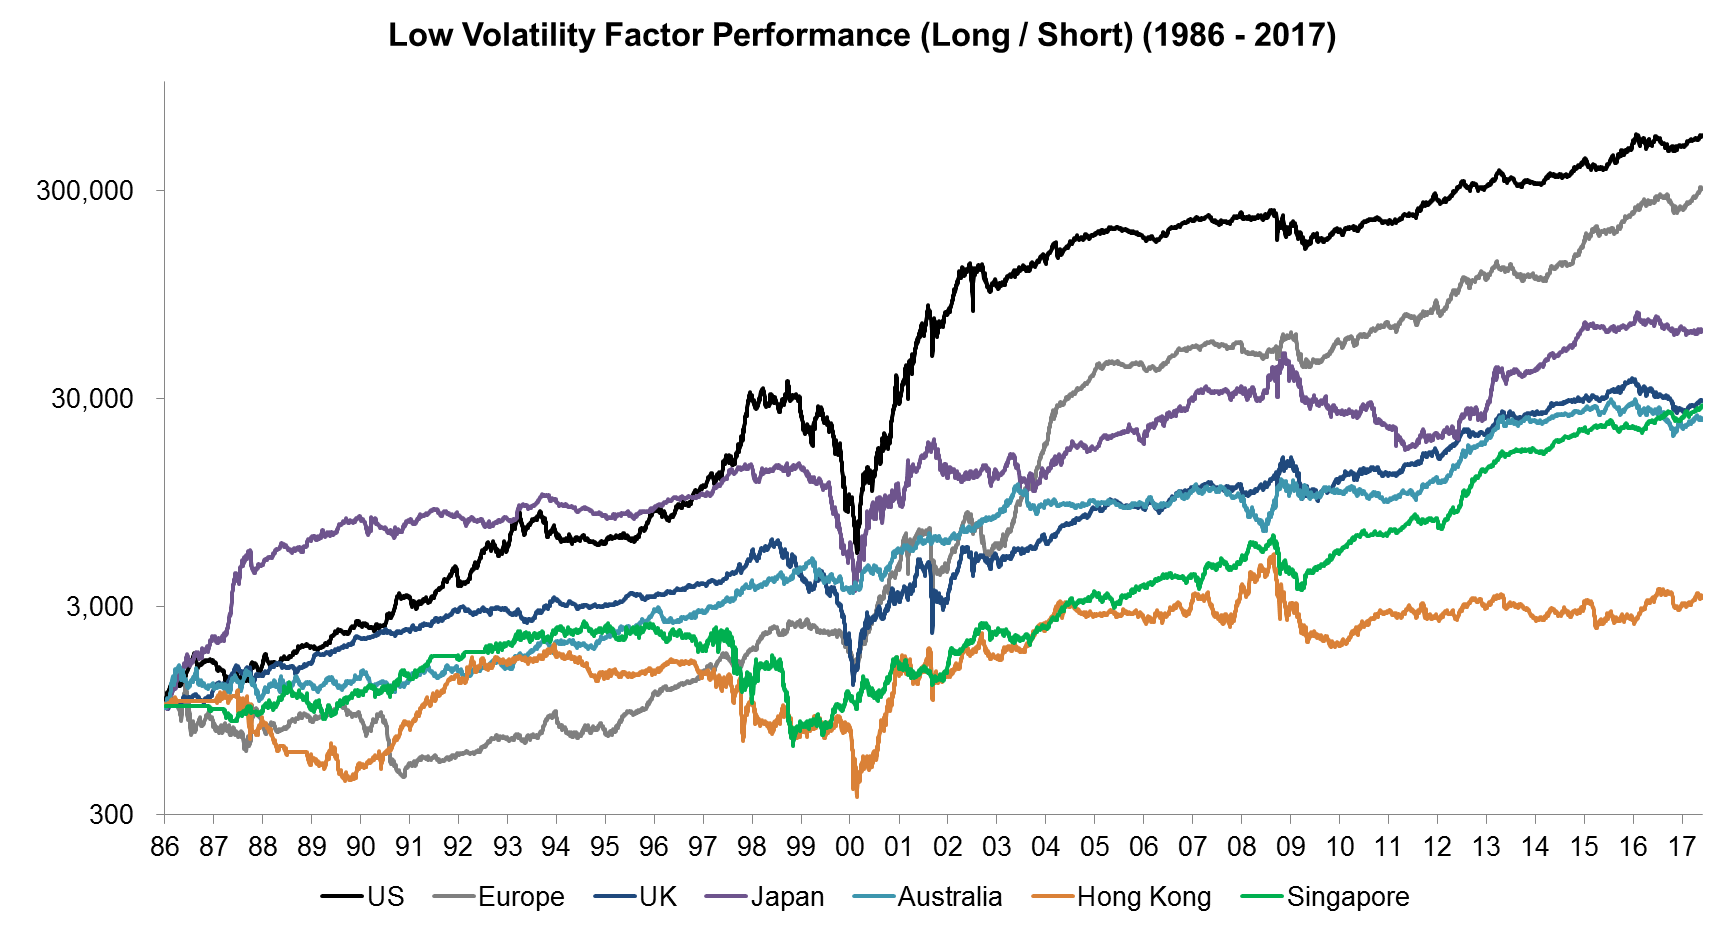
The chart below shows the performance of the Low Volatility factor (long / short) across developed markets from 1986 to 2017. We can observe positive performance in all markets and similar the trends. The most significant drawdowns were experienced in the Tech bubble, where highly volatile Tech stocks significantly outperformed less volatile stocks. Interestingly the drawdowns during the Great Financial Crisis were much less severe.
Source: FactorResearch
LOW VOLATILITY FACTOR VALUATION
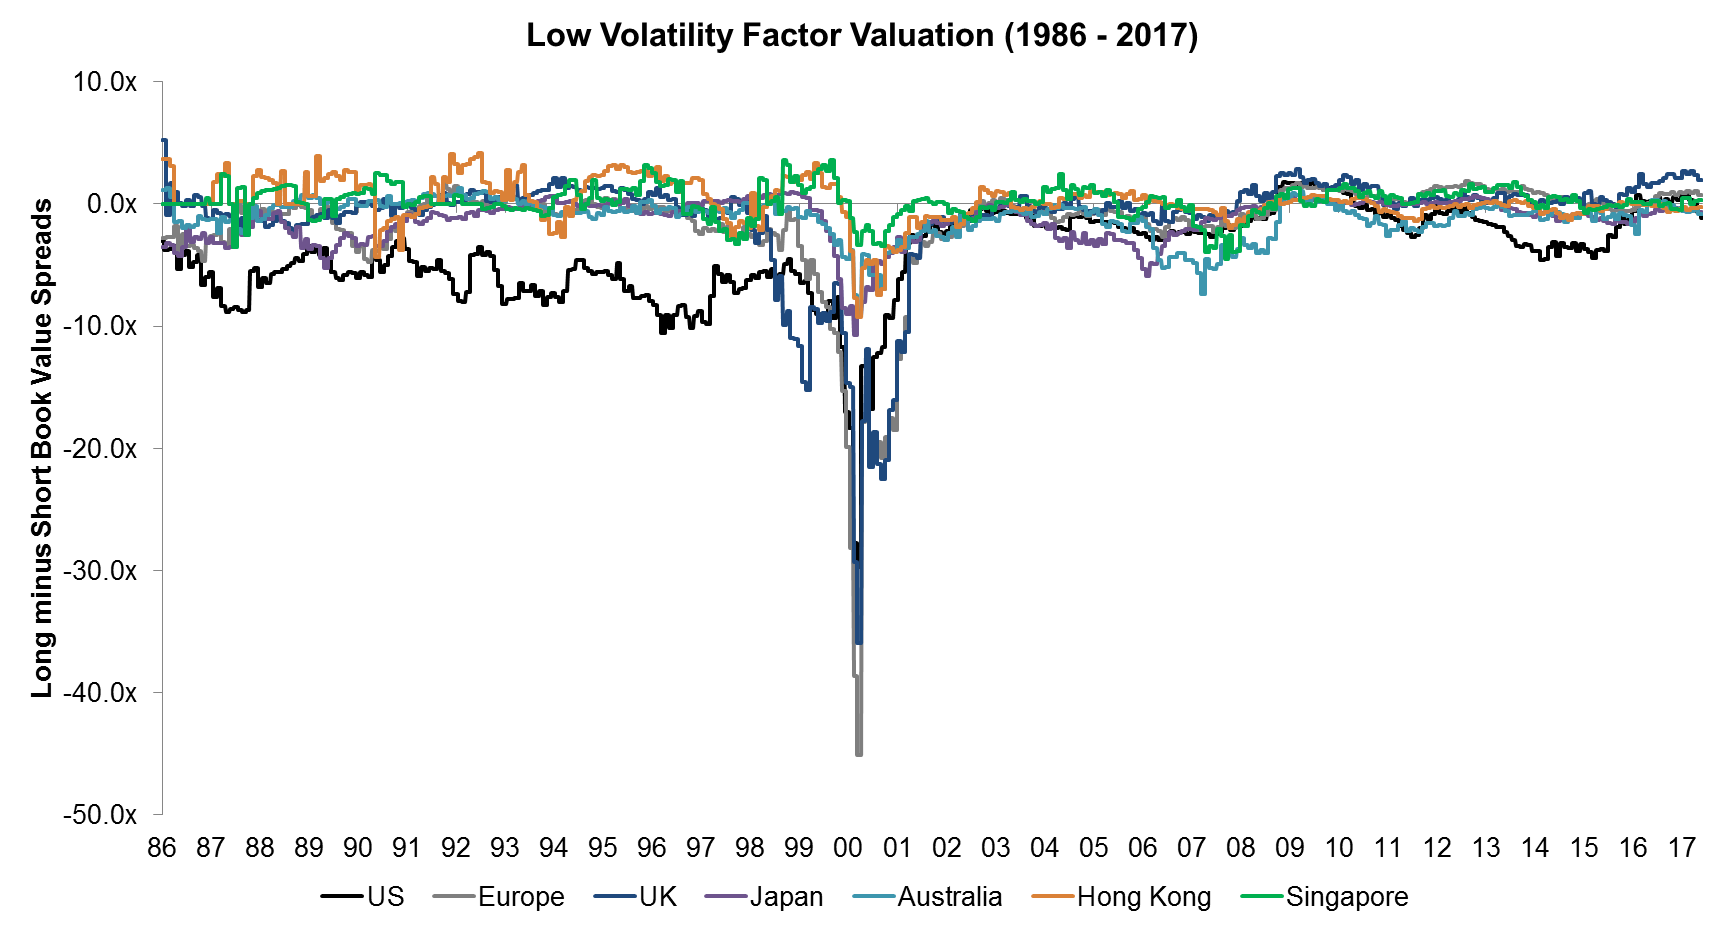
There are various methods of trying to establish if a factor is cheap or expensive and in this analysis we will use the difference in book value multiples between the long and short portfolios. This approach is the equivalent of valuing stocks based on their book value multiple or other fundamental metrics. With regards to factors, the more negative the spread, the cheaper the factor as it implies that the long portfolio is trading at a lower multiples than the short portfolio, e.g. a spread of -5.0x could be derived from the long portfolio being valued at 1.0x (cheap) versus the short portfolio at 6.0x (expensive).
The chart below shows the book value spreads for the period from 1986 to 2017 and is significantly influenced by the Tech bubble, where the low volatility factor experienced the worst drawdowns.
Source: FactorResearch
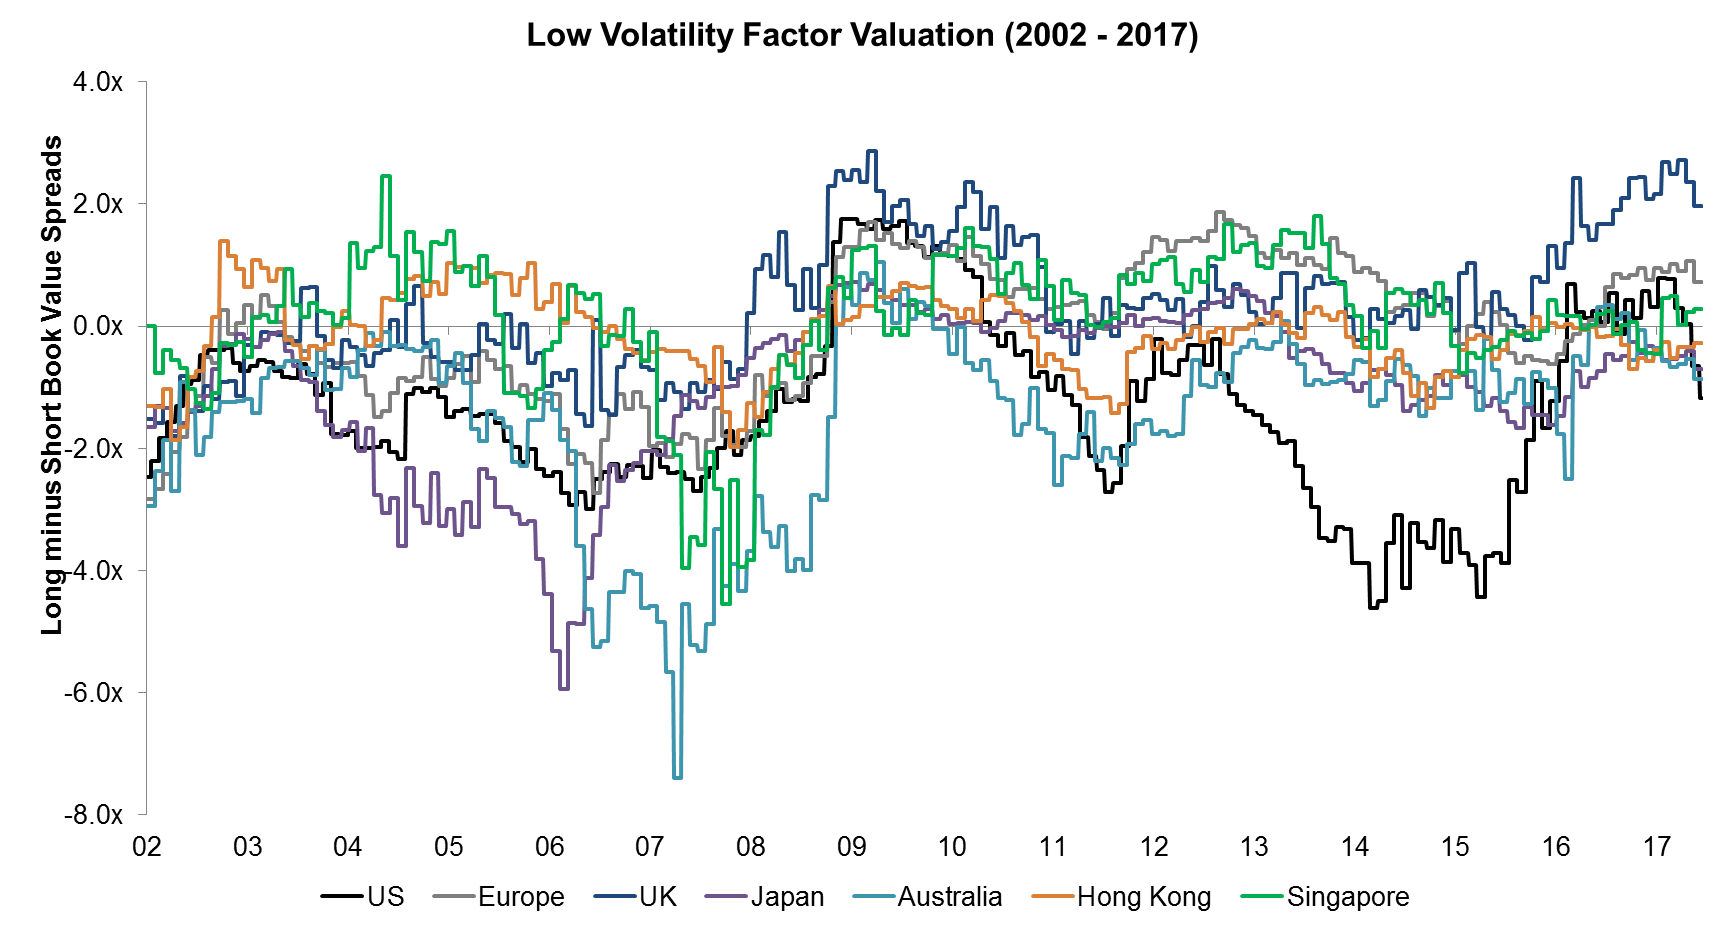
Given the significant impact of the Tech bubble on the Low Volatility factor, it’s interesting to view the chart excluding that period, which can be seen below. The valuation spreads seem to quite volatile over time and follow the same trends across markets.
Source: FactorResearch
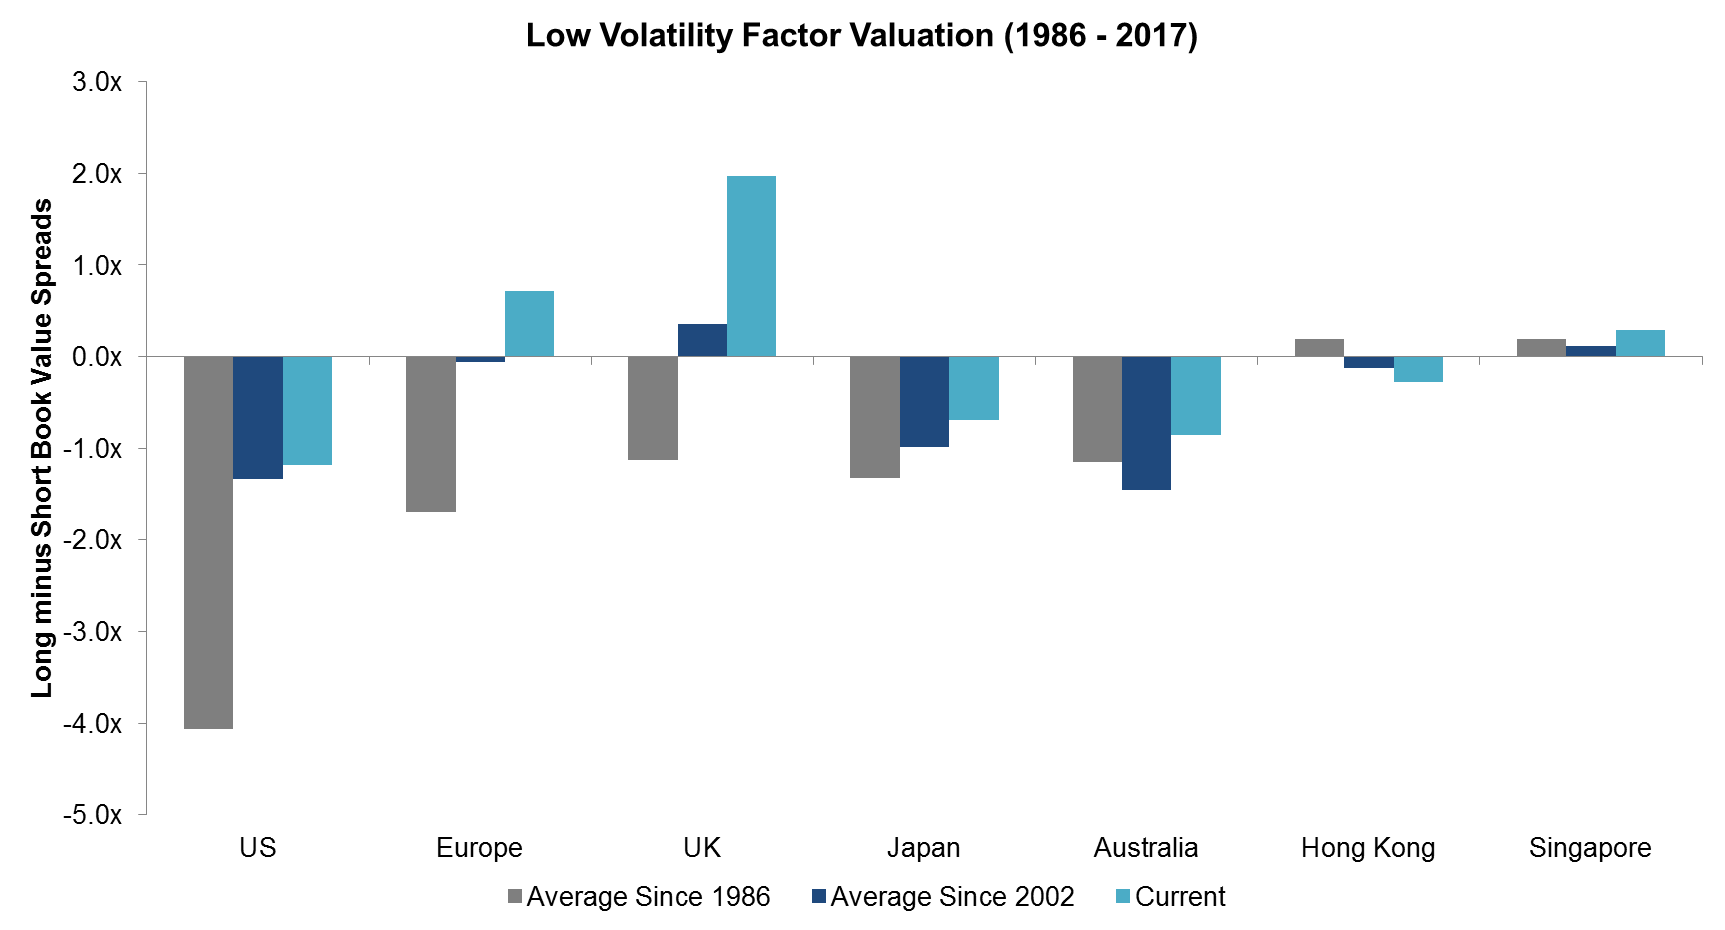
It’s also interesting to compare the current factor valuation spreads compared to historical averages. We have provided historical averages since 1986 and since 2002, which show that current valuation spreads are more positive, which implies the factor is more expensive, especially in Europe and the UK. The positive spreads indicate that the long portfolios are trading at a higher book value multiple than the short portfolios.
Source: FactorResearch
LOW VOLATILITY FACTOR VOLATILITY
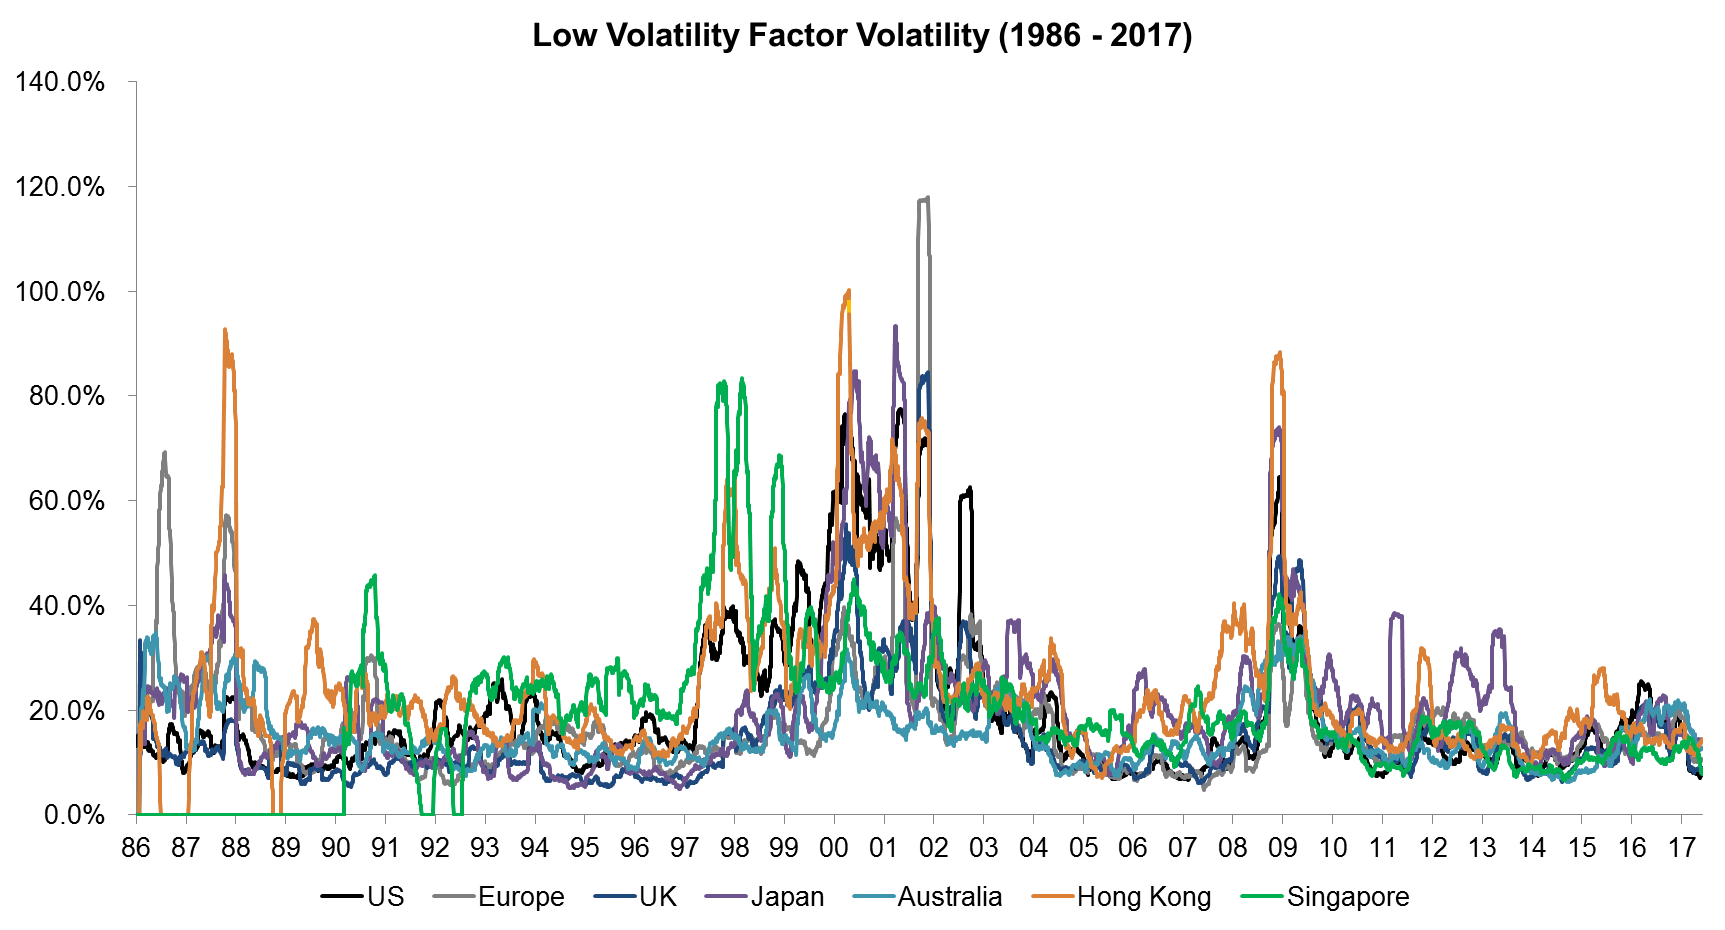
Investors have been rushing into Low Volatility products over the last few years as the factor performance was strong and supportive research was published. The notion of buying stocks, which typically have higher returns than bonds, but with low volatility is an intuitively appealing strategy, it almost sounds like a free lunch. Having said this, the recent factor volatility has been at record lows, mirroring the record low market volatility. As the chart below shows, the Low Volatility factor can exhibit high volatility, which might surprise some investors (read Market & Factor Volatility).
Source: FactorResearch
FURTHER THOUGHTS
This short research note shows that the current valuation of the Low Volatility factor using book value spreads is expensive compared to historical averages across markets, but similar to equity markets, there is little evidence that valuations matter for returns in the short-term. However, for an investor with a medium- to long-term horizon, where starting valuations do tend to impact expected returns, other factors might be more attractive.
ABOUT THE AUTHOR
Nicolas Rabener is the CEO & Founder of Finominal, which empowers professional investors with data, technology, and research insights to improve their investment outcomes. Previously he created Jackdaw Capital, an award-winning quantitative hedge fund. Before that Nicolas worked at GIC and Citigroup in London and New York. Nicolas holds a Master of Finance from HHL Leipzig Graduate School of Management, is a CAIA charter holder, and enjoys endurance sports (Ironman & 100km Ultramarathon).
Connect with me on LinkedIn or X.

