Low Volatility, Low Beta & Low Correlation
There is Magic in Leverage
August 2018. Reading Time: 10 Minutes. Author: Nicolas Rabener.
SUMMARY
- The Low Volatility, Low Beta and Low Correlation factors are interrelated
- Low-risk factors generate attractive risk-adjusted returns, but require beta-neutrality
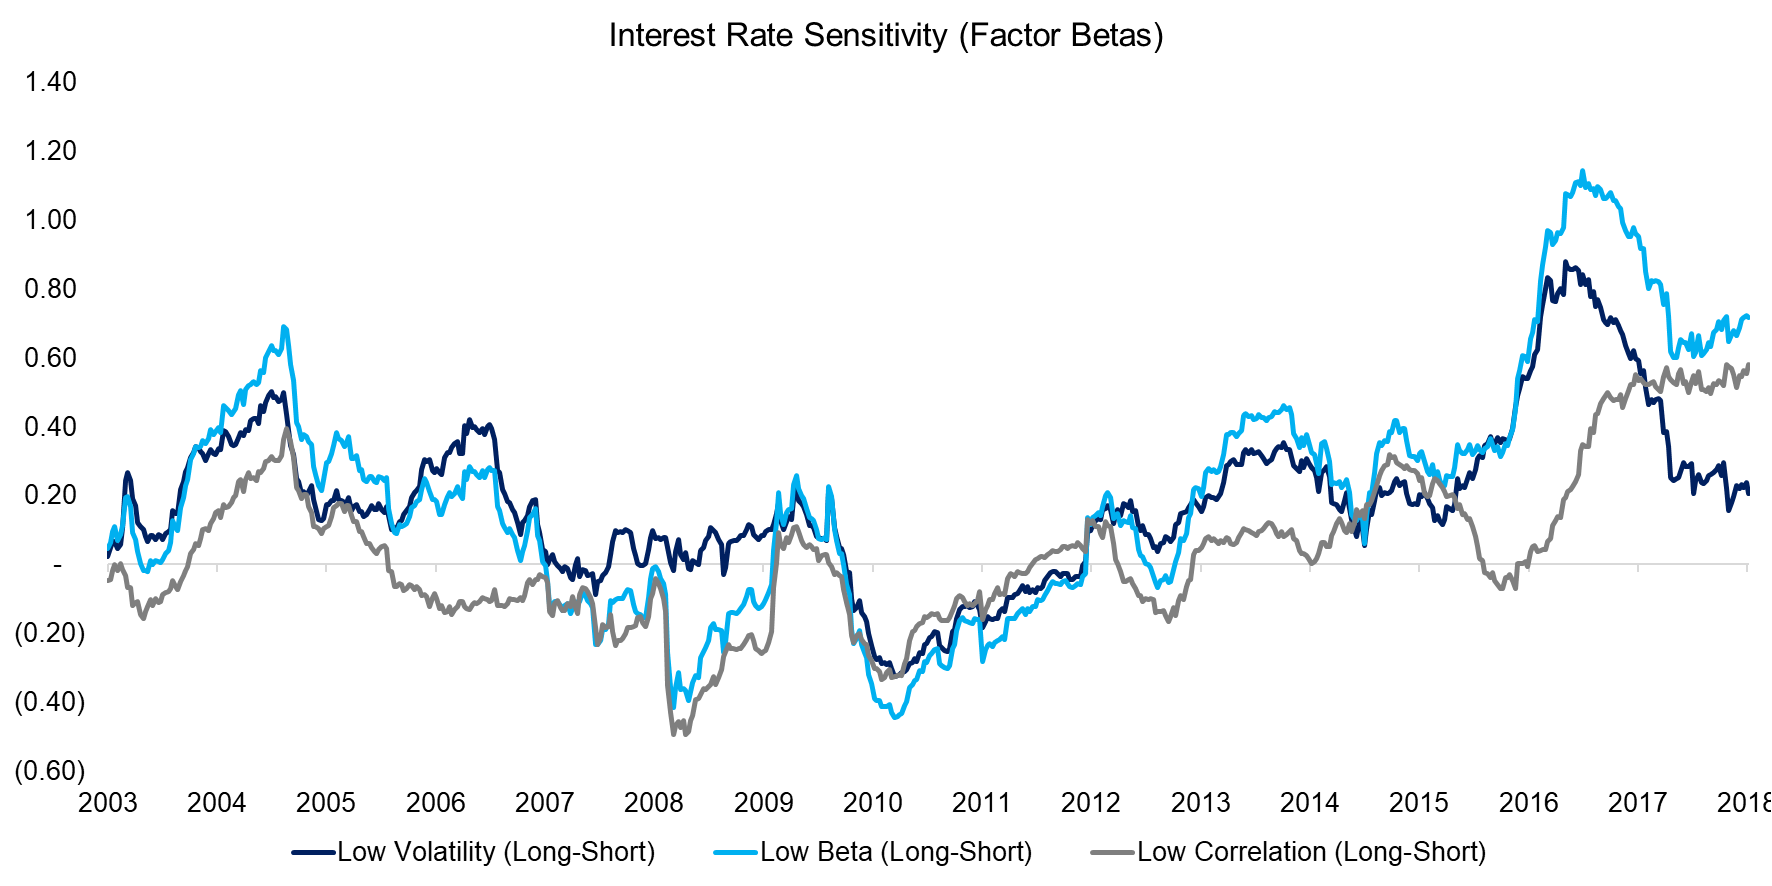
- Currently they feature moderate to high interest-rate sensitivity
INTRODUCTION
Coca-Cola versus Bitcoin Investment Trust, Mattel versus Groupon, Ventas versus Facebook. Which stocks would you prefer? These stock pairs represent low versus high volatility, low versus high beta, and low versus high correlation to the market. Most traditional stocks pickers likely consider these metrics exotic compared to evaluating stocks on their valuation or quality characteristics. Aside from the quantitative nature of these metrics, the theory that stocks with low risks outperform stocks with high risks is counterintuitive and in conflict with a classic finance education. However, given a strong performance of low-risk factors over the last two decades, these are becoming more common in portfolios. In this short research note we will investigate and contrast the Low Volatility, Low Beta and Low Correlation factors (read Low Volatility: High Factor Valuation).
METHODOLOGY
We focus on the Low Volatility, Low Beta and Low Correlation factors in the US, European and Japanese stock markets. The factor performance is calculated by constructing long-short portfolios of the top and bottom 30% of stocks ranked by the factor definitions. Low Volatility ranks stocks by their volatility, low beta by their beta to the market, and low correlation by their correlation to the market, all measured with a 12-month lookback period. Only stocks with a minimum market capitalisation of $1 billion are included. Portfolios are rebalanced monthly and each transaction incurs costs of 10 basis points.
NET BETAS OF THE LOW VOLATILITY, NET BETA & LOW CORRELATION FACTORS
Investors musing about Coca-Cola (KO) versus the Bitcoin Investment Trust (GBTC) are naturally aware of the different risk profiles. Coca-Cola is a stable, mature business selling flavoured drinks in over 100 countries and counts Warren Buffett as a shareholder. The Bitcoin Investment Trust provides investors exposure to Bitcoin, which is highly volatile, and has a much younger shareholder base. The long portfolio of the Low Volatility factor, which contains stocks like KO, has a much lower beta than the short portfolio.
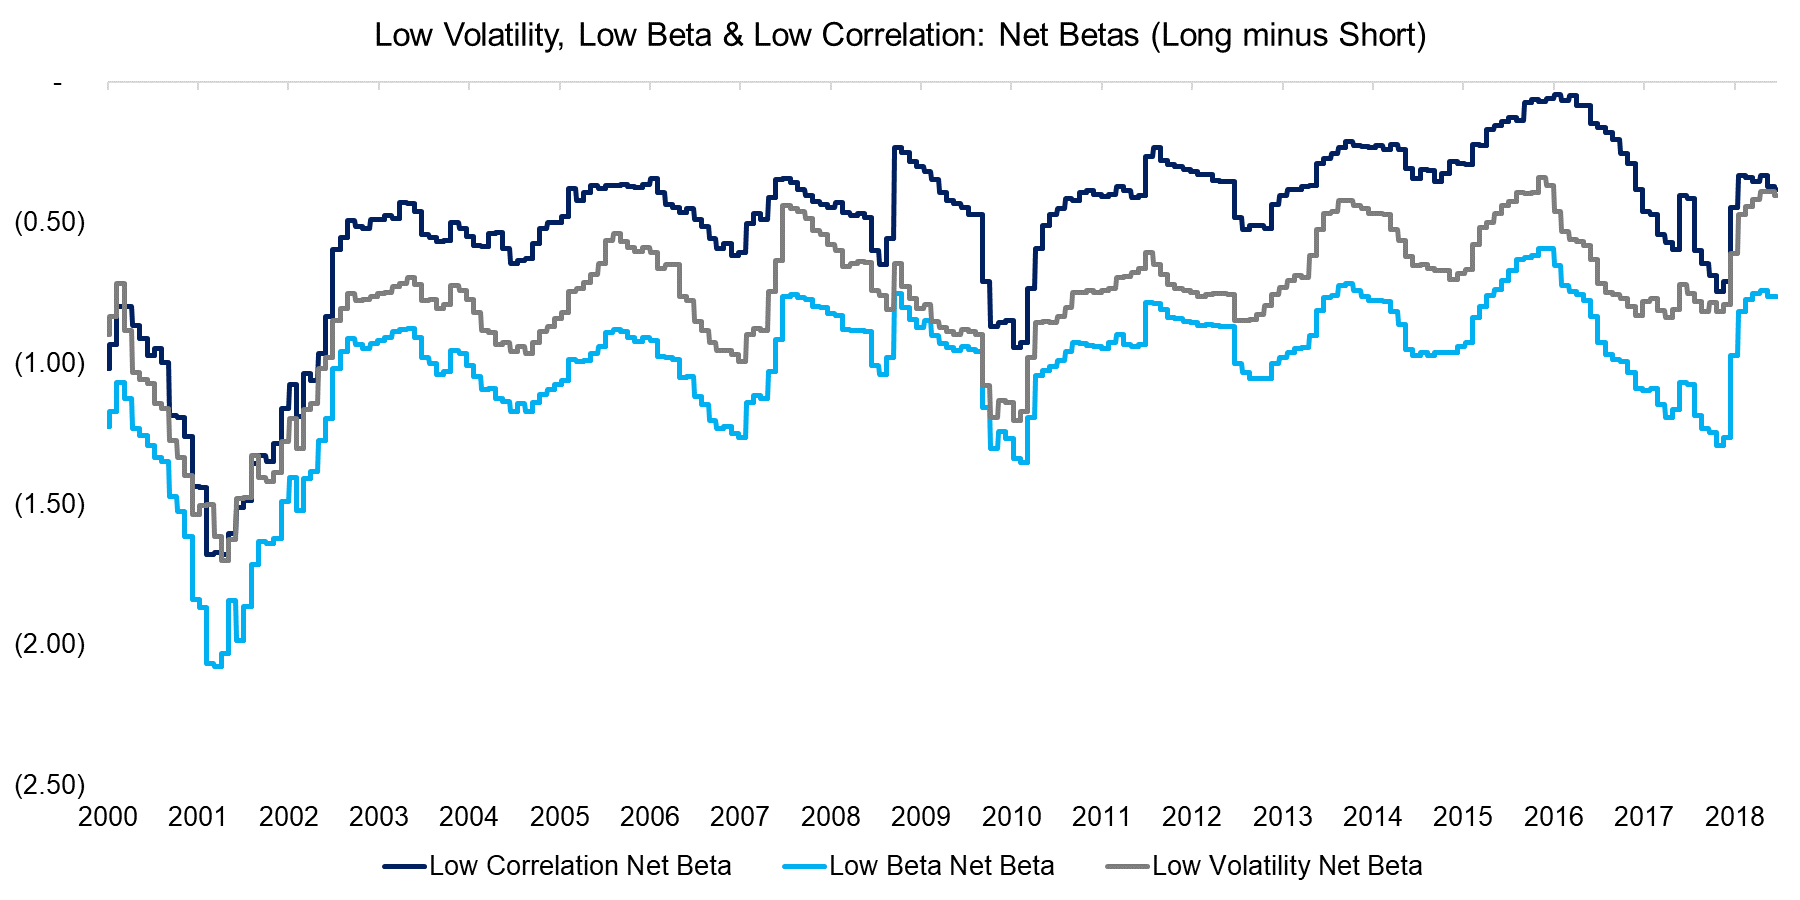
The chart below exhibits the net betas, which represent the difference between the betas of the long and short portfolios, of the Low Volatility, Low Beta and Low Correlation factors in the US. We can observe consistently negative net betas, which were especially extreme during the Tech bubble in 2000 when investors were aggressively chasing speculative technology stocks and ignoring “old economy” companies.
Source: FactorResearch
PERFORMANCE OF THE LOW VOLATILITY, LOW BETA & LOW CORRELATION FACTORS
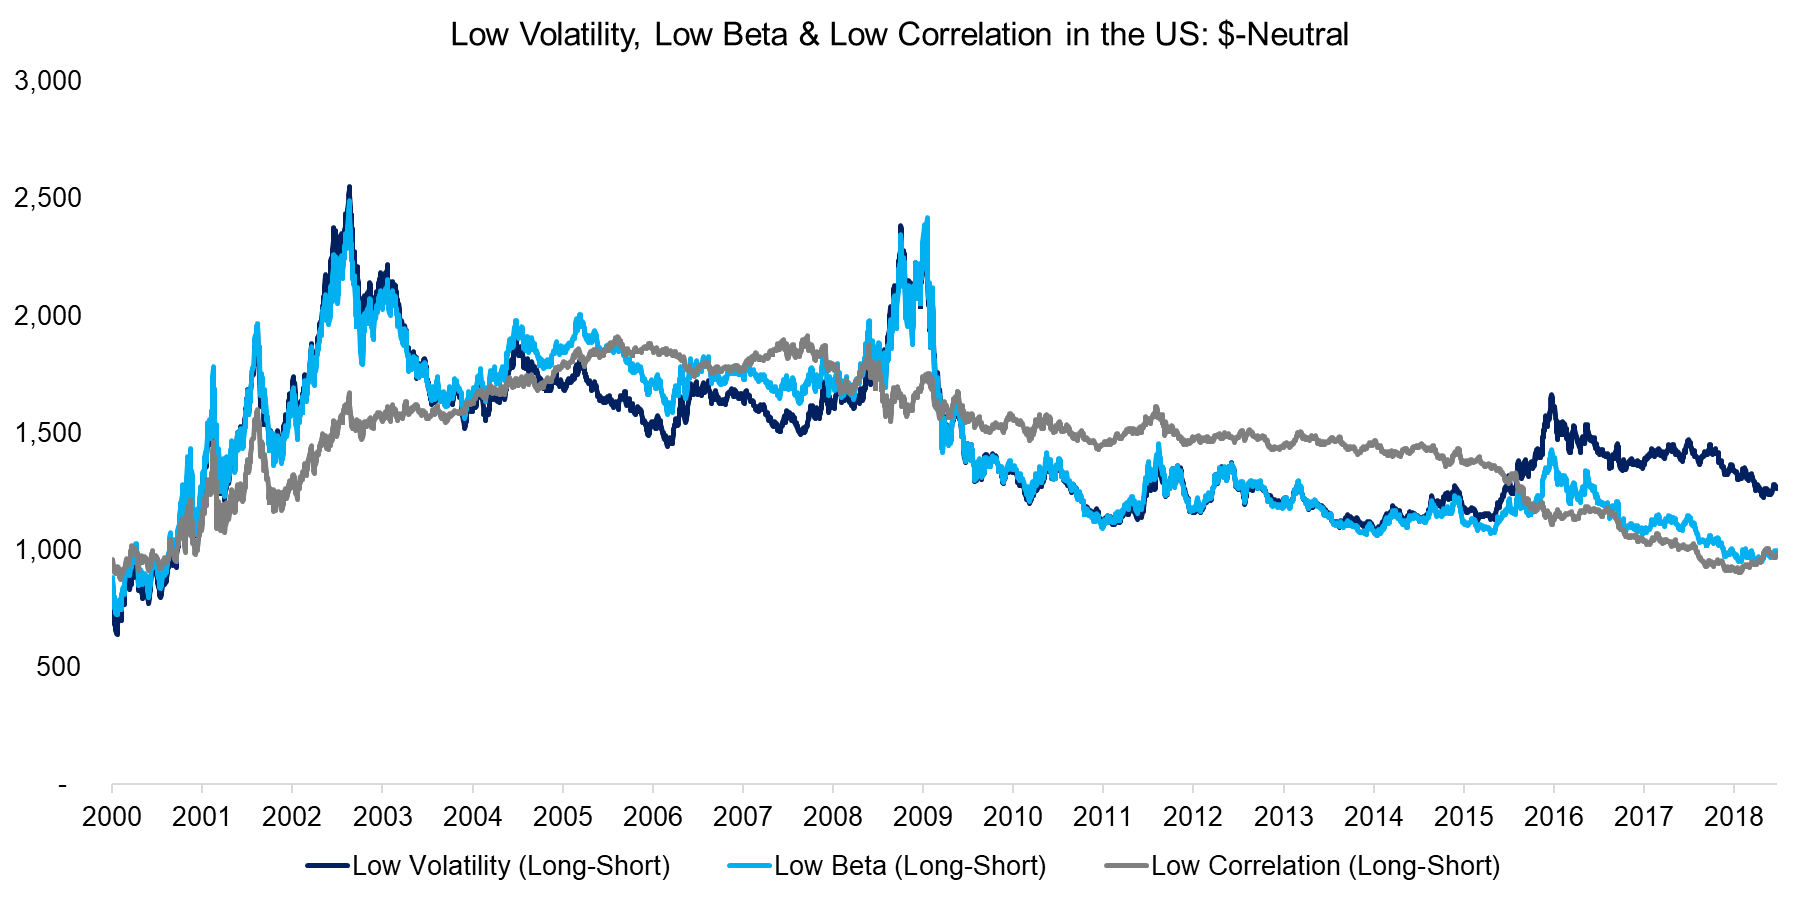
The two common theories supporting positive excess returns from low-risk factors are investors’ aversion to leverage and preference for lottery stocks. The chart below shows the performance of the three factors in the US structured as dollar-neutral portfolios, i.e. every $100 long position is matched with a $100 short position to achieve market-neutrality. We can observe a stellar performance from 2000 to 2003, which represents the implosion of the Tech bubble. The forgotten, unexciting stocks featuring low volatility, low beta or low correlation significantly outperformed the former stars of the stock market. However, post the Global Financial Crisis the performance of all three factors has been consistently negative, which is expected given the structural negative net beta and rising stock markets since 2010.
Source: FactorResearch
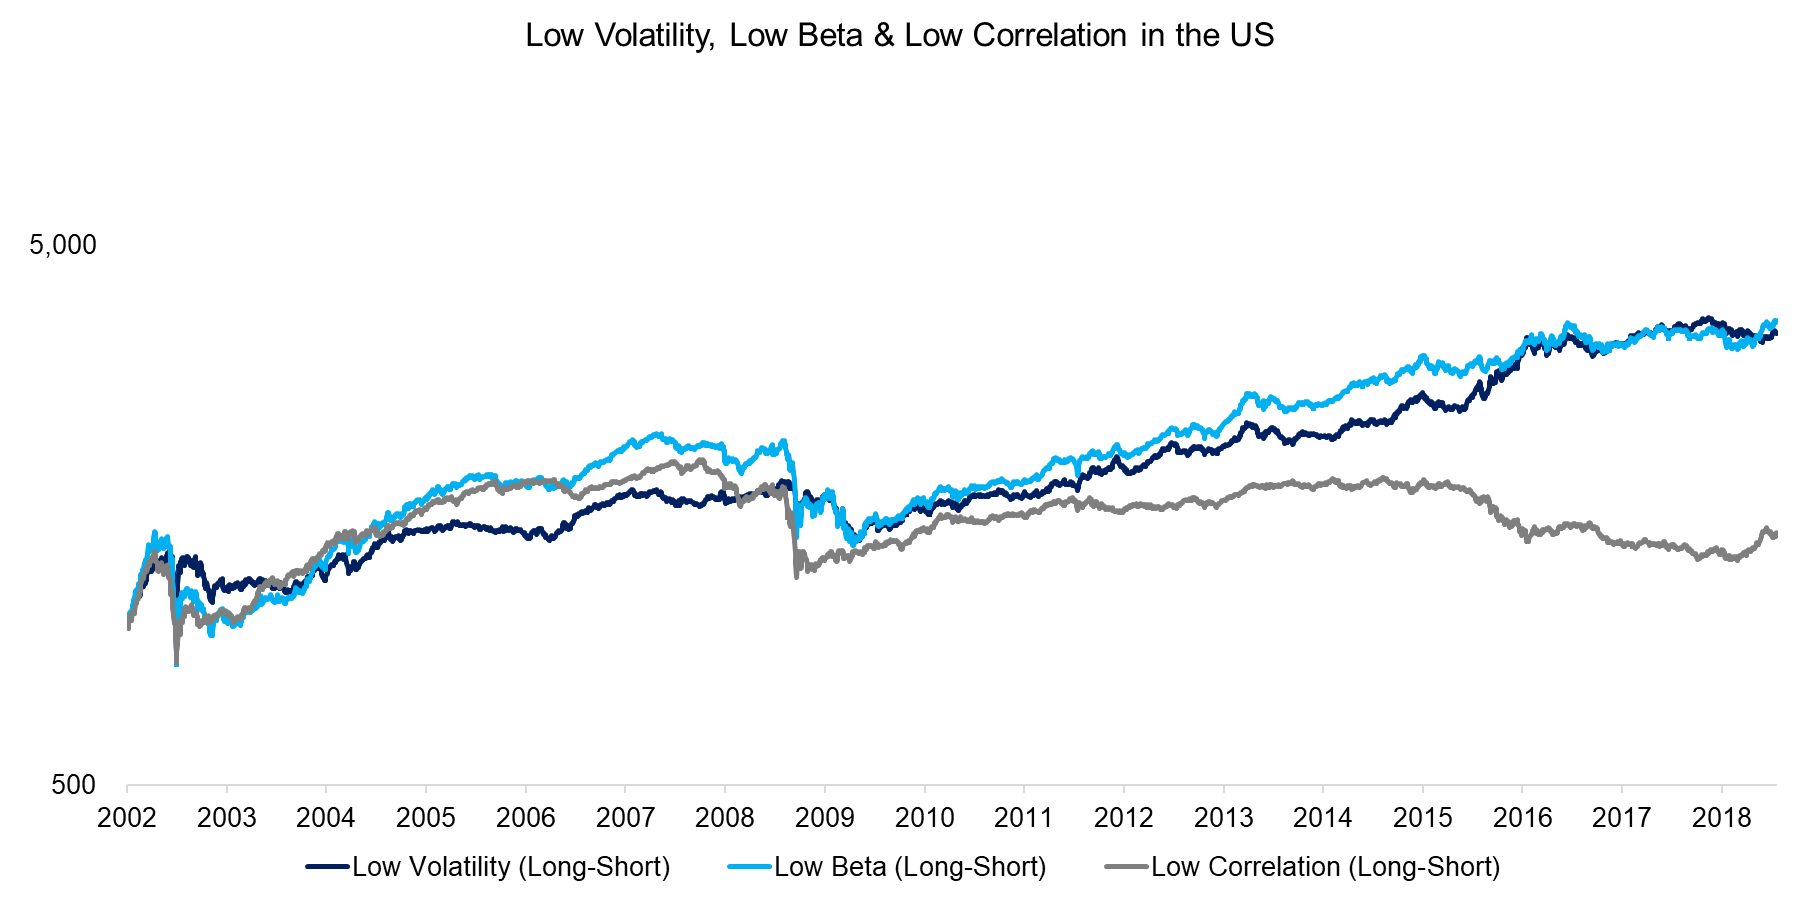
Given the negative net beta, the portfolios need to be beta-adjusted as stocks with lower risks only outperform stocks with higher risks on a risk-adjusted basis. The chart below highlights the beta-neutral performance, which shows attractive returns for the Low Volatility and Low Beta factor and lower returns for Low Correlation. It is worth noting that the three factors experience rare, but significant drawdowns, similar to the crashes of the Momentum factor, e.g. in 2002 and 2009. Investors should be aware that the low-risk factors exhibit higher average volatility than the Value, Quality or Size factors. The high factor volatility is partially a result of leverage, but this analysis highlights there are no positive excess returns without applying leverage to achieve beta-neutrality.
Source: FactorResearch
RISK-RETURN RATIOS OF THE LOW VOLATILITY, LOW BETA & LOW CORRELATION FACTORS
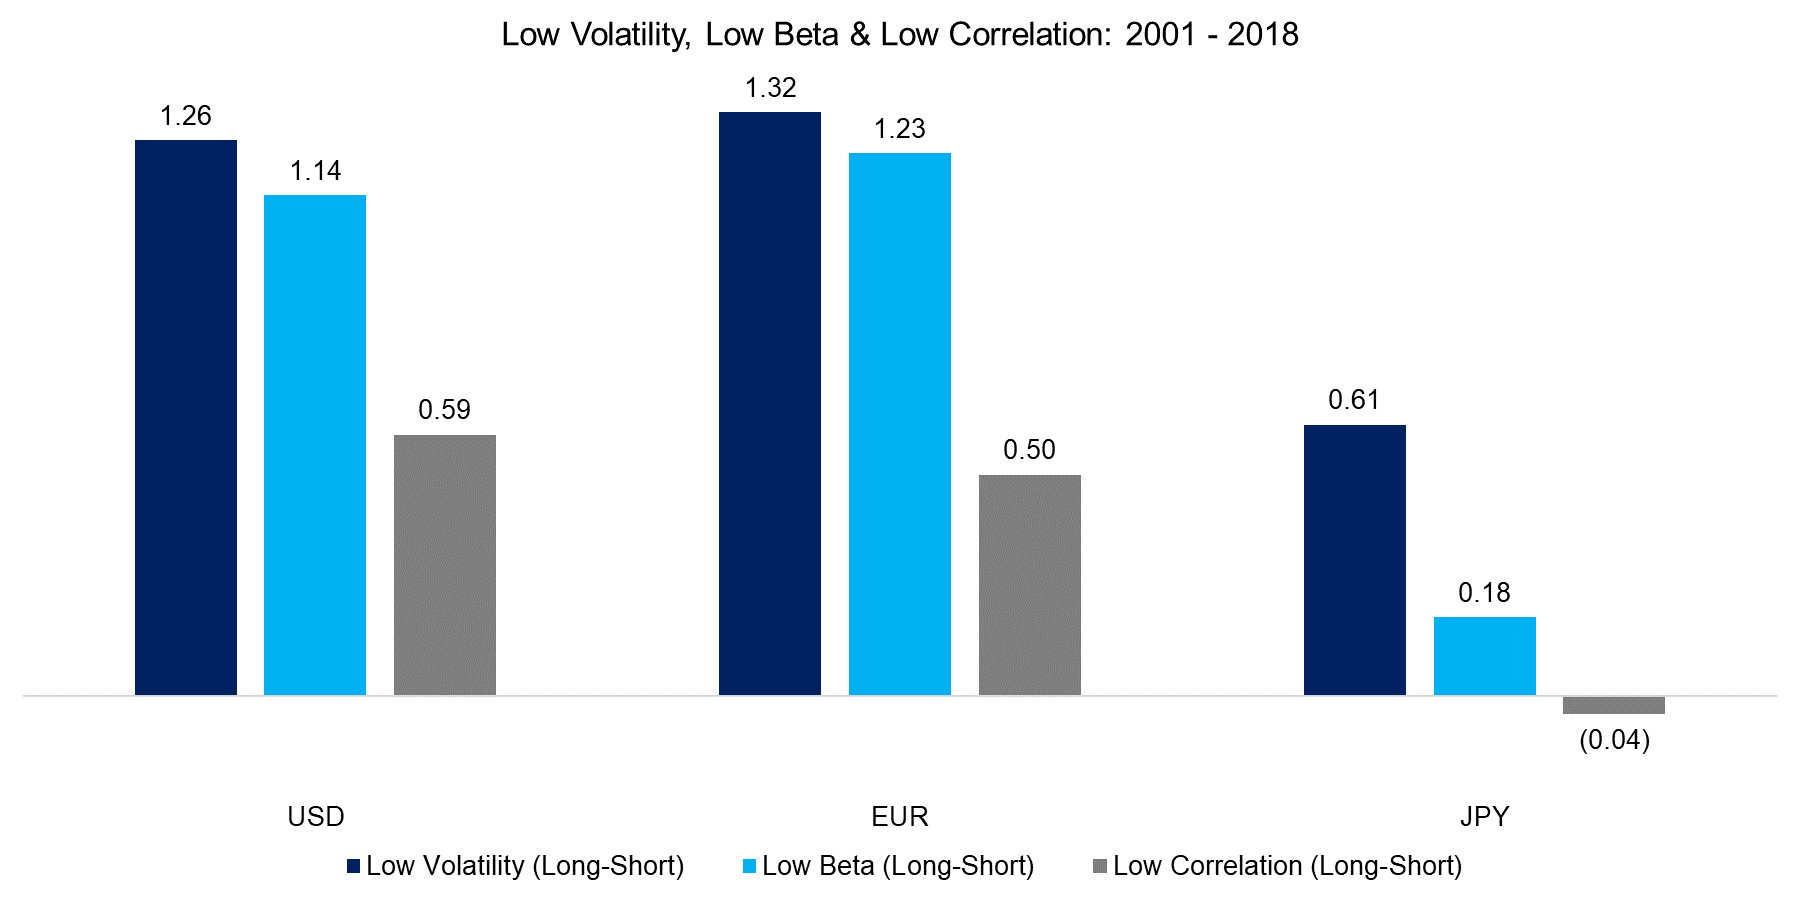
In addition to showing the performance, we can analyse the risk-return ratios and include European and Japanese stock markets. The analysis highlights attractive ratios in the US and Europe and slightly less attractive ratios in Japan. It is worth highlighting that the Low Volatility and Low Beta factors generated the highest risk-return ratios in the last two decades compared to other common equity factors.
Source: FactorResearch
INTEREST RATE-SENSITIVITY OF THE LOW VOLATILITY, LOW BETA & LOW CORRELATION FACTORS
The long portfolios of the three factors typically contain mature companies with stable cashflows like real estate, telecommunications and utility stocks, which tend to feature significant amounts of debt on their balance sheets. In contrast, the short portfolio is typically comprised of high growth stocks from the technology and biotech sectors, which have low to moderate amounts of debt. Given this imbalance, the three factors frequently exhibit an interest rate-sensitivity as shown by the factor beta to the 10-year US treasury yield in the chart below. Investors concerned about the interest rate-sensitivity can reduce the risk by constructing the factor portfolios sector-neutral (please see our report Low Volatility Factor: Interest Rate-Sensitivity and Sector-Neutrality).
Source: FactorResearch
FURTHER THOUGHTS
The attractive risk-adjusted returns of the low-risk factors over the last two decades should be considered carefully given that they require beta-neutrality, which requires leverage, and are likely partially explained by interest rates. Although the factor drawdowns are rare, they are significant in magnitude, highlighting that low-risk factors can be quite risky.
ABOUT THE AUTHOR
Nicolas Rabener is the CEO & Founder of Finominal, which empowers professional investors with data, technology, and research insights to improve their investment outcomes. Previously he created Jackdaw Capital, an award-winning quantitative hedge fund. Before that Nicolas worked at GIC and Citigroup in London and New York. Nicolas holds a Master of Finance from HHL Leipzig Graduate School of Management, is a CAIA charter holder, and enjoys endurance sports (Ironman & 100km Ultramarathon).
Connect with me on LinkedIn or X.

