Factor Exposure Analysis 106: Macro Variables
Boosting the R2?
June 2022. Reading Time: 10 Minutes. Author: Nicolas Rabener.
SUMMARY
- Most investors treat factor and macro variables differently
- Including macro variables improves a factor exposure analysis
- Both should be considered simultaneously when analyzing investment portfolios
INTRODUCTION
The investment world is full of conundrums. For example, discussions on investment portfolios usually focus on the impact of change in inflation, interest rates, economic growth, and other macro variables. However, the most frequent type of portfolio analysis is a factor exposure analysis, where the exposure to equity factors like value or momentum is determined. Oddly, there are few follow on discussions on how value will perform and what the impact on the portfolio will be.
Factor exposure and macro scenario analysis are typically regarded as separate types of analysis, although these can be combined. It is straightforward to measure the exposure to equity factors as well as macroeconomic variables. Naturally, this is more relevant to cross-asset rather than pure equity portfolios (read Factor Exposure Analysis 102: More or Less Independent Variables?).
In this research article, we will explore adding macro variables to a factor exposure analysis of asset allocation portfolios.
SELECTION OF ASSET ALLOCATION STRATEGIES
We select 20 ETFs traded in the U.S. stock market that represent asset allocation strategies, which include tactical and less dynamic ones. This differentiation is not easy, but exactly where factor exposure can be helpful to quantify the magnitude of changes to asset classes. We create the following two groups, each consisting of 10 ETFs:
- Core Asset Allocation ETFs: iShares Core Growth Allocation ETF (AOR), iShares Core Moderate Allocation ETF (AOM), iShares Core Aggressive Allocation ETF (AOA), iShares Core Conservative Allocation ETF (AOK), SPDR SSgA Global Allocation ETF (GAL), ClearShares, OCIO ETF (OCIO), Invesco Balanced Multi-Asset Allocation ETF (PSMB), Invesco Growth Multi-Asset Allocation ETF (PSMG), Invesco CEF Income Composite ETF (PCEF), Multi-Asset Diversified Income Index Fund (MDIV)
- Tactical Asset Allocation ETFs: First Trust Dorsey Wright DALI 1 ETF (DALI), Premise Capital Diversified Tactical ETF (TCTL), Strategy Shares Newfound/ReSolve Robust Momentum ETF (ROMO), First Trust Dorsey Wright Dynamic Focus 5 ETF (FVC), Merlyn.AI Bull-Rider Bear-Fighter ETF (WIZ), Merlyn.AI SectorSurfer Momentum ETF (DUDE), Cambria Trinity ETF (TRTY), FormulaFolios Tactical Growth ETF (FFTG), Arrow DWA Tactical Macro ETF (DWAT), WBI BullBear Trend Switch US 3000 Total Return ETF (WBIT)
FACTOR EXPOSURE ANALYSIS TO STOCKS AND BONDS
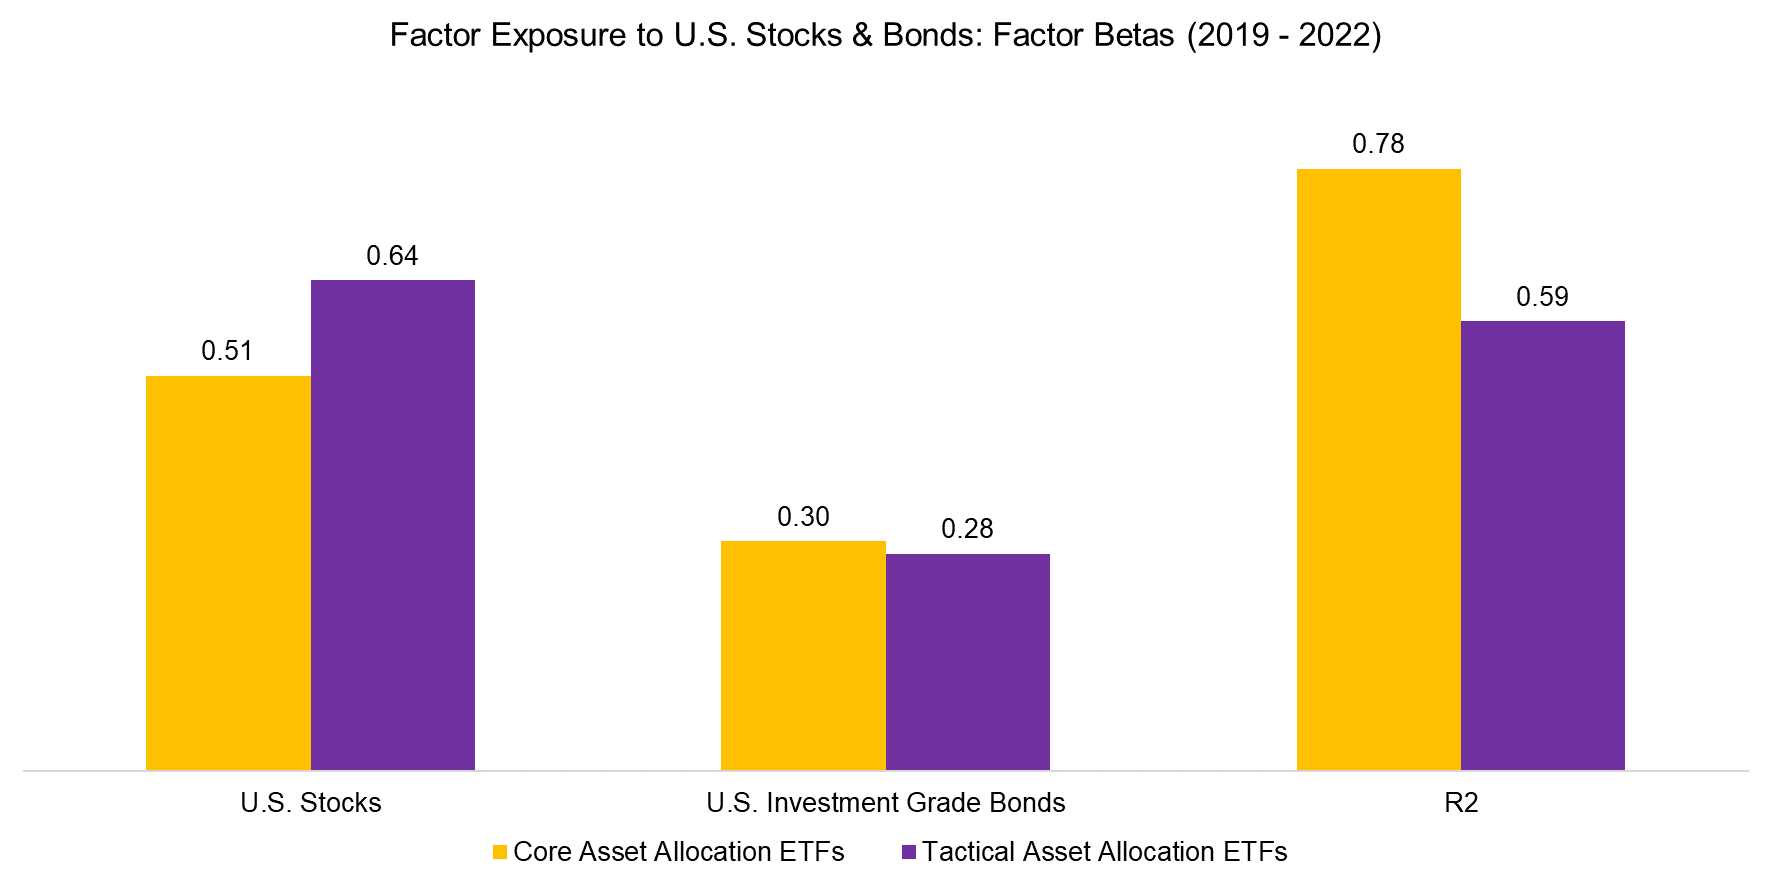
First, we run a simple regression analysis to measure the exposure of these ETFs to U.S. stocks and investment grade bonds. We use daily returns for the last three years and observe that both core and tactical asset allocation ETFs had higher factor betas to stocks than bonds. Furthermore, the R2 was higher for core than tactical asset allocation ETFs, which is intuitive as it is easier to measure static than dynamic exposures. Broadly speaking these portfolios provide the same exposure as a 60/40 equities/bond portfolio.

Source: FactorResearch
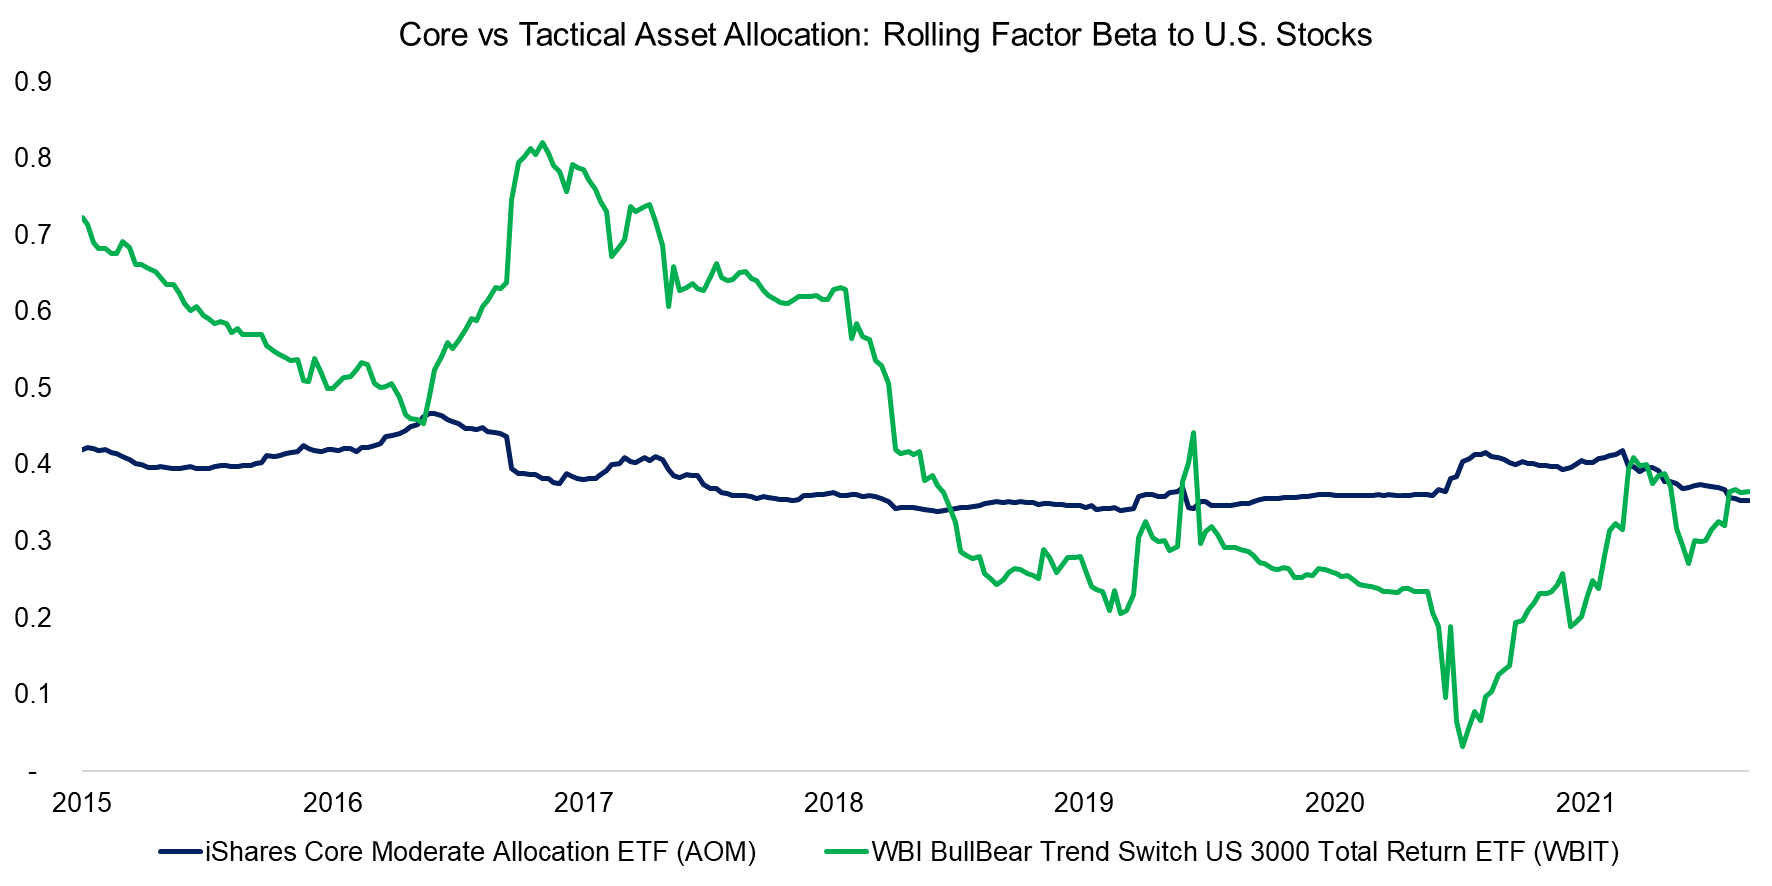
We can highlight the time-varying exposures by showcasing the stock market exposure of the iShares Core Moderate Allocation ETF (AOM) and WBI BullBear Trend Switch US 3000 Total Return ETF (WBIT). The former had an average beta of 0.4 to the S&P 500 which hardly changed in the period between 2015 and 2021. In contrast, the exposure of the latter changed dramatically across time as the ETF allocated 100% to bonds when stock market conditions were deemed unfavorable.
We also notice that the equity beta of WBIT declined over time, which can partially be explained by the ETF investing into very broad stock market indices rather than the S&P 500.

Source: FactorResearch
FACTOR EXPOSURE ANALYSIS TO ASSET CLASSES & MACRO VARIABLES
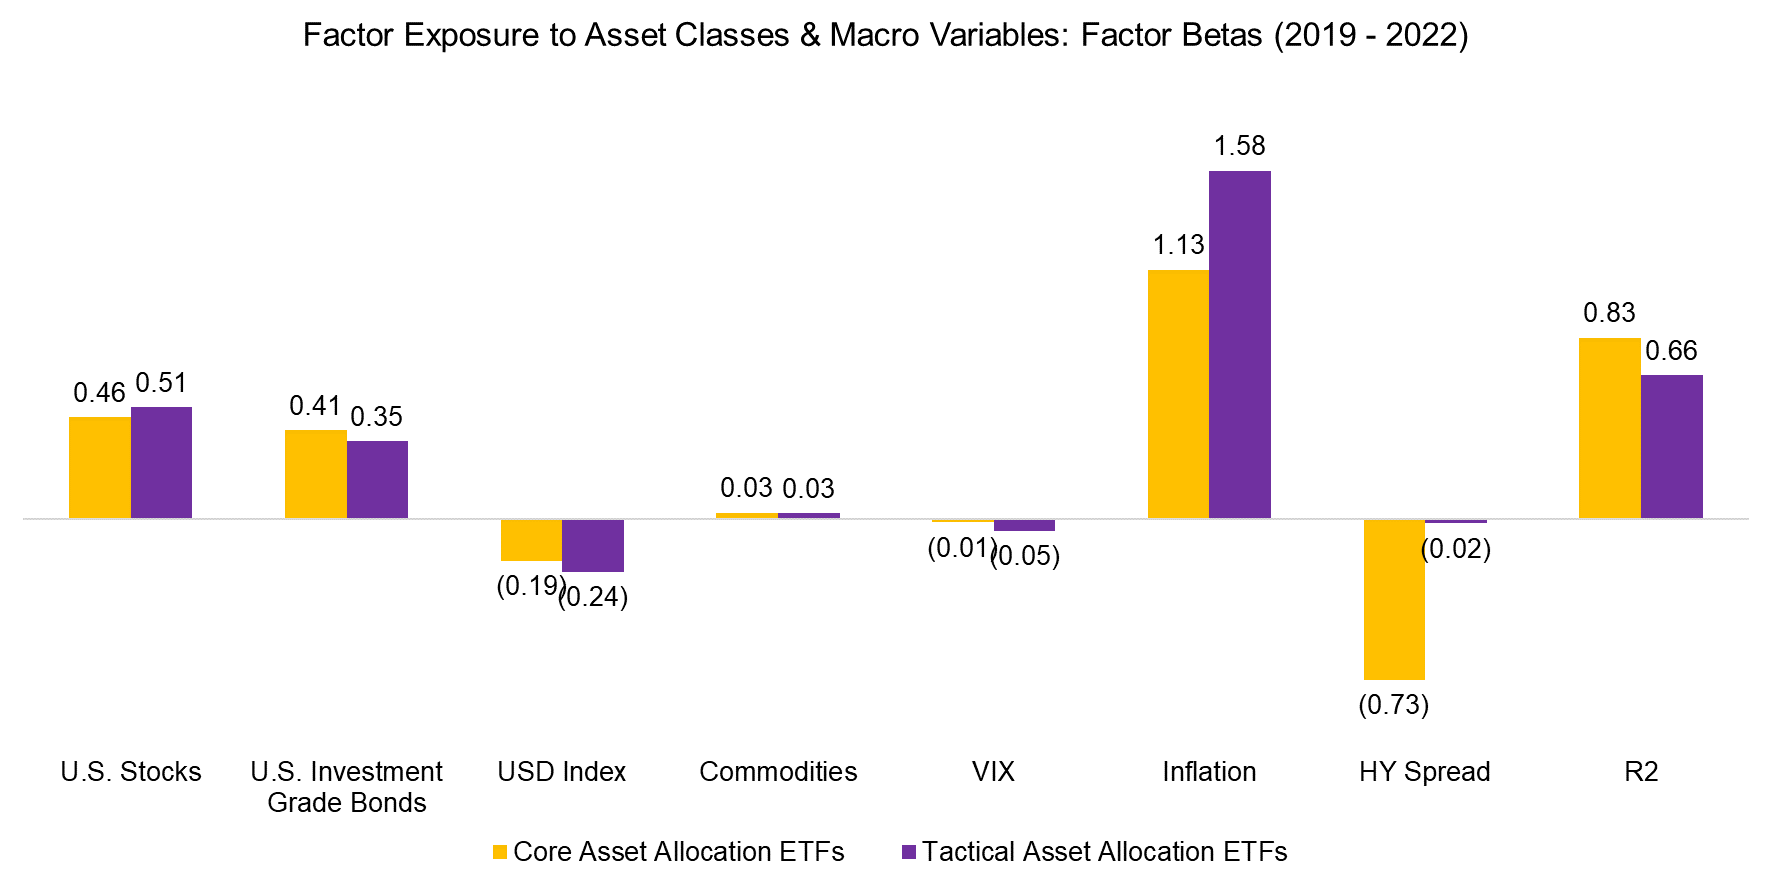
Next, we add five macro variables namely the USD index, commodities, VIX, inflation, and the high yield (HY) spread to the factor exposure analysis. Rerunning the analysis shows some macro variables had an impact on the returns of the ETFs. Specifically, core, as well as tactical asset allocation ETFs, had negative exposure to the USD, i.e. foreign currency exposure, and positive exposure to inflation. The key difference is that core asset allocation ETFs had negative exposure to the high yield spread, compared to zero for tactical ETFs.
It is somewhat confusing why bond-heavy portfolios have positive factor betas to inflation, or why tactical ETFs have negative exposure to the high yield spread, as investors might have expected inverse relationships. There is no ready explanation, but this is perhaps a function of the relatively short look-back of three years. It is also worth highlighting that some of these macro variables feature very low volatility, which results in high factor betas that are not always meaningful per se.

Source: FactorResearch
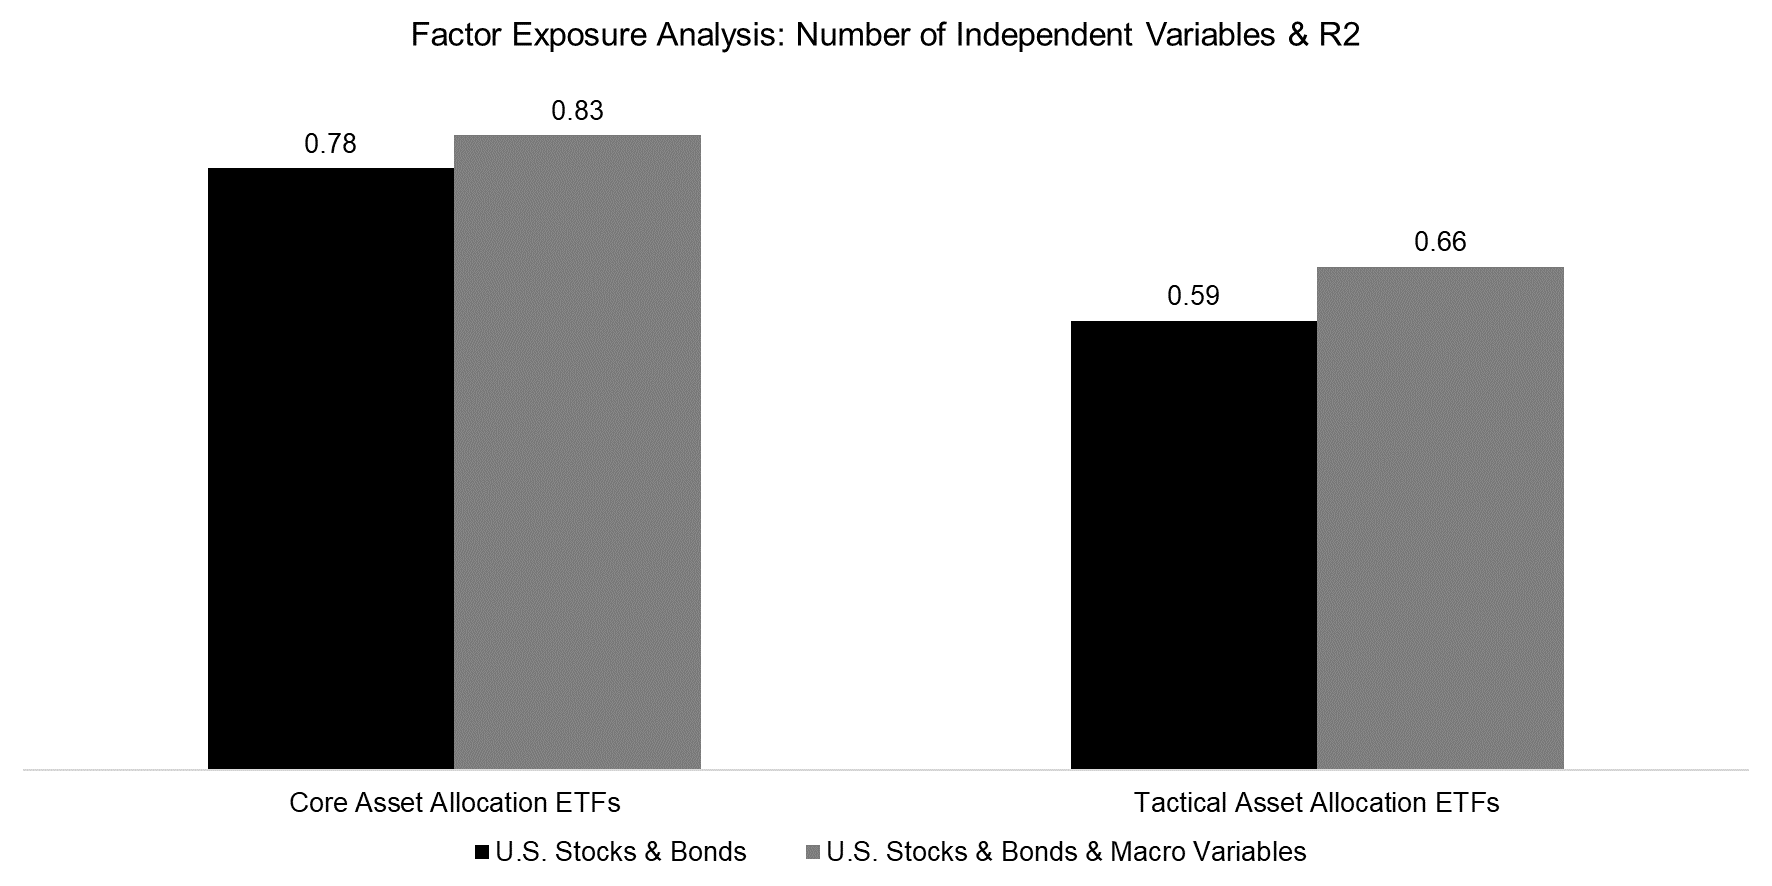
The average R2 increased for core and tactical asset allocation ETFs when macro variables were included. However, more variables is not always better when conducting a regression analysis as these are supposed to be independent.
For example, we use the USD index for foreign currency exposure, but many of the S&P 500 companies have exposure to international markets that provide them with foreign currency exposure, i.e. these two variables are not totally independent of each other. As a next step, we could consider using a more sophisticated Lasso regression analysis or residualizing some of the variables (read Factor Exposure Analysis 103: Exploring Residualization).

Source: FactorResearch
FURTHER THOUGHTS
Should investors distinguish between factors and macro variables?
Not really, especially given that these are related. For example, the value factor is primarily driven by risk sentiment, which can be measured via the VIX or high yield spread. Value tends to outperform when volatility and the high yield spread are declining. Quality behaves the inverse as investors are seeking high-quality stocks when the market risk increases.
Measuring these relationships is relatively easy, but understanding them is complicated as most of them are interlinked, and acting on the analysis is even more difficult. Knowing that a portfolio was impacted by inflation does not help with forecasting it.
RELATED RESEARCH
Time Machines for Investors
Factor Exposure Analysis 105: Sectors versus FactorsFactor Exposure Analysis 105: Sectors versus FactorsFactor Exposure Analysis 104: Fixed Income ETFsFactor Exposure Analysis 105: Sectors versus FactorsFactor Exposure Analysis 103: Exploring ResidualizationFactor Exposure Analysis 105: Sectors versus FactorsFactor Exposure Analysis 102: More or Less Independent Variables?Factor Exposure Analysis 105: Sectors versus FactorsFactor Exposure Analysis 101: Linear vs Lasso RegressionFactor Exposure Analysis 105: Sectors versus FactorsFactor Exposure Analysis 100: Holdings vs Regression-Based
ABOUT THE AUTHOR
Nicolas Rabener is the CEO & Founder of Finominal, which empowers professional investors with data, technology, and research insights to improve their investment outcomes. Previously he created Jackdaw Capital, an award-winning quantitative hedge fund. Before that Nicolas worked at GIC and Citigroup in London and New York. Nicolas holds a Master of Finance from HHL Leipzig Graduate School of Management, is a CAIA charter holder, and enjoys endurance sports (Ironman & 100km Ultramarathon).
Connect with me on LinkedIn or X.

