Market & Factor Volatility
Mirror, Mirror, on the Wall…
June 2017. Reading Time: 10 Minutes. Author: Nicolas Rabener.
SUMMARY
- Factor volatility mirrors market volatility
- Market volatility is higher than factor volatility
- Momentum has higher volatility than Value or Size
INTRODUCTION
The interest in factor investing is currently at an all-time high according to Google Trends, which is supported by an abundance of single or multi-factor products being issued, especially in the smart beta wrapper. While we are big believers in factor investing in general, it’s worth highlighting the risks associated with factor exposure. In this short research note we’re going to analyse factor volatility as a proxy for risk over time and compare it to equity market volatility.
METHODOLOGY
In order to get a meaningful snapshot of factor volatility we want to get the longest time series available and will therefore use Fama-French data, which is available from 1926 onward. It’s worth highlighting that this is a great free resource, however, the calculations are without transaction costs and include companies with very small market capitalizations that aren’t tradeable in reality. The long-short portfolios represent the bottom and top 30% of the stock universes.
US MARKET & FACTOR VOLATILITY (1926 – 2016)
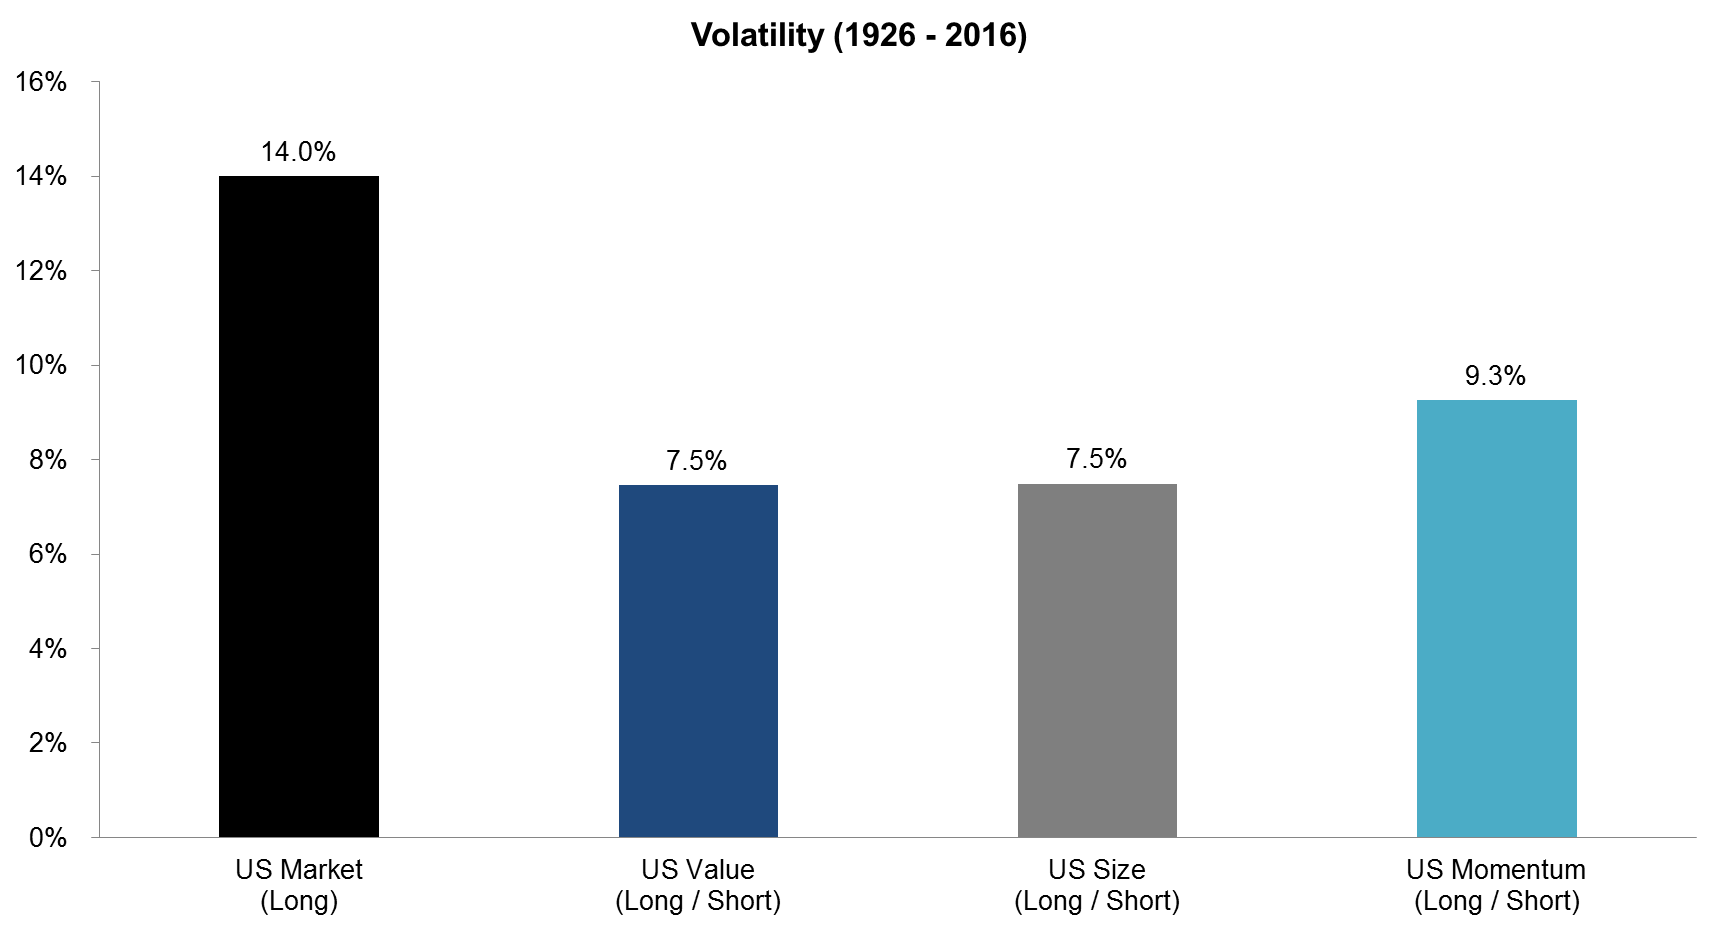
The chart below shows the volatility of the equity market (long) and the three most researched factors: Value, Size, and Momentum (long / short) (read Size Factor). We can observe that the market has the highest volatility and Momentum the highest amongst factors. If an investor has factor exposure via smart beta products or equity market neutral portfolios, then a simple equal weighting might not adequately reflect the different risk profiles of the factors. A risk-weighted approach might be more reasonable, but higher volatility does not necessarily imply higher risks for each factor linearly, which is one of the complexities of factor investing.
Source: Fama-French, FactorResearch calculations
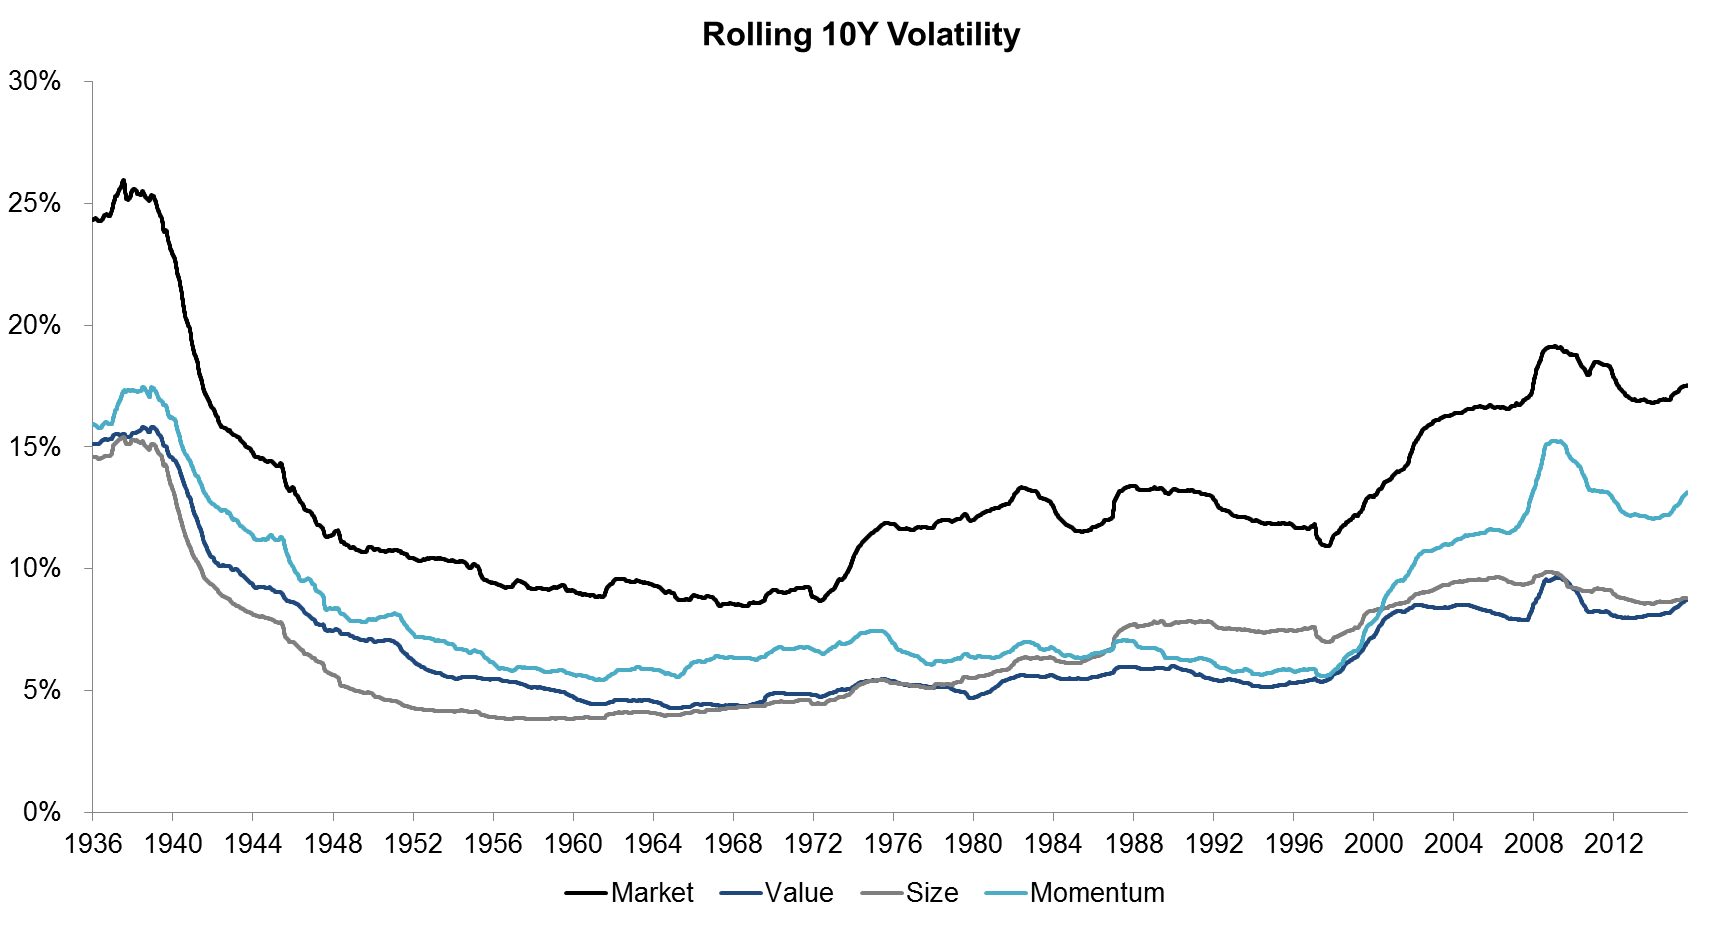
Given that these averages cover a period of 90 years, it’s interesting to look at volatility over time, which is shown in the chart below. We can observe that the market and the three factors had exceptionally high volatility in the beginning of the analysis, which includes the Great Depression and one of the worst bear markets ever. Thereafter volatility dropped significantly until the Global Financial Crisis, but only Momentum reached levels close to the early years. Momentum experienced two meaningful crashes, one in 1932 and one in 2009, where the factor had drawdowns larger than 75%.
Source: Fama-French, FactorResearch calculations
GLOBAL MARKET & FACTOR VOLATILITY (1990 – 2016)
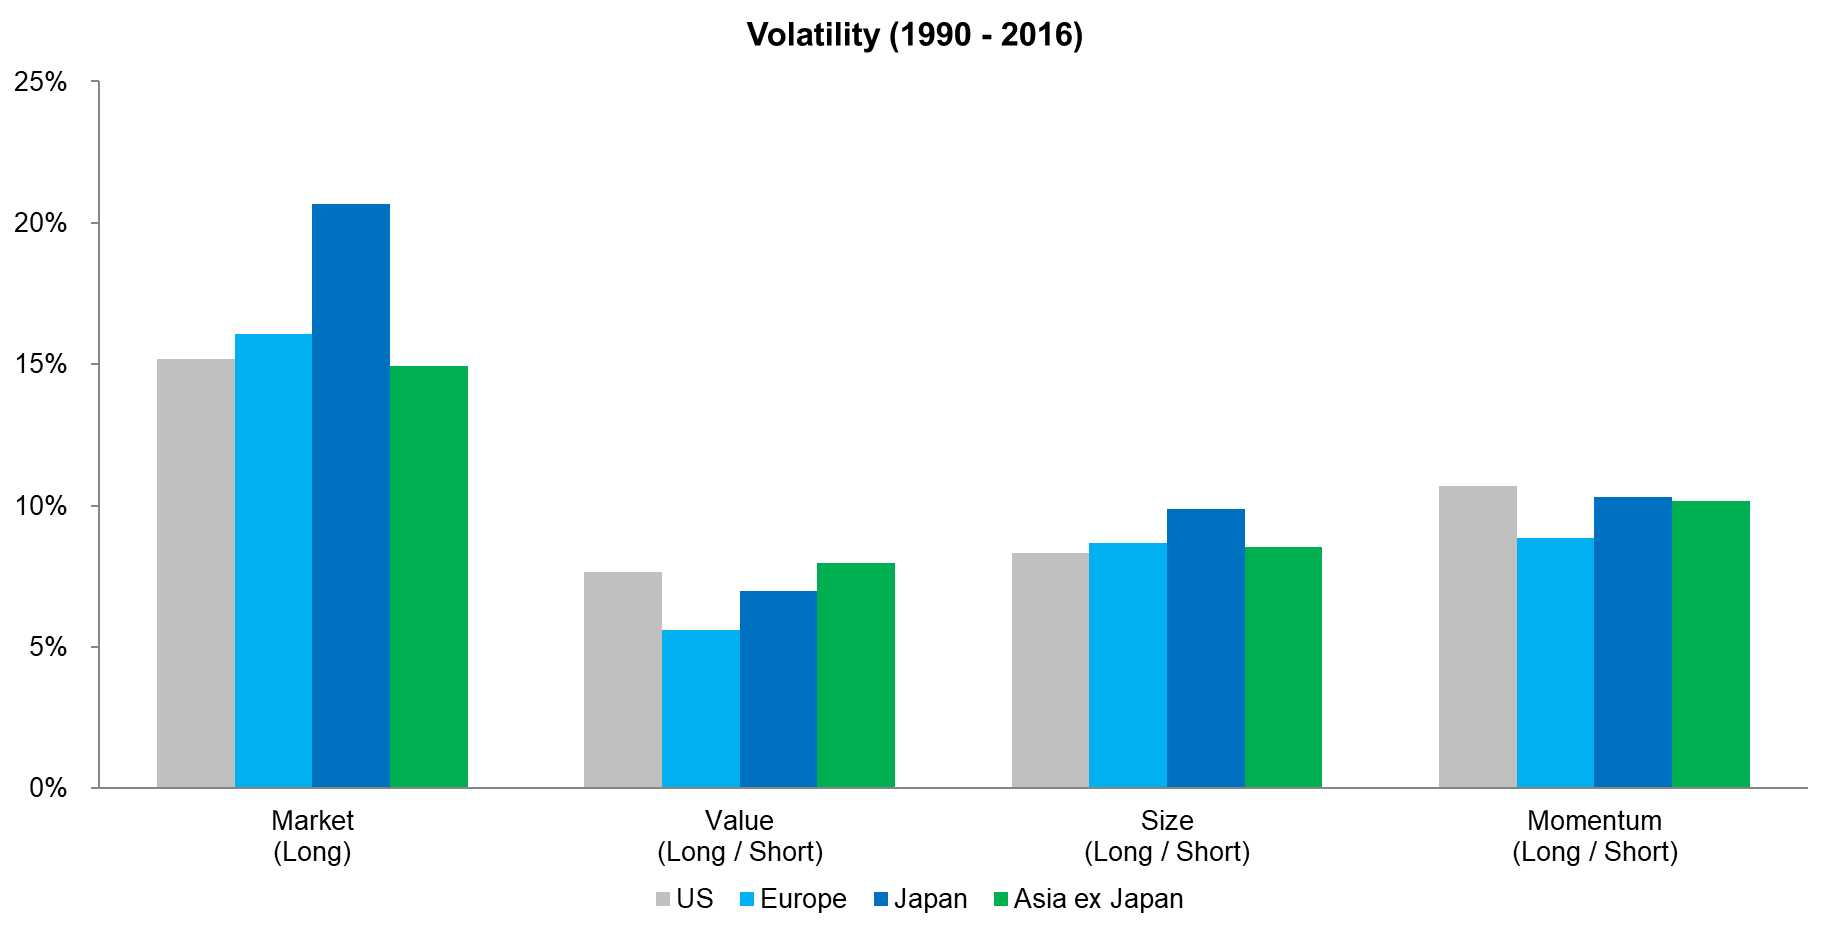
We can extend the analysis to include other regions where Fama-French data is available from 1990 onward. The chart below shows that the volatility profiles are comparable across regions with market volatility consistently being highest, Momentum taking second place, Size third, and Value being least volatile (read Value US Sectoral Analysis) .
Source: Fama-French, FactorResearch calculations
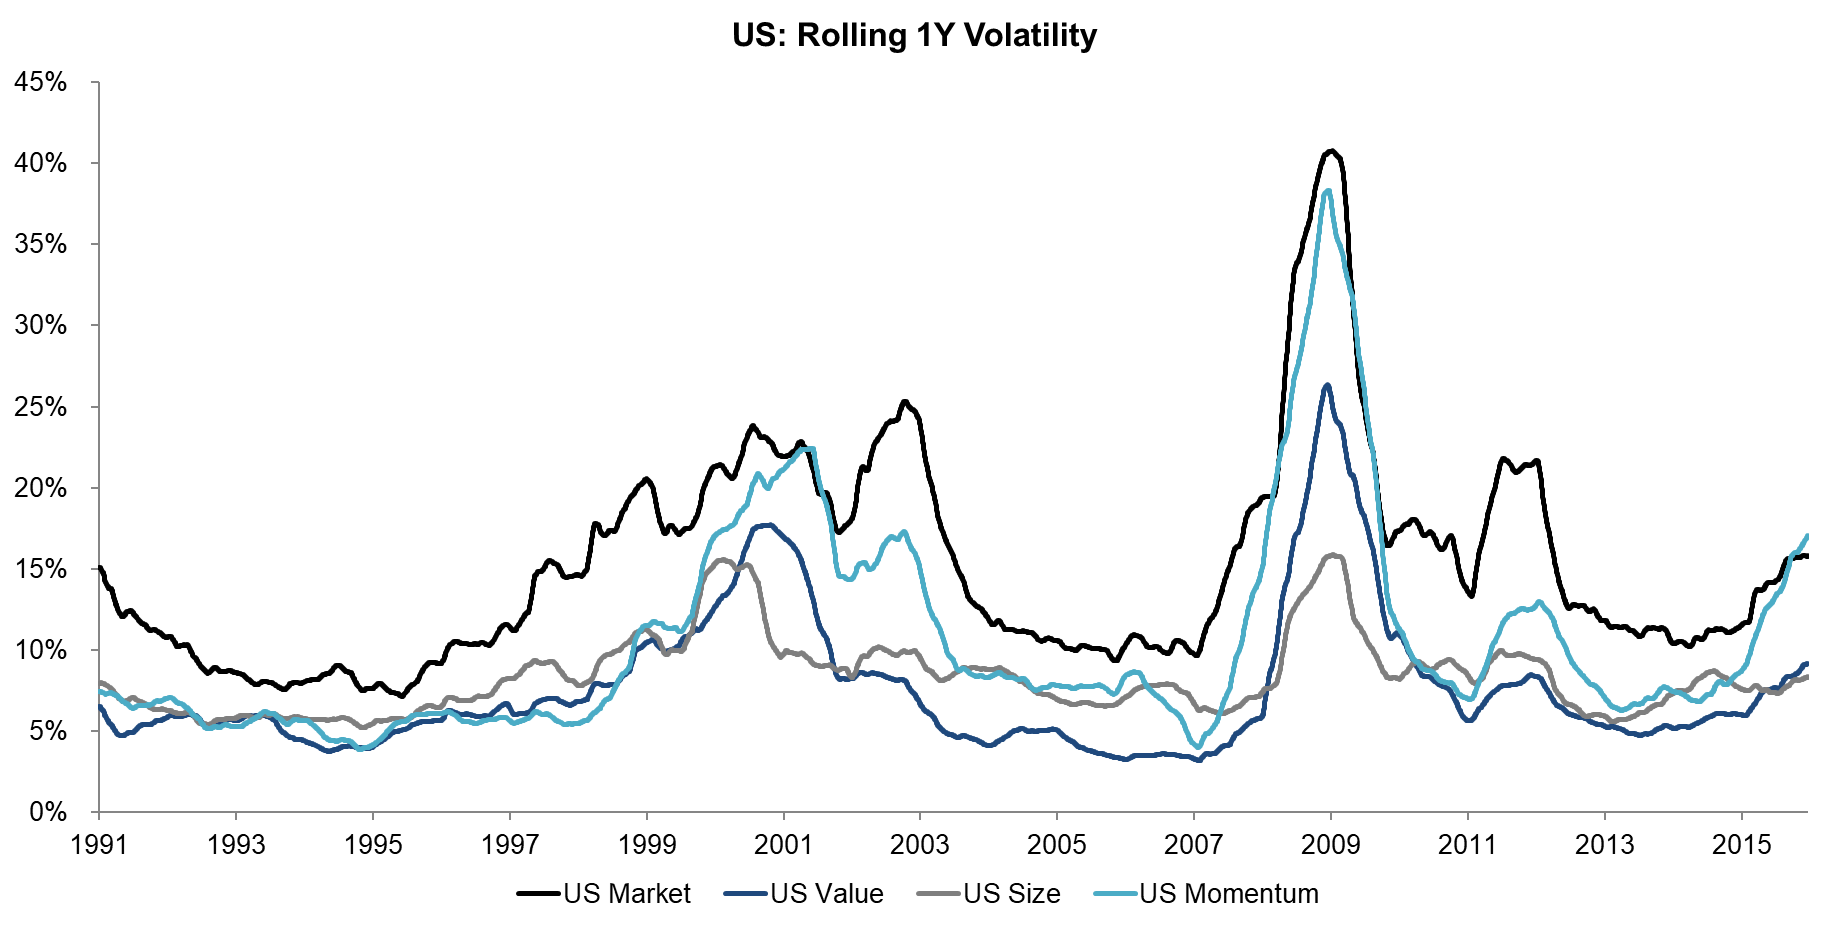
Looking at how volatility changed over time it’s interesting to see how factor volatility mirrors market volatility, which is intuitive. All regions reflect the two significant bear markets of the last 25 years, i.e. the Tech bubble implosion in 2000 and global financial crisis in 2008 – 2009, where volatility was high. We can also see the Asian financial crises of 1998 in the volatility profiles of Japan and Asia ex-Japan. It also seems that Japan has structurally higher market volatility.
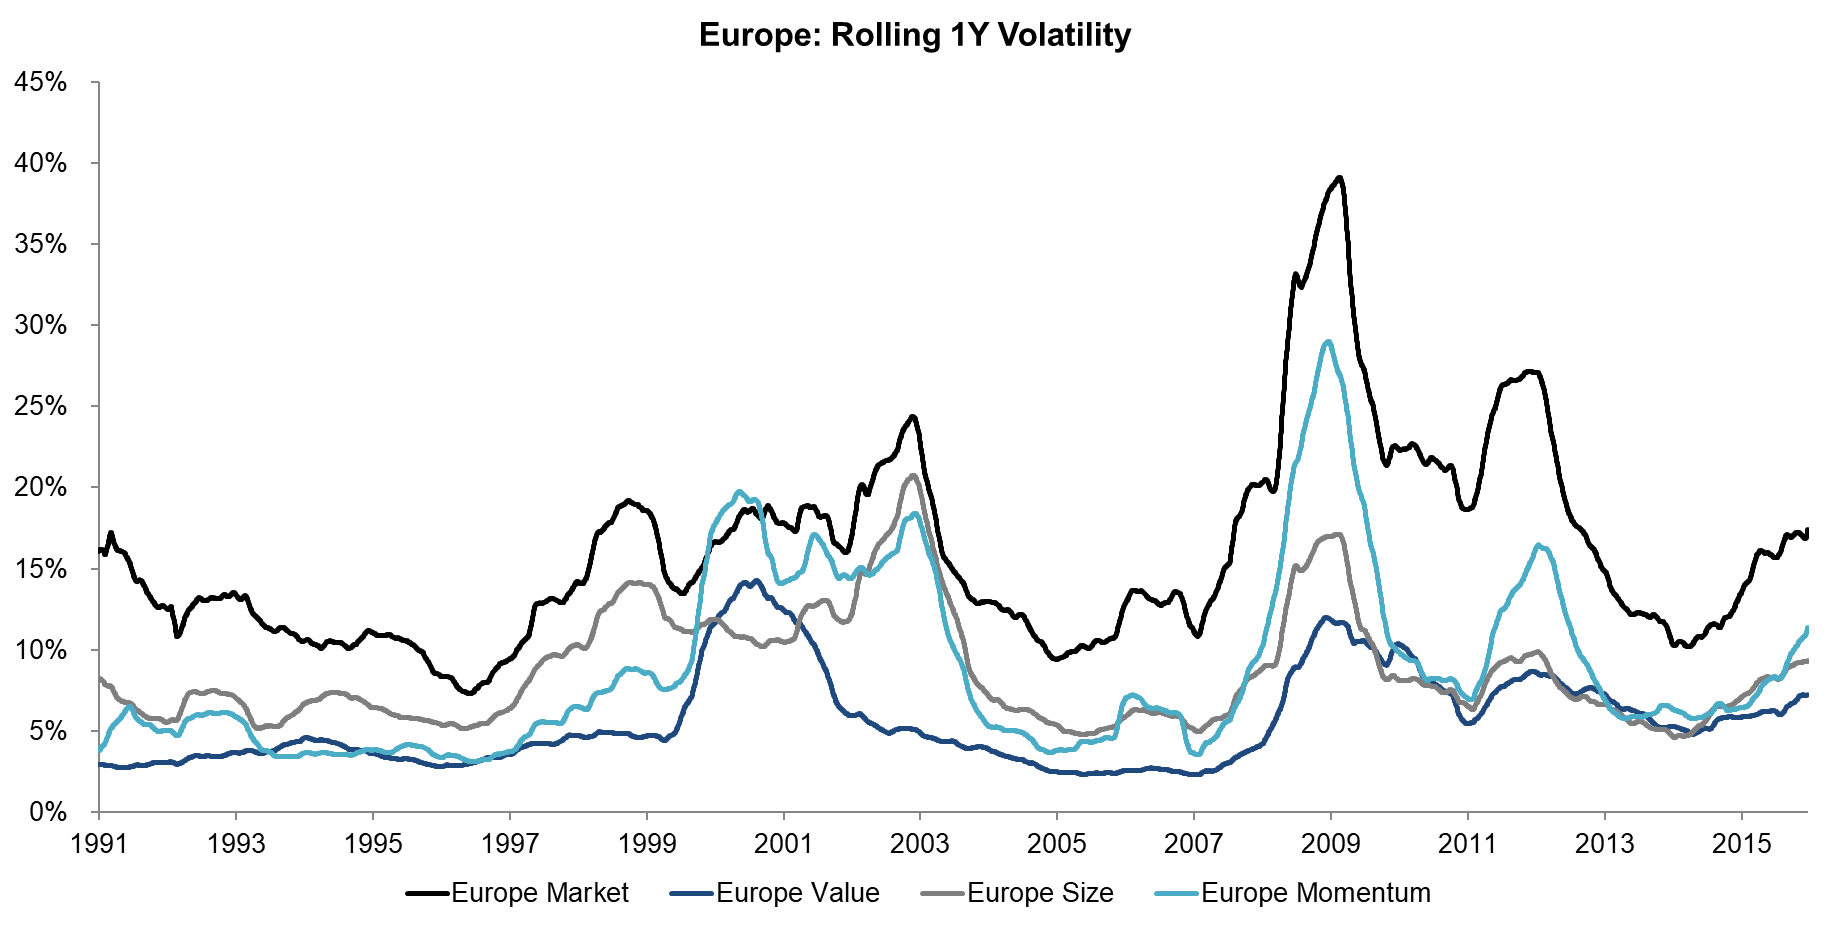
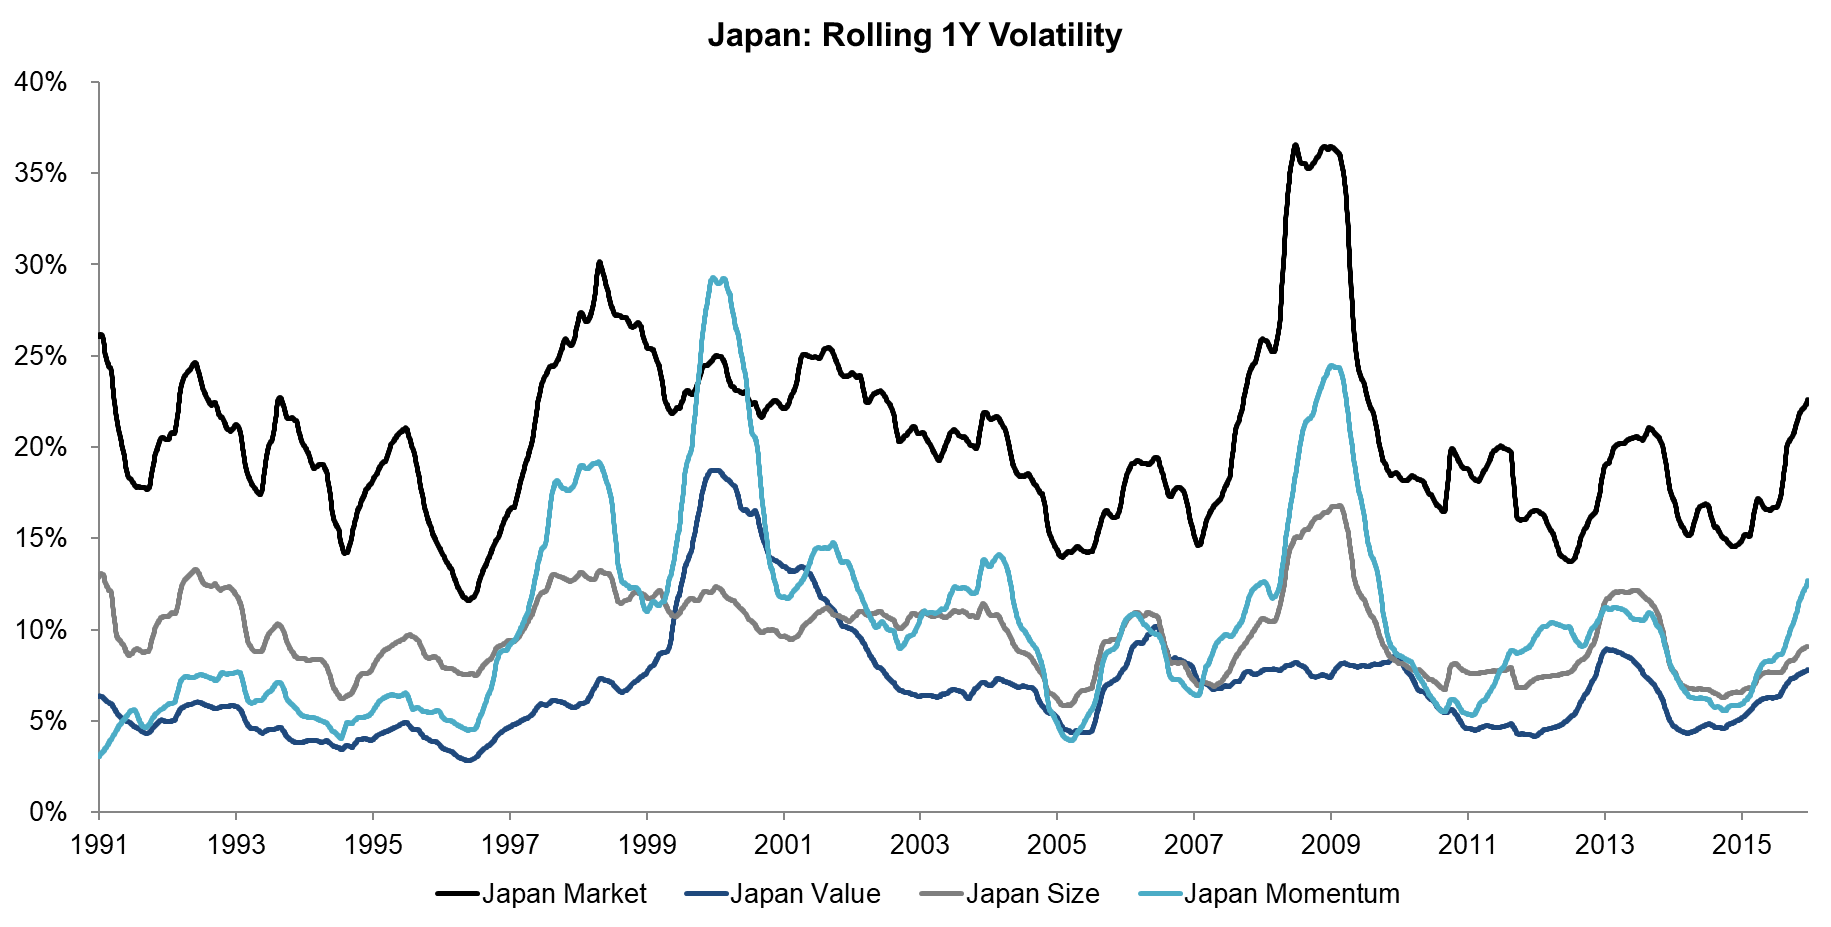
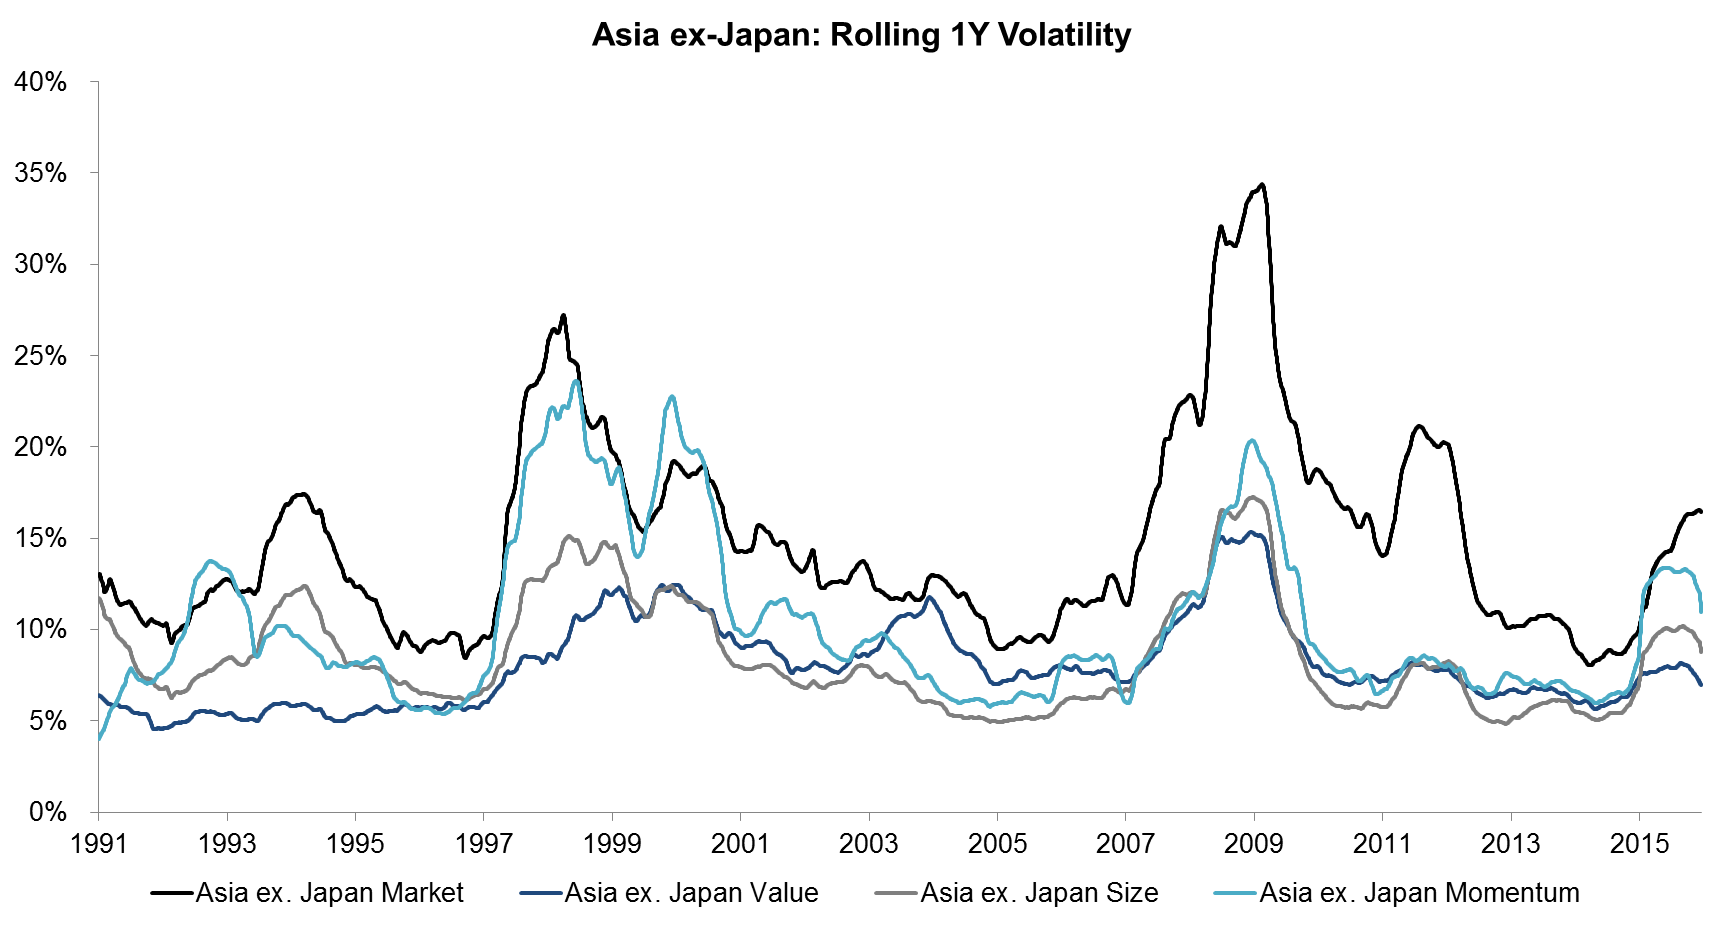
Source: Fama-French, FactorResearch calculations
ADDITIONAL STATISTICS
We can also analyse the return distributions of the market and factors, i.e. how symmetrical positive and negative returns are distributed over time. The chart below shows that the market has no significant skew, Value a positive one, and Size and Momentum negative skew for the period from 1990 to 2016. The positive skew of Value describes that frequent small losses and a few extreme gains are more common while the negative skew of Size and Momentum highlights frequent small gains and a few extreme losses.
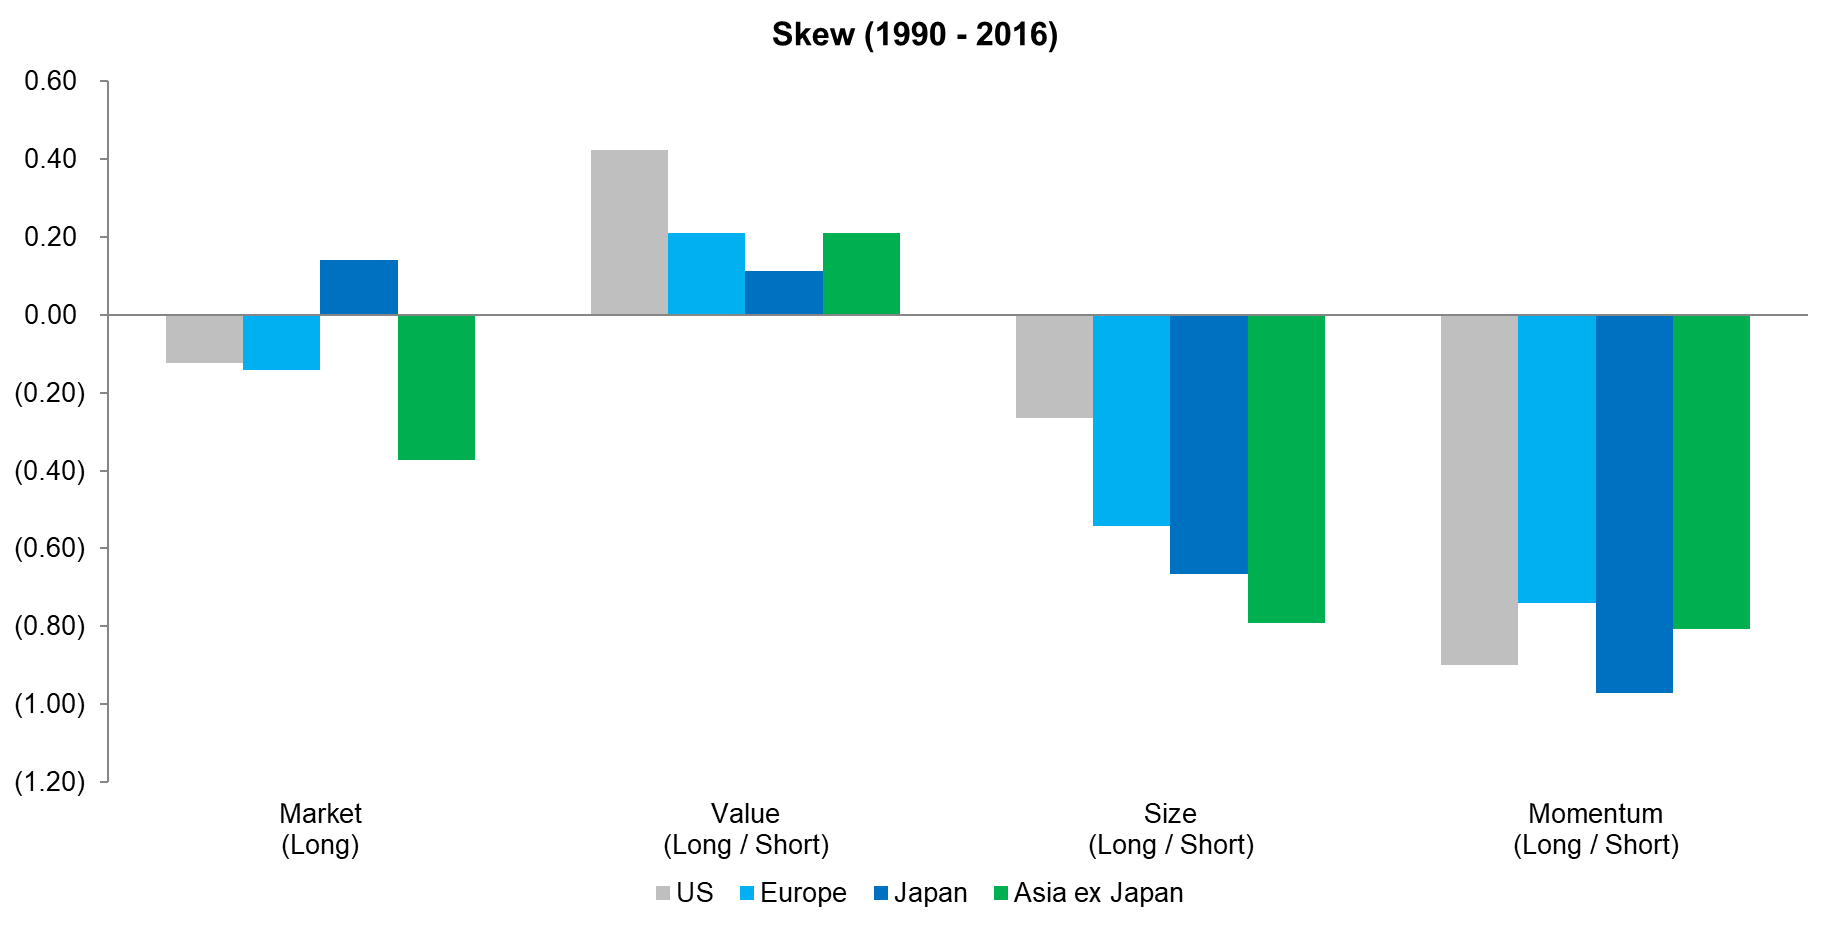
Source: Fama-French, FactorResearch calculations
Value is likely the most appealing strategy to investors as buying something at a discount is intuitively attractive, however, we would argue that most investors have difficulty dealing with positive skew as it’s against human nature to accept long streaks of losses and will therefore prefer investments with negative skew, despite occasional severe drawdowns.
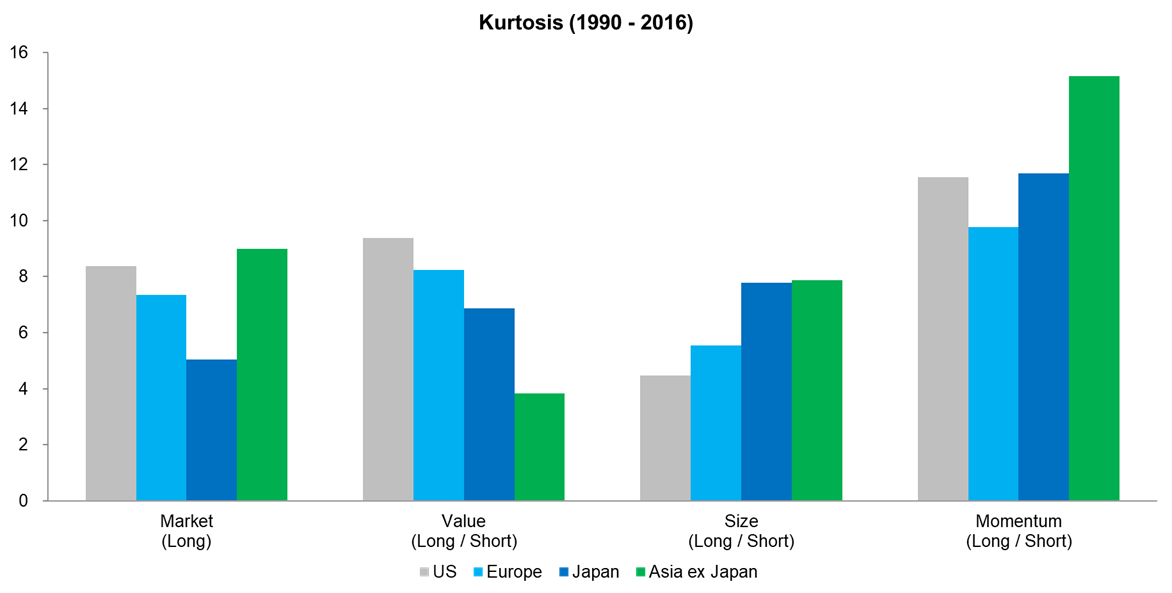
As a final piece of the analysis we can calculate the kurtosis, which simply said indicates if extreme gains or losses occur more often than expected. In the chart below we can observe that the market and factors all have kurtosis larger than 3 (normal distribution), which highlights that extreme returns are more common than anticipated. Momentum shows the highest levels of kurtosis across regions, which reflect the rare, but severe factor crashes.
Source: Fama-French, FactorResearch calculations
FURTHER THOUGHTS
Taking volatility as proxy for risk can easily be challenged or should at least be extended by including drawdowns in the analysis, which are quite different for each of the factors, some slow and steady while others are hard and fast, reflecting the skew and kurtosis. We’ll explore this in a subsequent research note.
ABOUT THE AUTHOR
Nicolas Rabener is the CEO & Founder of Finominal, which empowers professional investors with data, technology, and research insights to improve their investment outcomes. Previously he created Jackdaw Capital, an award-winning quantitative hedge fund. Before that Nicolas worked at GIC and Citigroup in London and New York. Nicolas holds a Master of Finance from HHL Leipzig Graduate School of Management, is a CAIA charter holder, and enjoys endurance sports (Ironman & 100km Ultramarathon).
Connect with me on LinkedIn or X.

