Market Timing via the VRP?
Stock Market Returns and the Variance Risk Premium
January 2021. Reading Time: 10 Minutes. Author: Nicolas Rabener.
SUMMARY
- Stock market returns were highly positive when the variance risk premium (VRP) was negative
- Returns were slightly negative across markets when the VRP was positive
- This relationship can not be exploited for market timing
INTRODUCTION
The US stock market in 1999 and 2020 had probably more similarities than differences. In both years the market was up considerably, retail investors were highly active, and technology companies were the most sought-after stocks. Euphoria was high and valuations seemed rather trivial for the stocks featuring attractive growth prospects.
A more nuanced similarity was that the market volatility was above average in both periods, which can be considered rather unusual. The VIX ended at 23% in 2020, which is greater than the long-term average of approximately 19%. Typically rising stock markets are associated with declining volatility.
Perhaps this is a reflection of continuing concerns about the impact of COVID-19 crisis on the global economy. It might also be a sign of the significant inflow of retail investors participating in options markets, which is also seen in a large difference between implied and realized volatility, commonly called the variance risk premium (“VRP”). These investors are aggressively buying calls to generate even higher returns than with stocks as well as puts to hedge their gains. Either transaction increases the demand for options and implied volatility.
The VRP is currently elevated, similar to in 1999. So, should investors be concerned? After all, stocks, especially the beloved technology stocks, crashed severely post the turn of the century.
In this short research note, we will explore the relationship between stock market returns and the variance risk premium.
THE GROWTH IN ASSETS OF SMART BETA QUALITY ETFS
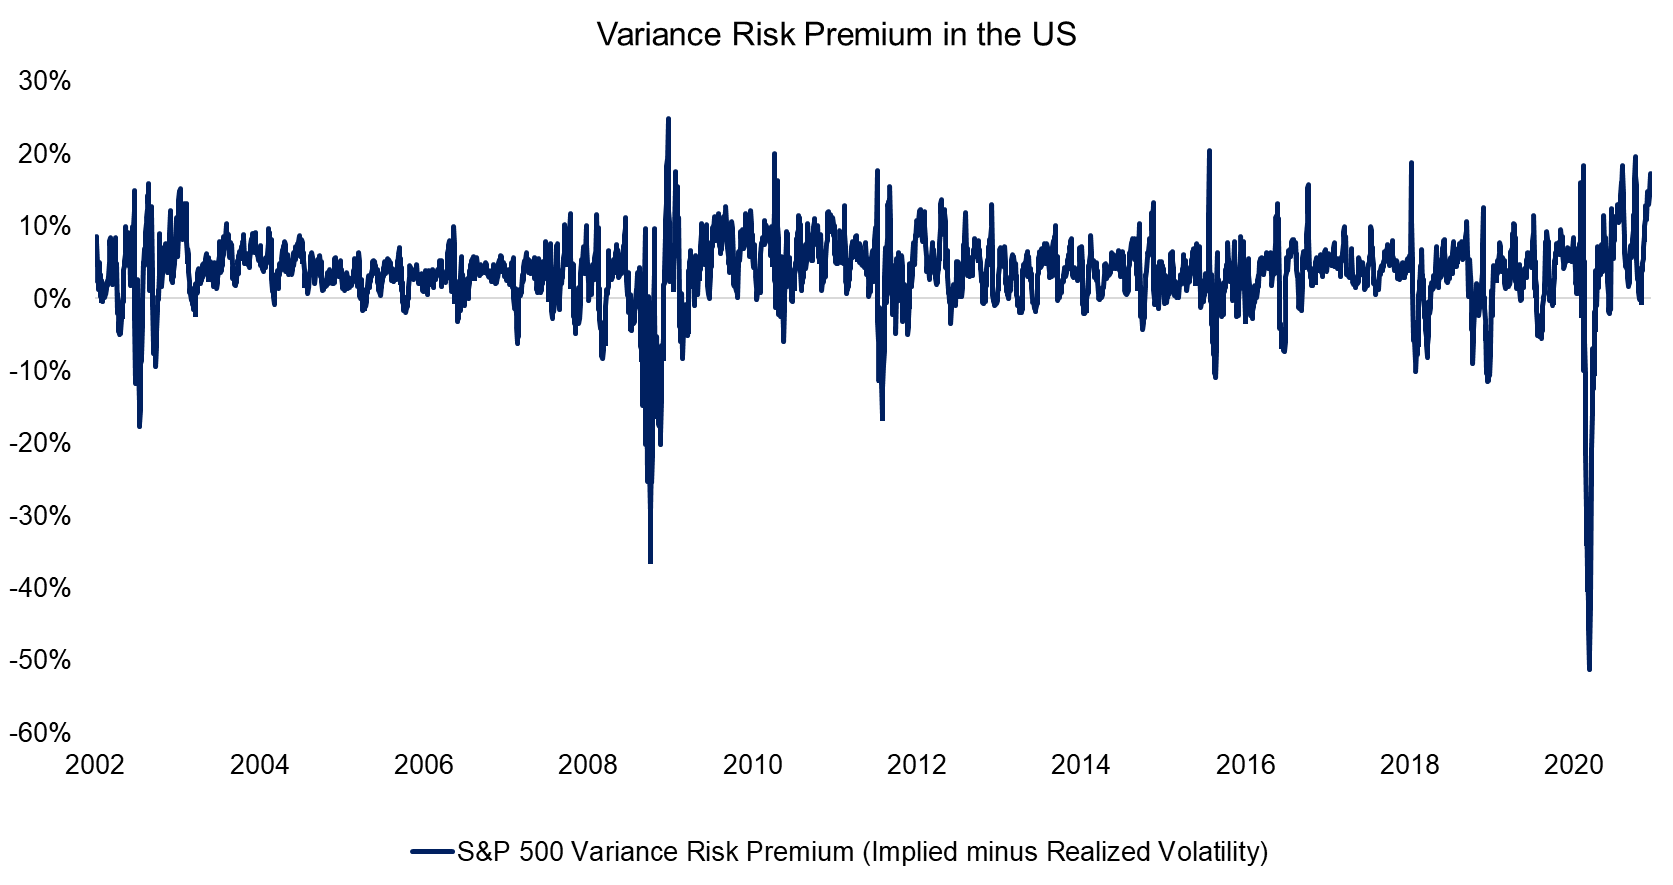
The variance risk premium has been approximately 3% in the US in the period from 2002 to 2020. Investors can buy the spread from investment banks and asset managers that offer variance risk premia products. The sales pitch is that the spread is mostly positive and the return stream uncorrelated to traditional asset classes, making this strategy attractive for diversification purposes. However, we provided contrary evidence to these claims in our research note The Variance Risk Premium: What Premium?, which might interest some readers.
We observe that the VRP only rarely became negative, which typically happened during stock market crashes and severe bear markets. Notable instances were in August 2002, at one of the low points of the bear market following the implosion of the technology bubble, in November 2008, a few weeks after the Lehman Brothers bankruptcy, and in April 2020, when investors realized the full extent of the COVID-19 crisis. At these points in time, realized volatility was higher than implied volatility.
Source: FactorResearch
VARIANCE RISK PREMIUM ACROSS STOCK MARKETS
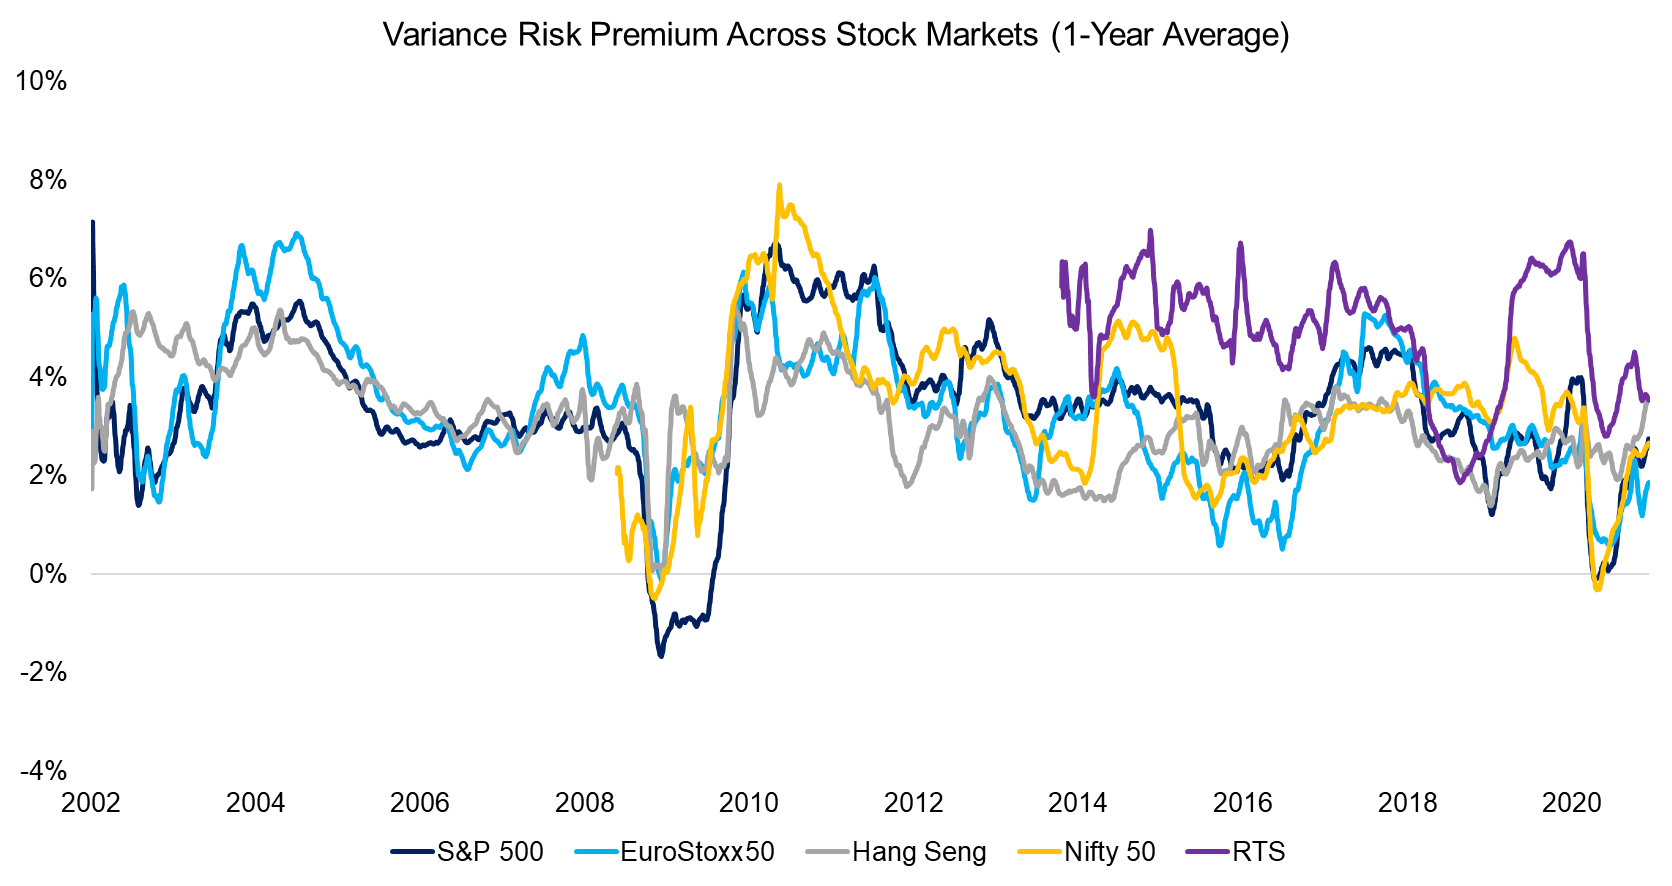
It is interesting to note that the trends in the variance risk premium were similar across stock markets. Even the magnitude, i.e. approximately 3%, was the same in India (Nifty 50) as in Europe (EuroStoxx50). Only Russia (RTS) featured a VRP that was structurally higher at almost 5%.
The similarities in the VRP are explained by stock markets trading in a synchronized fashion, which is perhaps surprising as these five economies do not necessarily suggest that. Countries like Russia and India seem to be marching to their own tune, but investor behaviour is the same everywhere.
Source: FactorResearch
STOCK MARKET RETURNS AND THE VARIANCE RISK PREMIUM
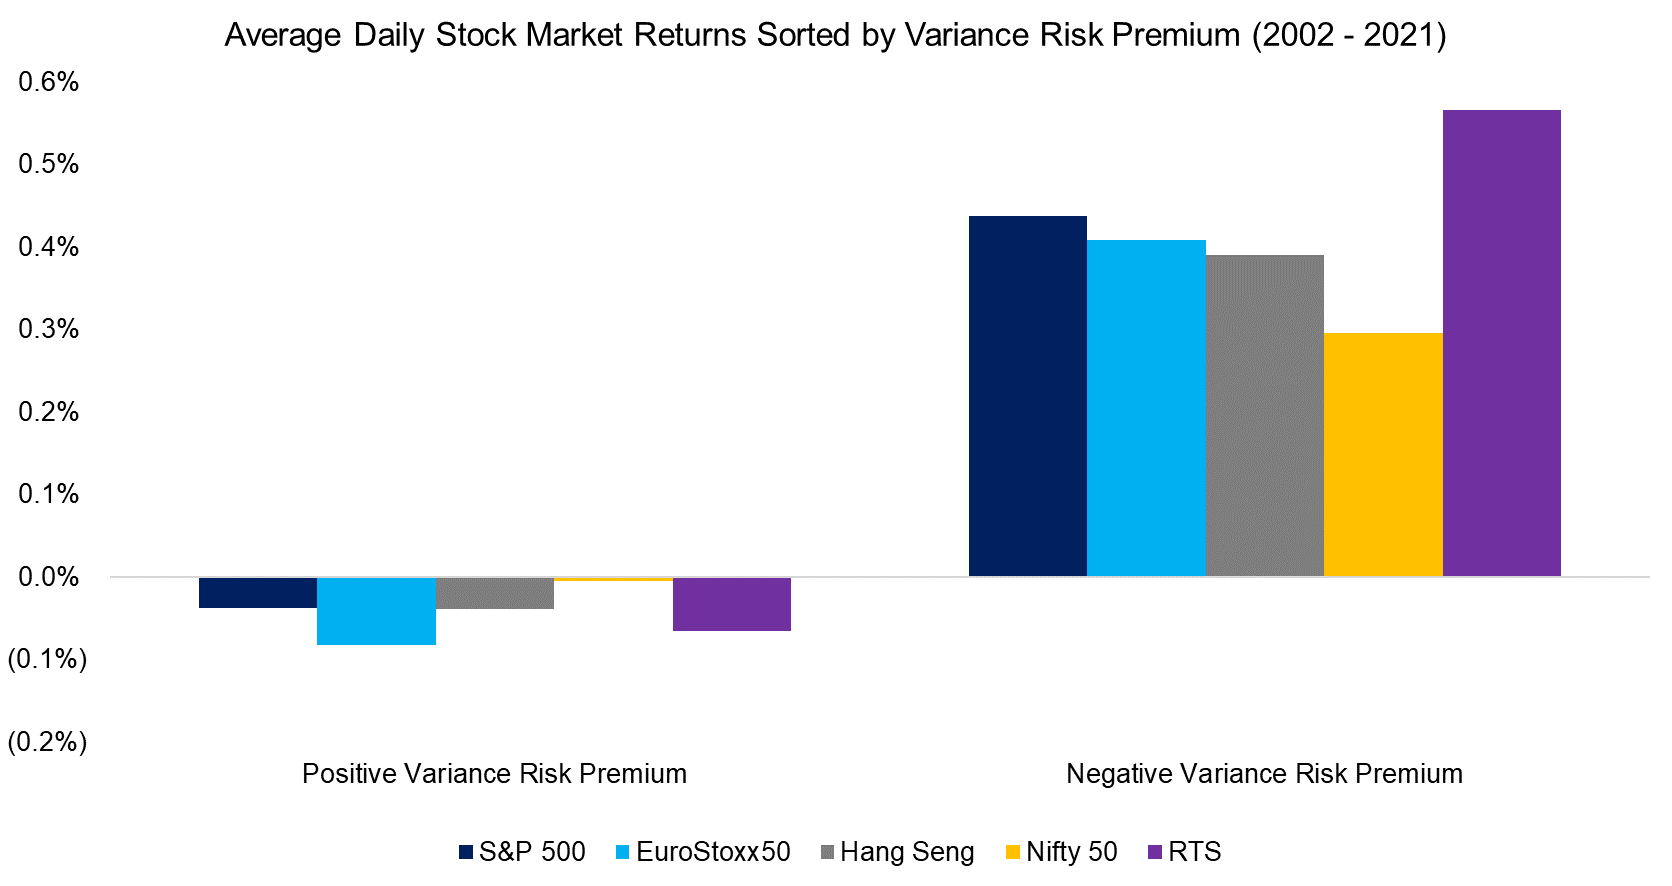
Next, we analyze the relationship between stock market returns and the variance risk premium. We sort the daily returns of five stock markets by the variance risk premium being positive or negative and calculate the average daily returns.
This simple analysis shows that when the variance premium was negative, i.e. when realized volatility was higher than implied volatility, then stock returns were high on average. In contrast, when the VRP was positive, then returns were slightly negative. This relationship was consistent across stock markets.
The VRP is negative only about 15% of the time, which implies that the total return of an index like the S&P 500 is attributed to a minority of the trading days. We also know that the returns are derived from only a few stocks, e.g. the FAANMG stocks in the US in recent years, but that is a different topic.
Source: FactorResearch
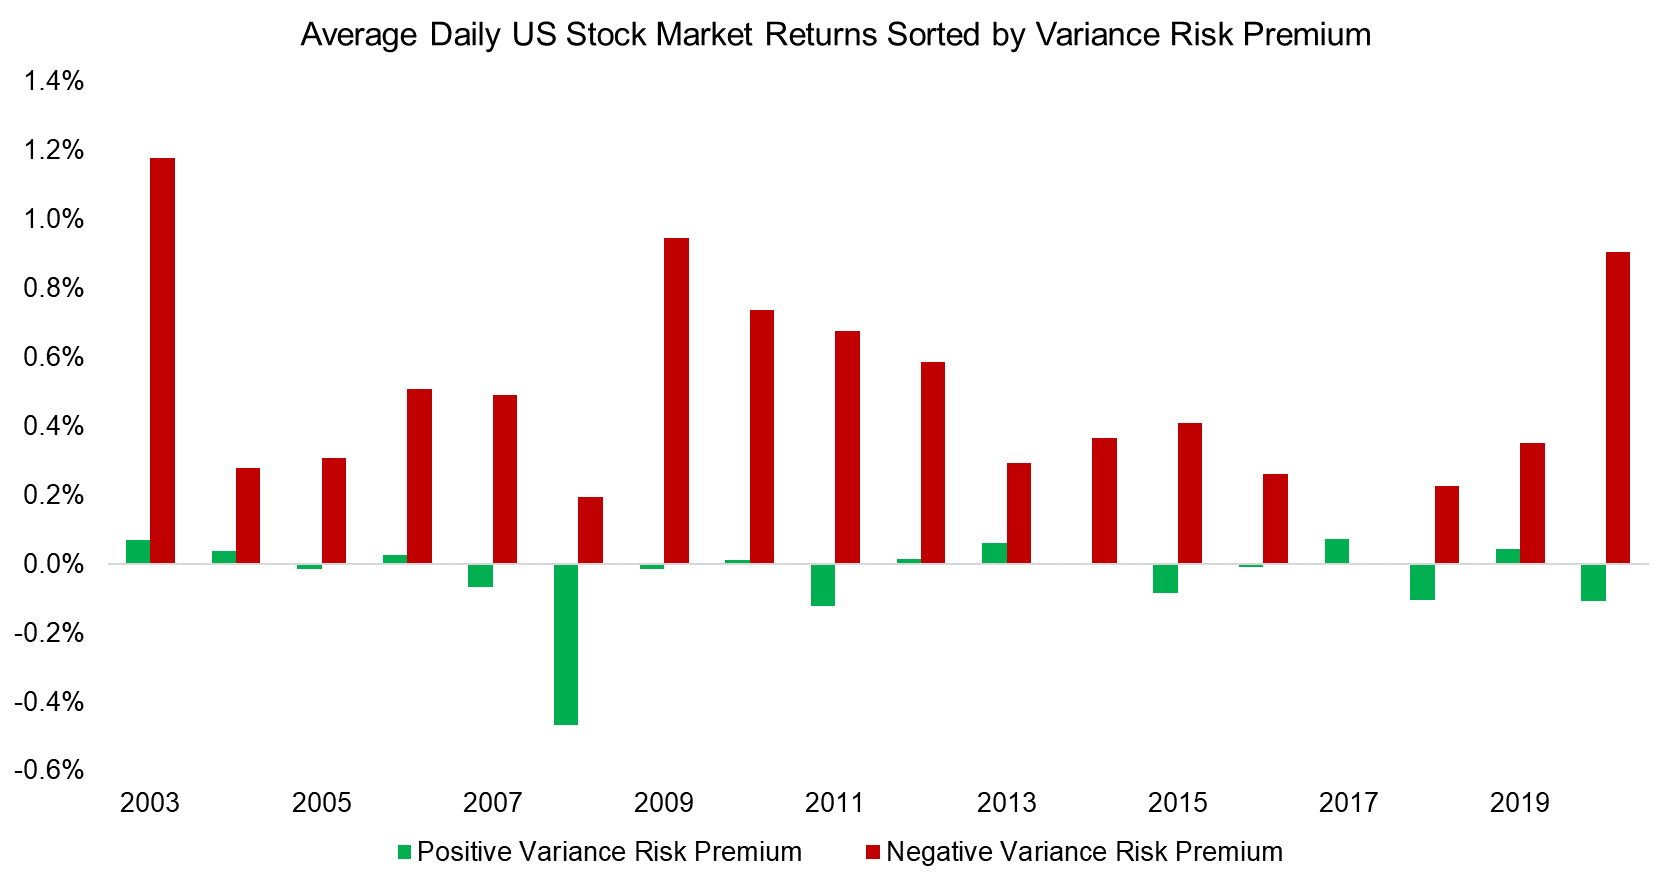
However, averages in financial data are often misleading due to skewness and kurtosis. Therefore, we calculate the returns of the US stock market for each year in a period spanning almost 20 years and sort them by the sign of the variance risk premium.
This more granular calculation does not change the perspective as almost all positive returns of the S&P 500 were generated when the VRP was negative.
Source: FactorResearch
USING THE VARIANCE RISK PREMIUM FOR MARKET TIMING
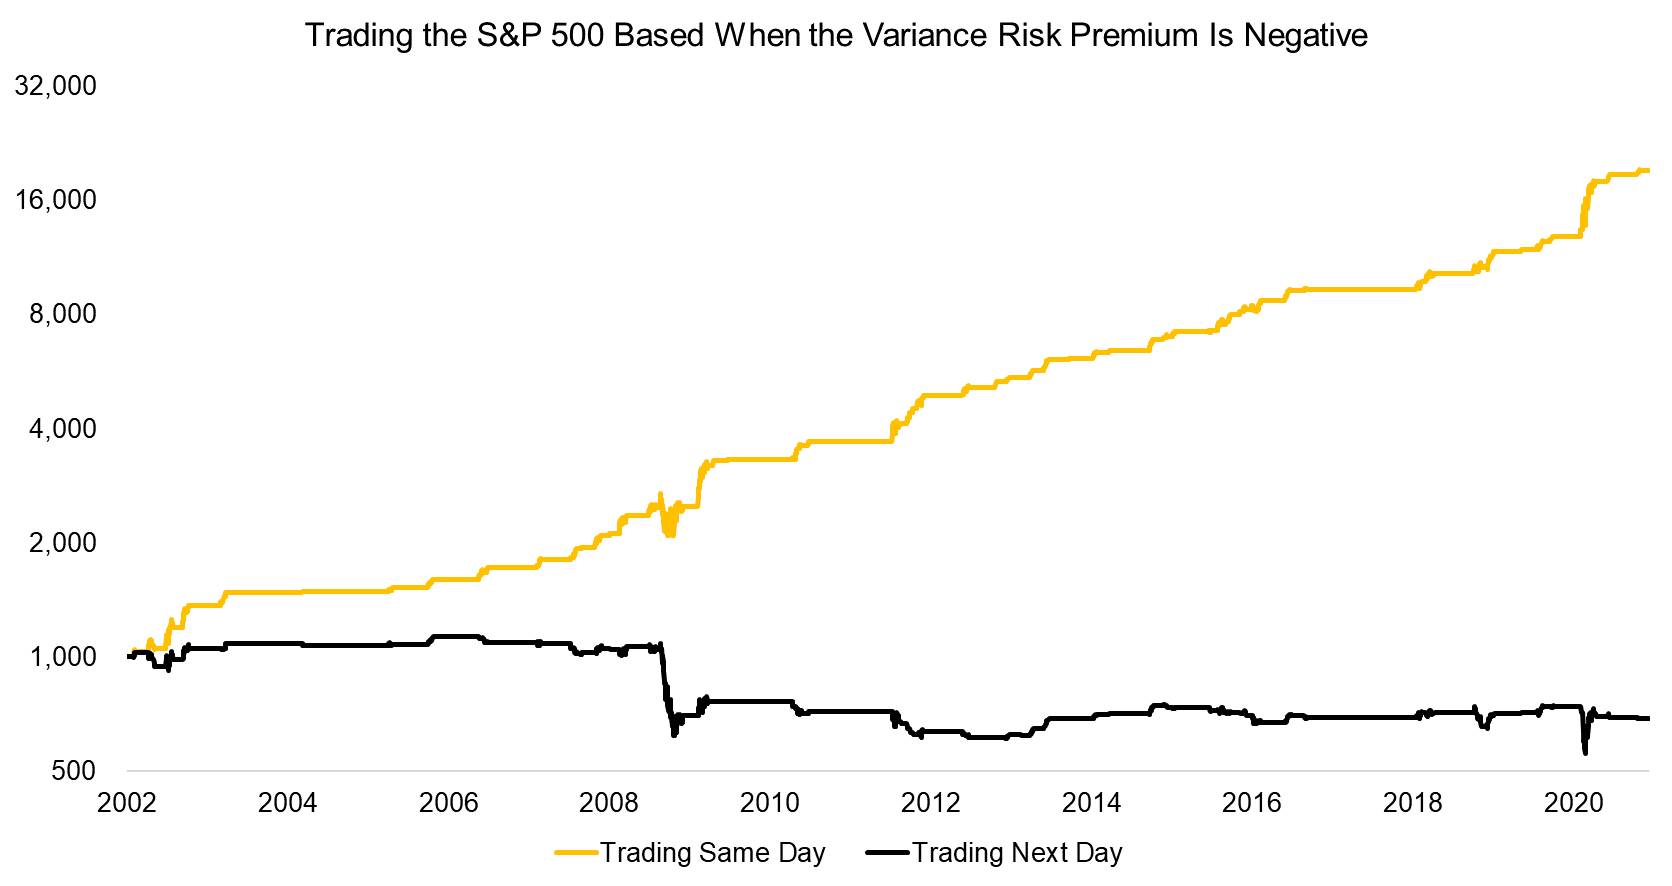
It is quite natural to question if the variance risk premium can be used for market timing, although this is a futile endeavor in general. Intuitively an investor should buy the S&P 500 when the VRP is negative and have zero exposure when positive (read Market Timing vs Risk Management).
Such a strategy would have generated high risk-adjusted returns, ignoring transaction costs, and required only a few trades each year. However, it is not a strategy that can be implemented as the VRP depends on what the market is doing that day, i.e. the events are happening simultaneously.
Theoretically, an investor could trade based on the VRP as of the previous day, but testing this strategy reveals an essentially flat performance, ignoring an almost 50% drawdown during the global financial crisis in 2008.
Source: FactorResearch
Why is trading on the VRP based on the previous day so unattractive compared to trading on the same day?
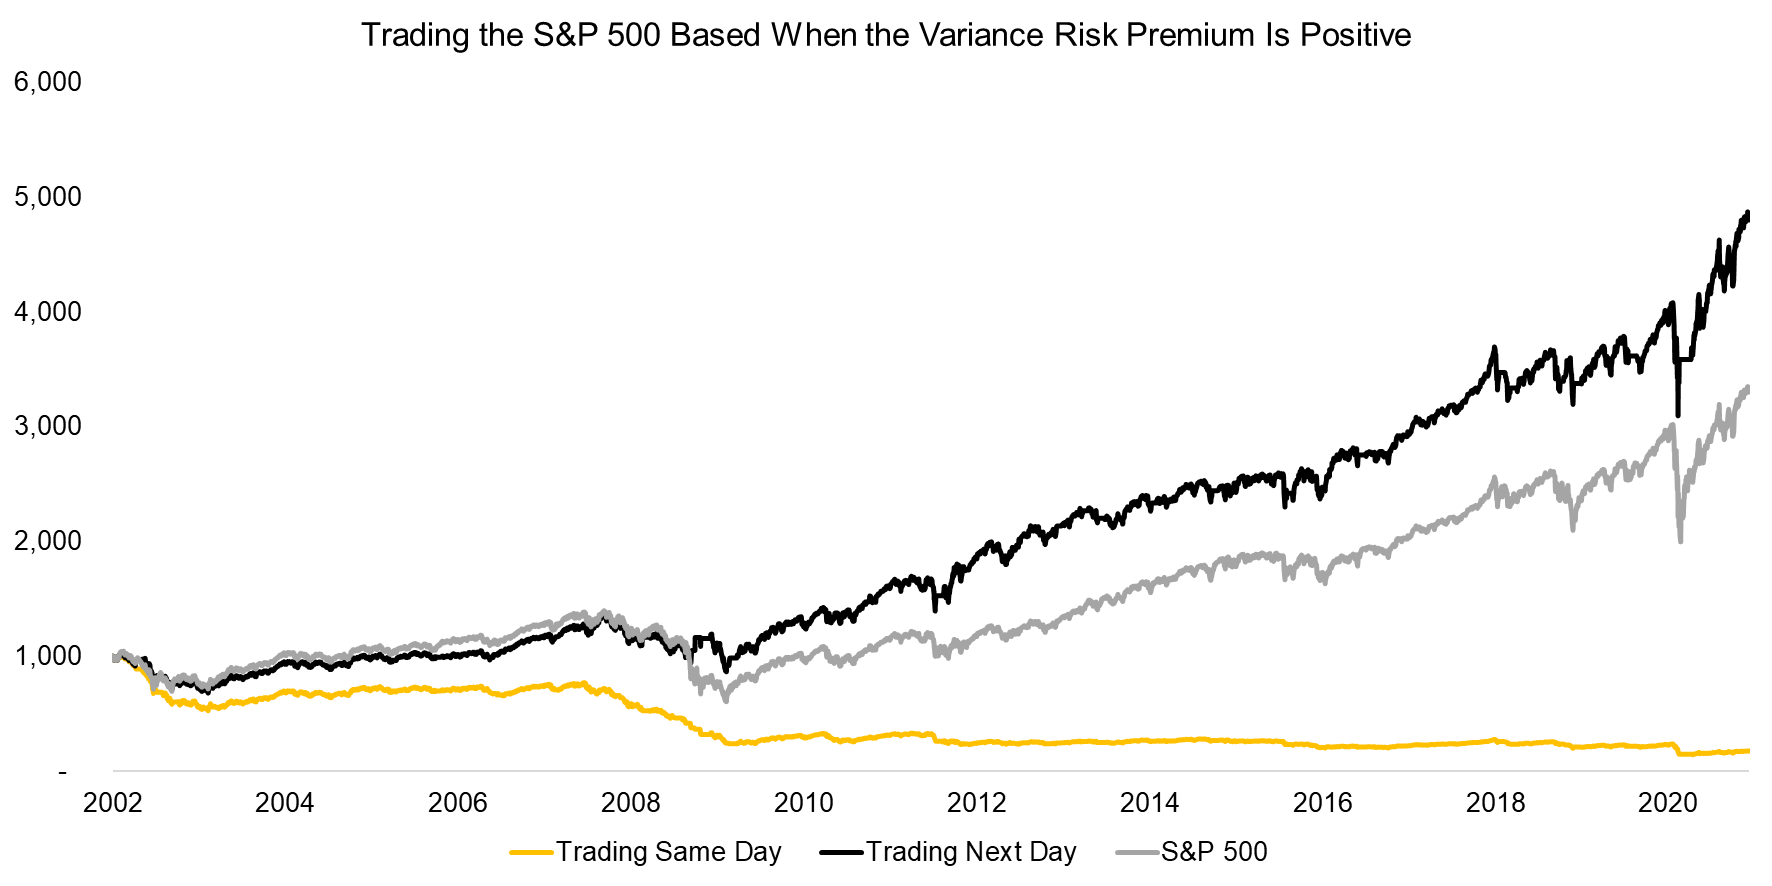
In order to explore this question further, we simulate trading the S&P 500 when the VRP is positive. As expected, this would result in a consistently declining performance if conducted on the same day (also not a realistic strategy).
However, if the trade is conducted based on the VRP of the previous day, which is an implementable strategy, then positive returns could have been generated. This may be somewhat confusing as the returns were flat when trading the next day when the VRP was negative. The results can be reconciled by the number of trading days, which are the majority in the former but the minority in the latter case.
More importantly, there seems to be a lack of autocorrelation in the VRP on a daily basis. Trading when the VRP was positive the previous day resulted in capturing the majority of trading days in a random fashion, which simply replicated the performance of the S&P 500.
Source: FactorResearch
FURTHER THOUGHTS
So, given that the variance risk premium is currently at historically high levels, should investors be concerned?
Based on this analysis, the short answer is no. However, we only analyzed the relationship between stock market returns and the VRP on a daily basis. Some research suggests that the VRP has high predictive powers for expected returns in the medium term, which is worth exploring further.
One of the challenges of the variance risk premium is to identify its drivers. An increase or decrease in the VRP can be based on a change in implied volatility, realized volatility, or both. There are multiple factors impacting these and it is often unclear what is causing these variables to go up or down. It is somewhat like asking what made investors suddenly change their minds on technology stocks in March 2000. Tough to say, even with full hindsight.
RELATED RESEARCH
The Variance Risk Premium: What Premium?
Volatility Hedge Funds: The Good, the Bad, and the Ugly
ABOUT THE AUTHOR
Nicolas Rabener is the CEO & Founder of Finominal, which empowers professional investors with data, technology, and research insights to improve their investment outcomes. Previously he created Jackdaw Capital, an award-winning quantitative hedge fund. Before that Nicolas worked at GIC and Citigroup in London and New York. Nicolas holds a Master of Finance from HHL Leipzig Graduate School of Management, is a CAIA charter holder, and enjoys endurance sports (Ironman & 100km Ultramarathon).
Connect with me on LinkedIn or X.

