Mean-Reversion on Equity Index Level
Buy the Dip? Not before the 1970s.
December 2017. Reading Time: 10 Minutes. Author: Nicolas Rabener.
SUMMARY
- Mean-Reversion on index level became profitable post the 1970s, before that Momentum dominated
- The structural shift from Momentum to Mean-Reversion is consistent across markets
- Likely explained by the evolution of financial markets
INTRODUCTION
Investors and traders basically only have two options when it comes to investing: speculate on Momentum or Mean-Reversion. Naturally these options can be played across different time frames, e.g. high frequency trading versus value investing, different asset classes and across or within securities. It is difficult to say which force is stronger, there is sufficient empirical research on both strategies, e.g. Value as a form of long-term Mean-Reversion and trend-following as form of Momentum. In this short research note we will analyse how these two forces played out in the short-term on equity index level across markets (read Death, Taxes and Mean-Reversion).
METHODOLOGY
We focus on short-term Mean-Reversion and Momentum (being the inverse) on equity index level in the US, Europe and Japan. We show the results for Mean-Reversion portfolios, which are created by measuring last weeks return as an entry signal, which is delayed by one day to make trading realistic. If the index return was positive, a short position is entered, while if the index return was negative, a long position is taken. Portfolios are created each day and held for one week, therefore the portfolio can fluctuate between being 100% net short and 100% net long. Transaction costs are excluded as we are primarily interested observing the two forces and not creating an implementable trading strategy.
MEAN-REVERSION & MOMENTUM IN THE S&P 500
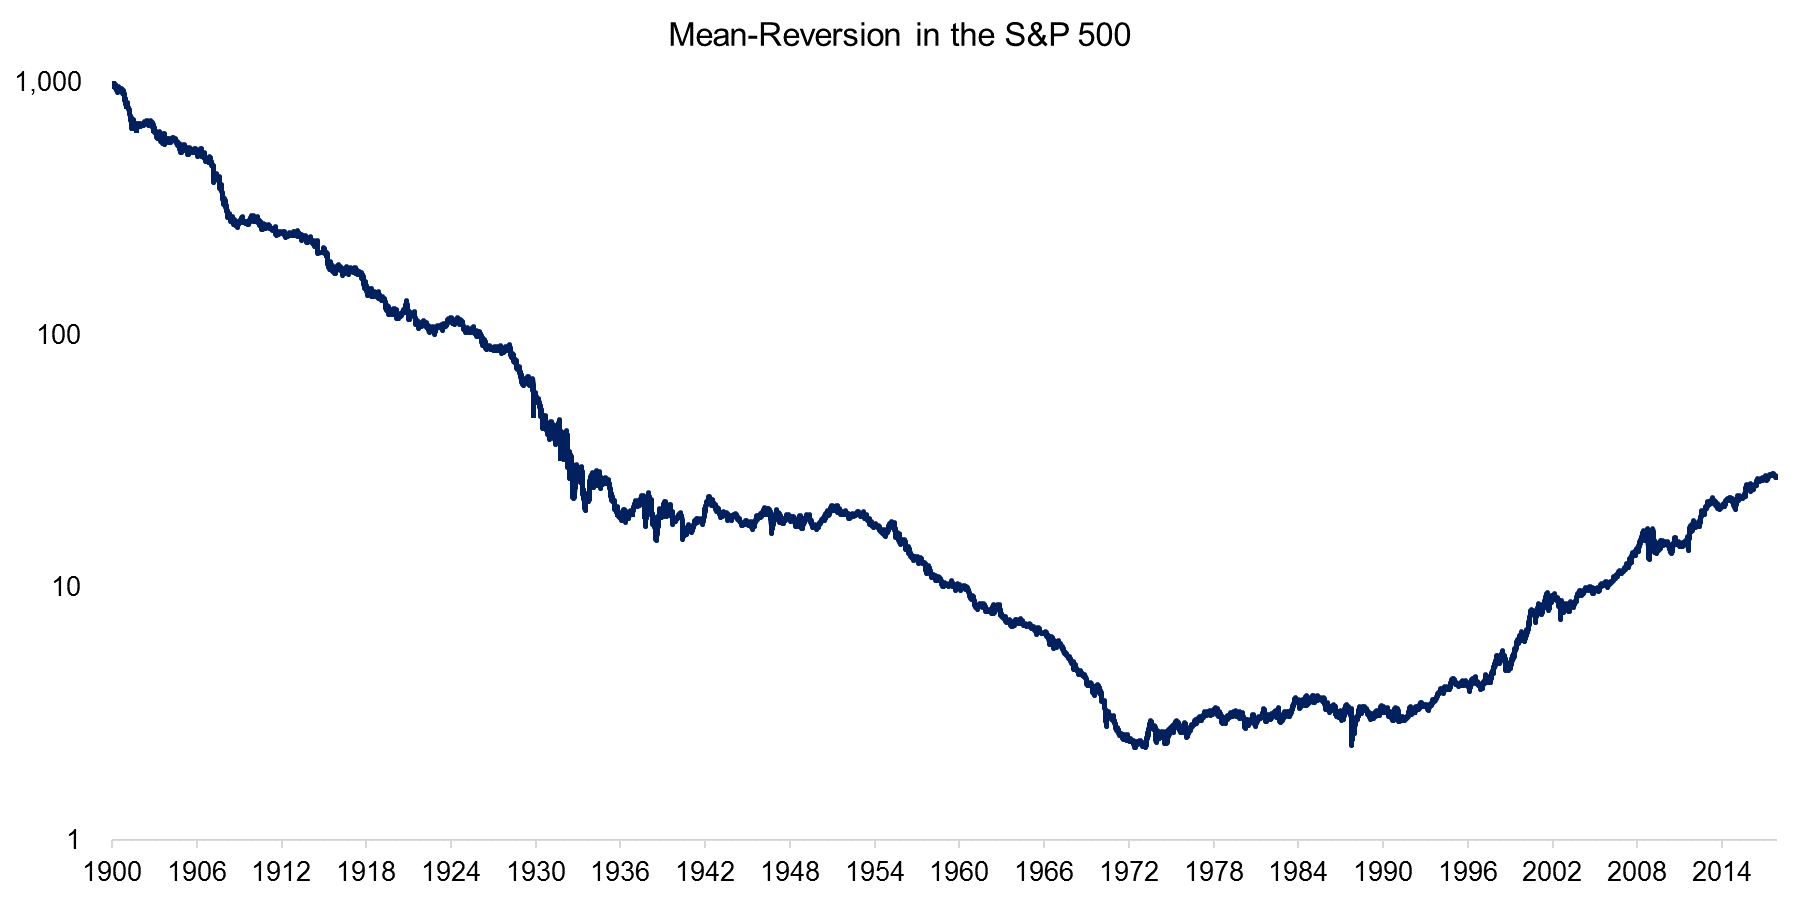
The chart below shows the short-term Mean-Reversion strategy in the S&P 500 from 1900 to 2017. The inverse of the chart would represent short-term Momentum. We can observe that from 1900 to 1972 the Mean-Reversion strategy consistently lost money, i.e. Momentum dominated on the stock market. From 1972 onward Mean-Reversion became a consistently profitable strategy while Momentum therefore became unprofitable.
Source: Stooq.com, FactorResearch
MEAN-REVERSION & MOMENTUM IN EUROPE
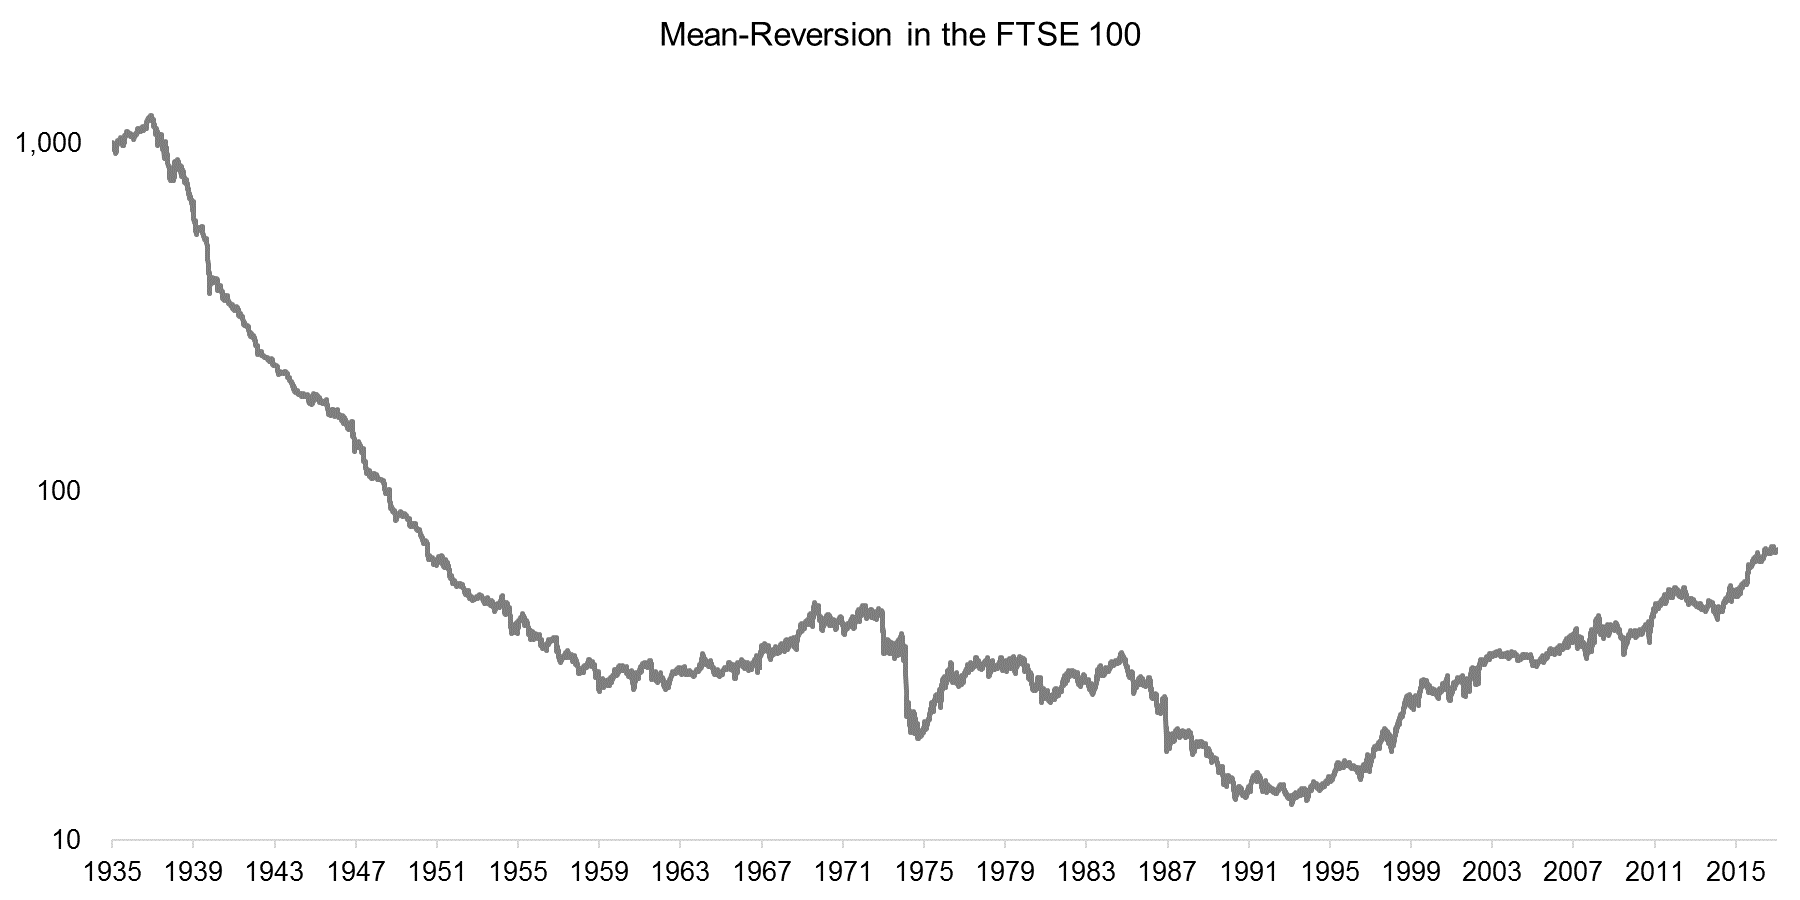
The next chart shows the Mean-Reversion strategy in the FTSE 100, where a similar picture to the S&P 500 emerges. The strategy was unprofitable until the 1990s and then became consistently profitable thereafter.
Source: Stooq.com, FactorResearch
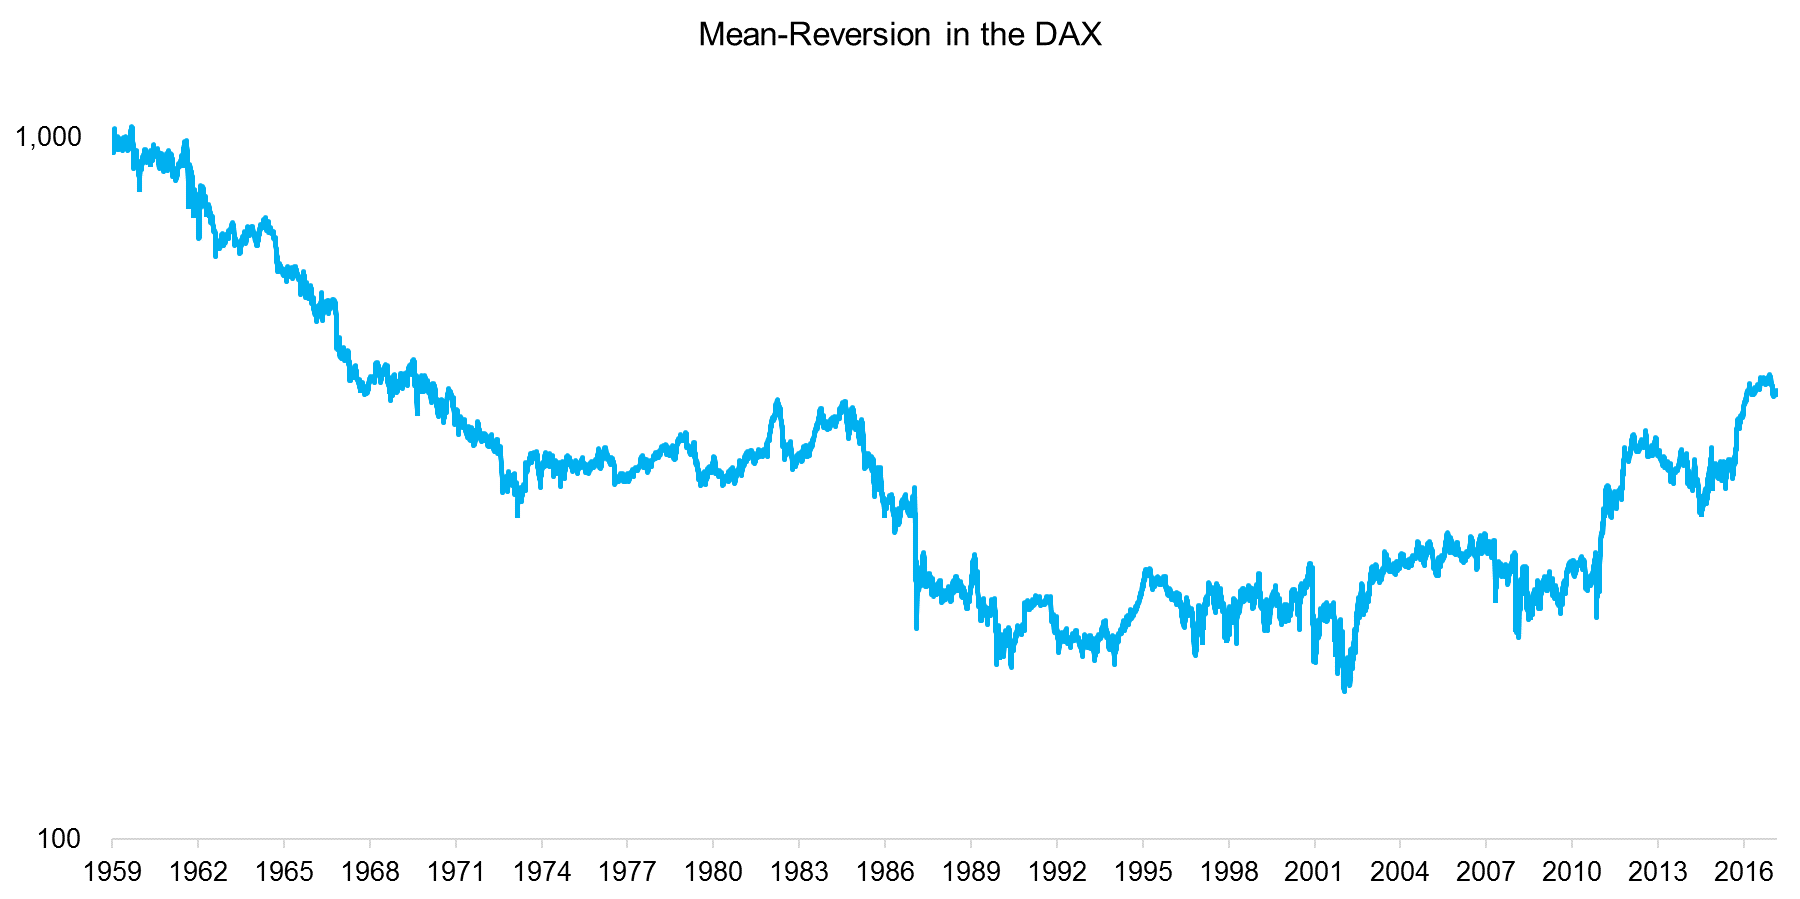
We conduct the same analysis for continental Europe by analysing the Mean-Reversion of the DAX, which shows again the same profile as previously seen in the US and UK.
Source: Stooq.com, FactorResearch
MEAN-REVERSION & MOMENTUM IN JAPAN
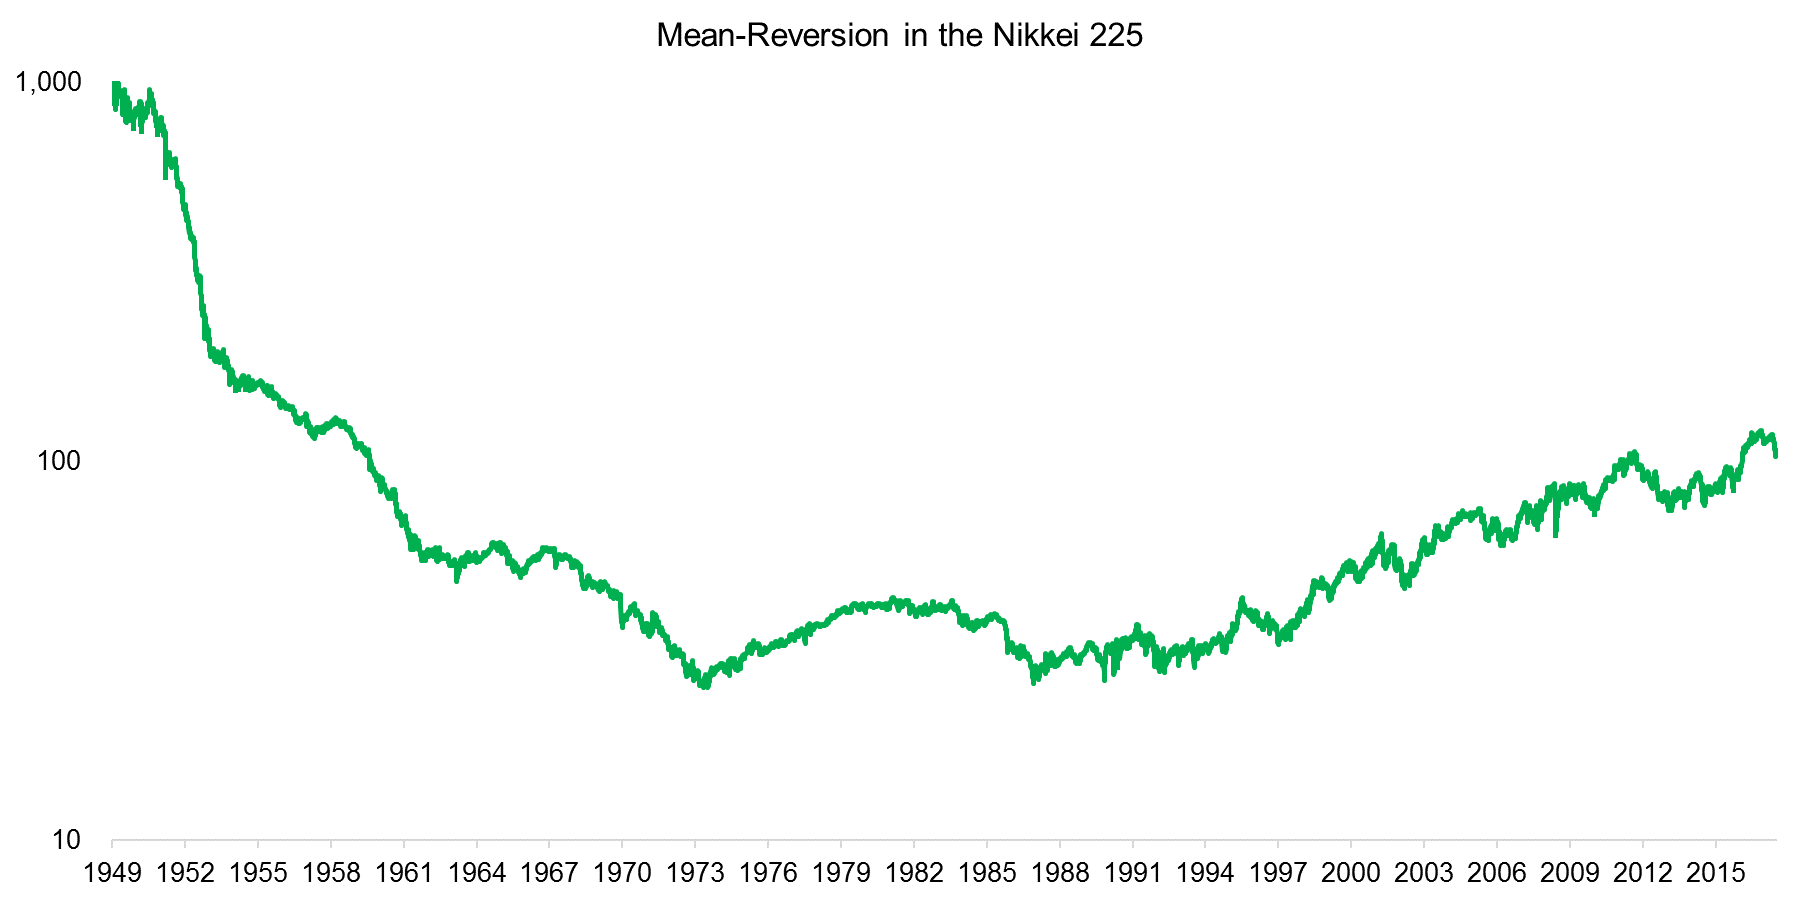
Japan is often regarded as an unusual market for quantitative strategies as many common strategies such as cross-sectional Momentum seem to generate weaker returns than in other markets (read Equity Factors In Japan). However, as the chart below shows, this does not apply to Mean-Reversion on index level.
Source: Stooq.com, FactorResearch
MEAN-REVERSION & MOMENTUM ACROSS MARKETS
The chart below shows Mean-Reversion across markets and highlights that since the late 1980s short-term Mean-Reversion has dominated Momentum as a strategy. Investors are cautious about structural changes, but given the long time periods and different markets covered in this analysis, it seems indeed that something has changed. Several significant developments took place in financial markets in the 1970s and 1980s:
- Large expansion of futures trading markets by the Chicago Board of Trade (CBOT)
- Increasing institutional asset management
- Higher synchronisation of global capital markets
- Reduction in trading fees
The first two developments can perhaps explain the change from Momentum to Mean-Reversion as with futures investors were better equipped to short markets and institutional investors are more likely to react analytically to over- and underreaction of markets than retail investors.
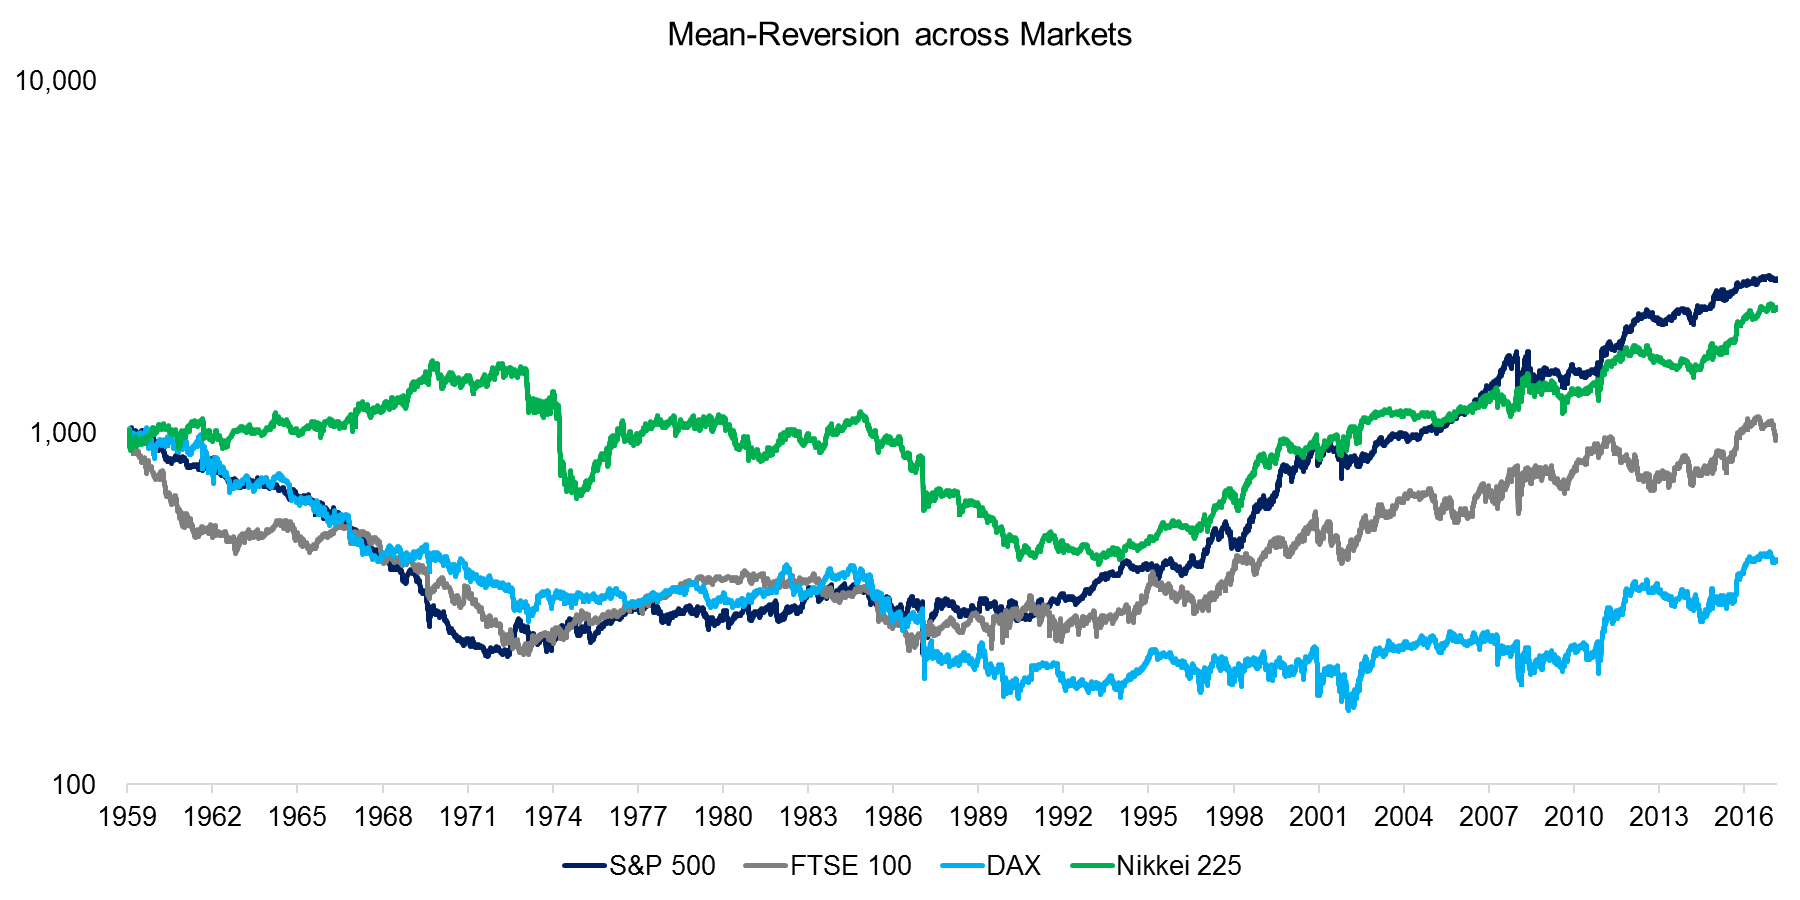
Source: Stooq.com, FactorResearch
FURTHER THOUGHTS
This research note highlights how short-term Mean-Reversion was consistently unprofitable across markets until the 1970s and then became consistently profitable thereafter, at least before transaction costs. It is rare to observe structural shifts in capital markets, but this seems to have been a permanent change. As we recently showed the cryptocurrency market is currently dominated by short-term Momentum; however, that might change as the asset class matures. Buying the dip will likely become profitable there as well.
ABOUT THE AUTHOR
Nicolas Rabener is the CEO & Founder of Finominal, which empowers professional investors with data, technology, and research insights to improve their investment outcomes. Previously he created Jackdaw Capital, an award-winning quantitative hedge fund. Before that Nicolas worked at GIC and Citigroup in London and New York. Nicolas holds a Master of Finance from HHL Leipzig Graduate School of Management, is a CAIA charter holder, and enjoys endurance sports (Ironman & 100km Ultramarathon).
Connect with me on LinkedIn or X.

