Measuring Macro Sensitivity
Putting macro variables under the microscope
August 2025. Reading Time: 10 Minutes. Author: Abhik Roy, CFA.
SUMMARY
- Macro variables affect portfolios differently
- Betas and R2 vary significantly with lookback and frequency
- GDP growth and inflation require unrealistic long track records to be useful
INTRODUCTION
On 2nd April 2025, a date that Mr. Trump dubbed the “Liberation Day”, a sweeping new tariff regime was introduced creating a swift reaction in the markets in the days that followed with the S&P 500 falling by nearly 12%. This led to a tit-for-tat escalation by many of the major trading partners of the U.S. such as China and Canada. Even after four months of multiple negotiations and pauses, the tariff saga still remains a dynamic and expanding issue.
Economists across the world started commenting on these events and probable outcomes for the U.S. and the world. A common sentiment that echoed throughout was rising inflation and an imminent recession. Given this consensus, investors might want to start positioning their portfolios for these changes, but then the question arises, “How much is my portfolio actually affected?”
In this article, we will examine how to measure the relationship between macro variables and portfolios, and compare the different options available.
R-SQUARED VS SENSITIVITY
While sensitivity, or beta, is a common starting point for measuring these relationships, its dependency on the volatility ratio of the variables can result in figures that are artificially high or low. Furthermore, beta offers little insight into the reliability of the relationship, so we will primarily focus on the R2 where a higher value denotes more explainability.
To measure the beta and R2, we must first determine the appropriate lookback period and data frequency. While a longer lookback and lower frequency gives more long-term stable estimates, investors often do not have the luxury of extensive historical data and must rely on shorter timeframes. Does this render the resulting estimates unreliable?
To test this, we will create four portfolios in the U.S. – a 100% equity, 100% bond, 100% commodities and a traditional 60/40 equity/bond mix. Then we measure the R2 of each portfolio by regressing them against a set of macroeconomic variables across various timeframes.
SENSITIVITY TO INFLATION
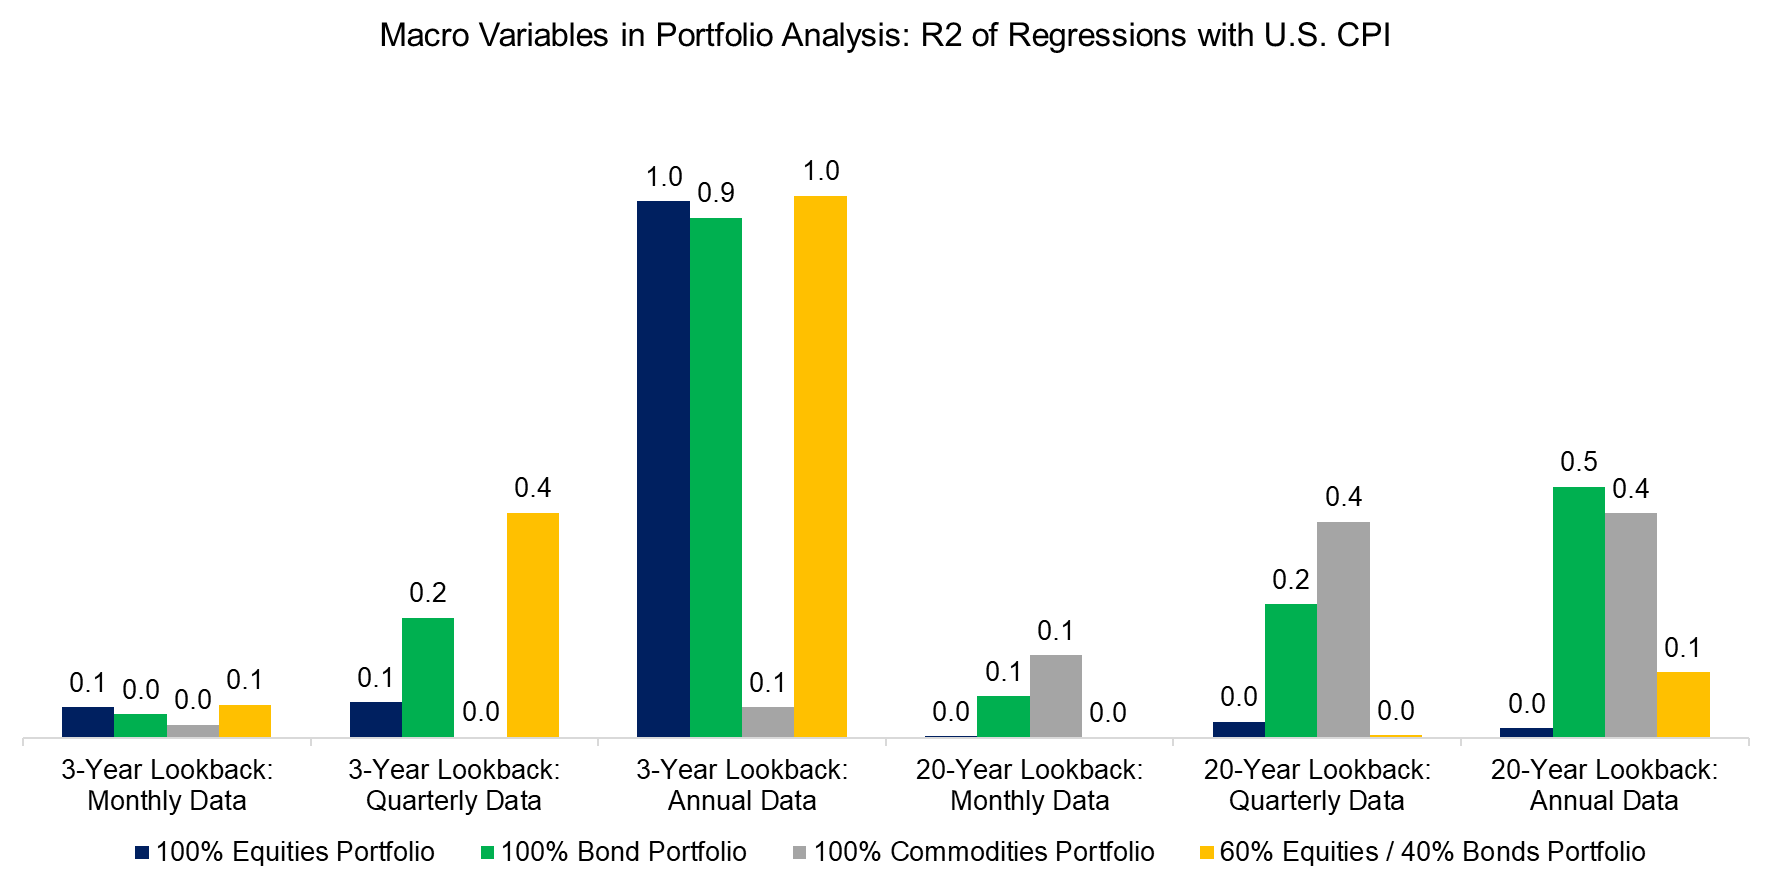
CPI data in the U.S. is readily available at a monthly frequency so we calculate the R2 on a 3-year and a 20-year lookback. We will also calculate the R2 on a monthly, quarterly and annual frequency. Looking at the R2s, the 3-year annual values are quite high, but these are calculated with only three data points and are likely spurious. We will exclude this combination from the charts in our subsequent analysis of other macroeconomic variables.
Looking at the 20-year R2s, we see higher values for bonds and commodities which makes sense, given that nominal bond yields have an inflation component and commodities are often viewed as inflation hedges. Conversely, when examining the 3-year monthly R2s, the values decrease significantly. This suggests that CPI sensitivity is more effectively measured over a longer lookback period and a less frequent timeframe.
Source: Finominal
SENSITIVITY TO GDP GROWTH
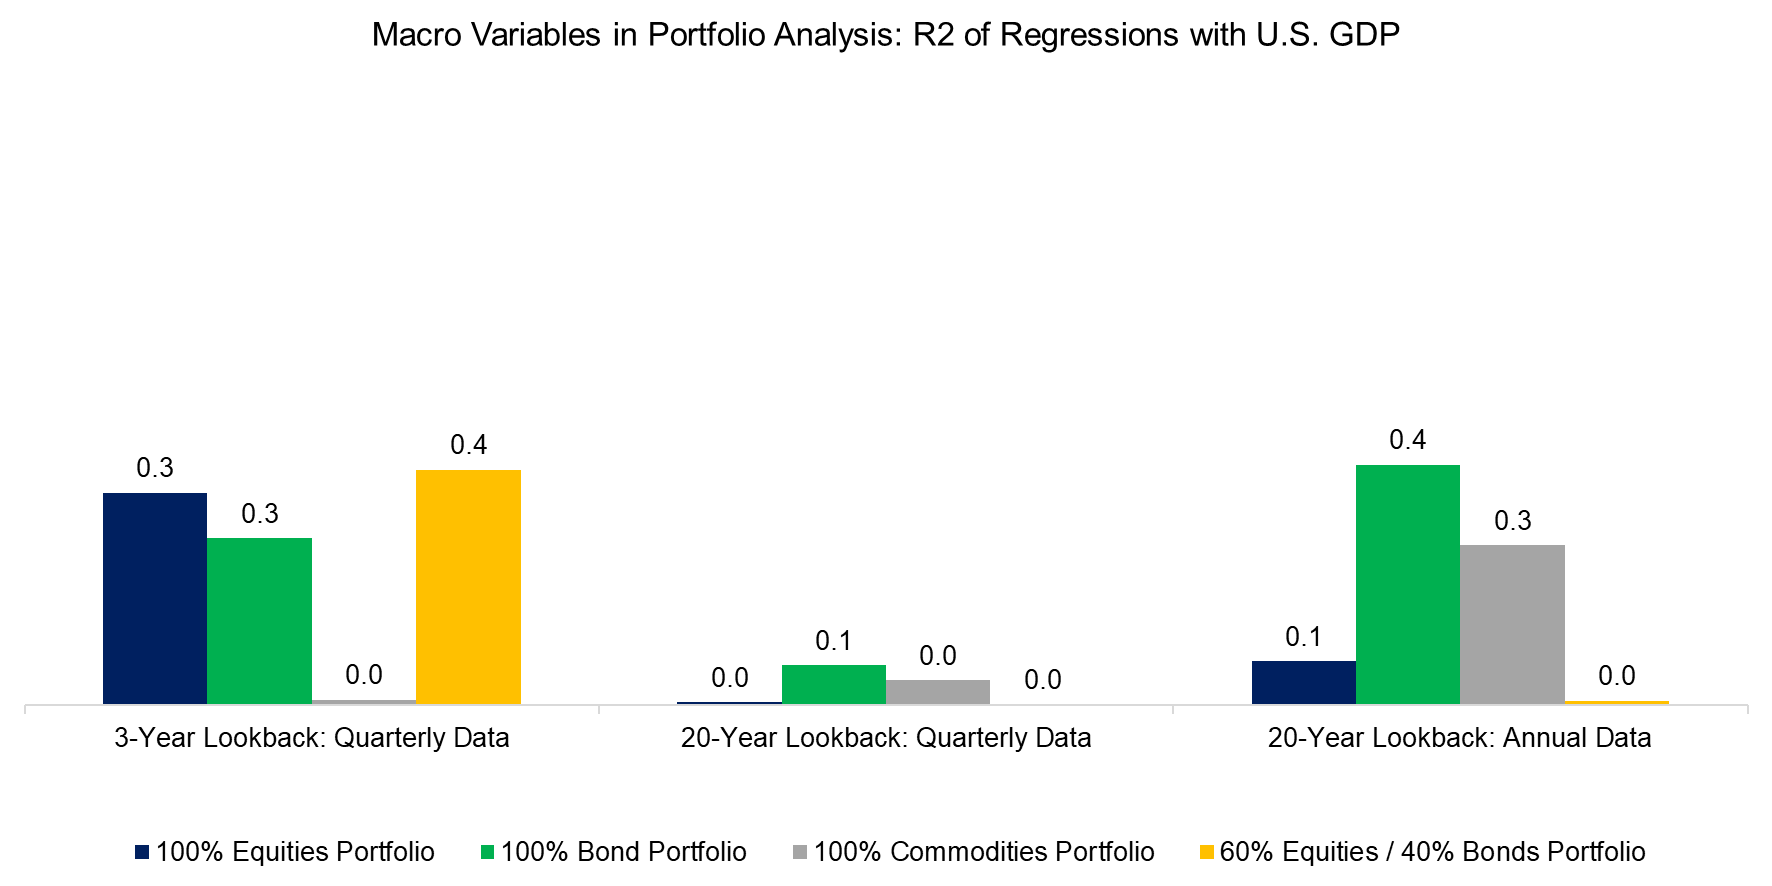
GDP is one of the most widely used variables for forecasting market outlooks. Since official GDP data from FRED is reported quarterly, calculating R2 values on more frequent timeframes is not feasible. Looking at the R2s, the values are moderately low across both 3-year and 20-year lookbacks. Also, the values vary significantly for the portfolios as they move from a shorter to longer lookback signifying the importance of lookback in case for measuring the sensitivity of GDP.
Source: Finominal
SENSITIVITY TO INTEREST RATES
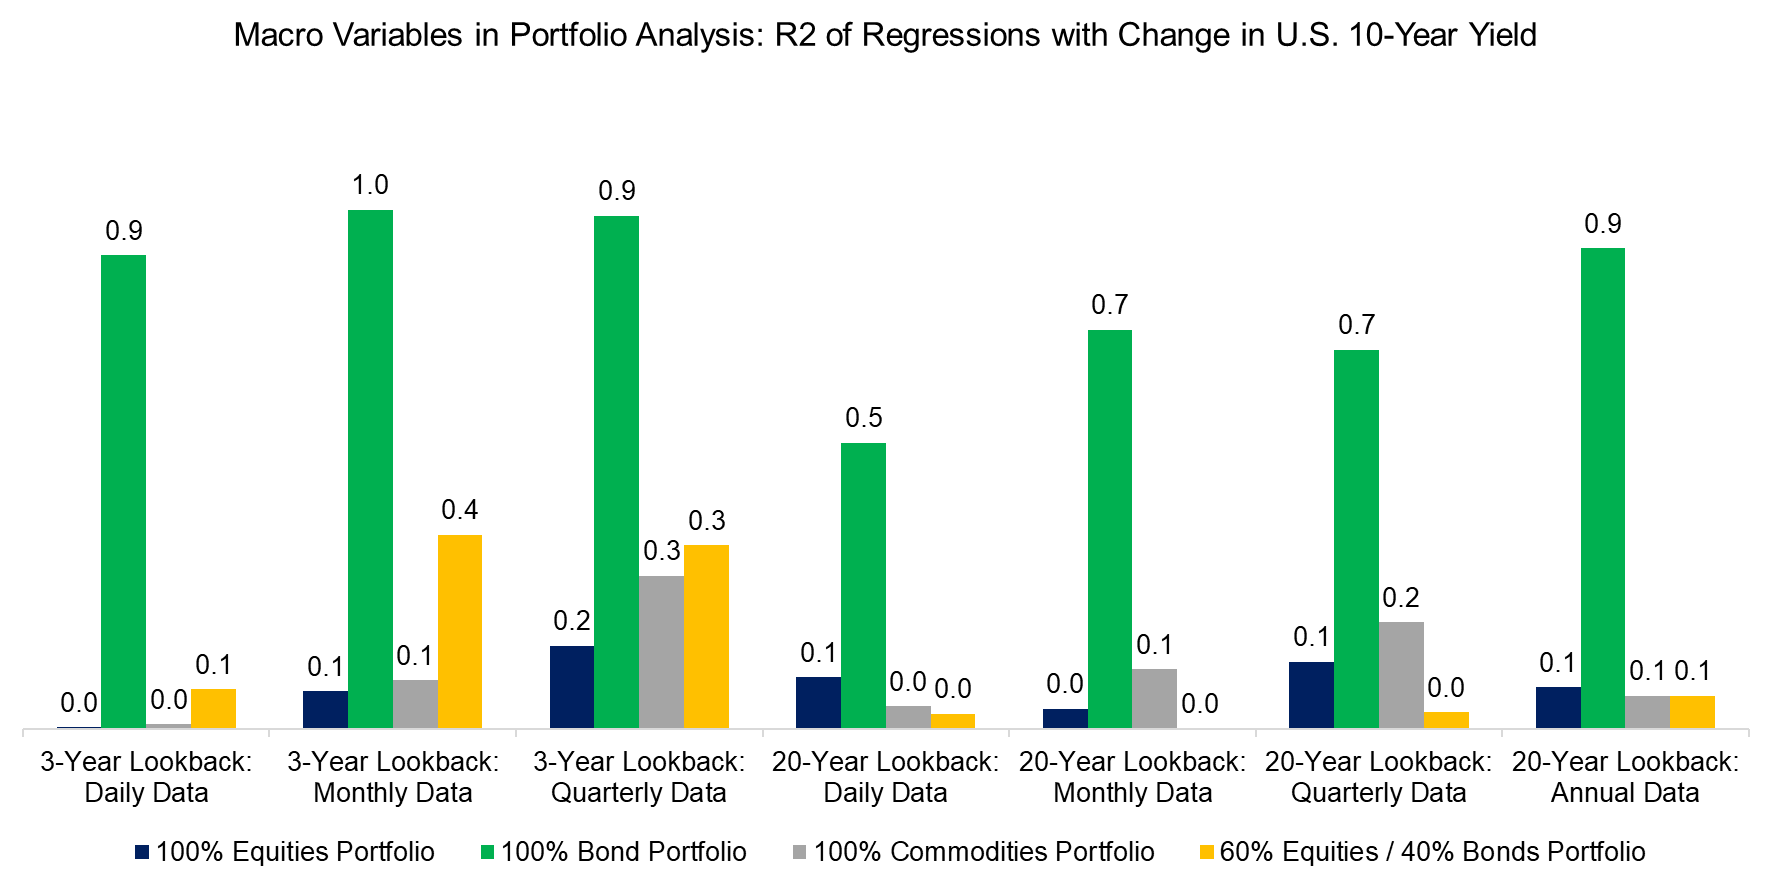
Next, calculating the R2s with respect to the change in nominal U.S. 10-year bond yields, we find a very high R2 with bonds, which is expected given the inverse relationship. The R2 is also noticeable for the 60/40 portfolio but that can be attributed to its bond allocation. The remaining portfolios appear to be largely unaffected by changes in bond yields.
The R2 for the bond portfolio also remains quite high across both the 3-year and 20-year timeframes so, investors can still derive valid sensitivity measures even when using a shorter lookback period and higher data frequency.
Source: Finominal
SENSITIVITY TO U.S. DOLLAR
The U.S. Dollar Index (DXY) measures the value of the U.S. dollar against a basket of six major foreign currencies, showing how strong or weak the dollar is globally.
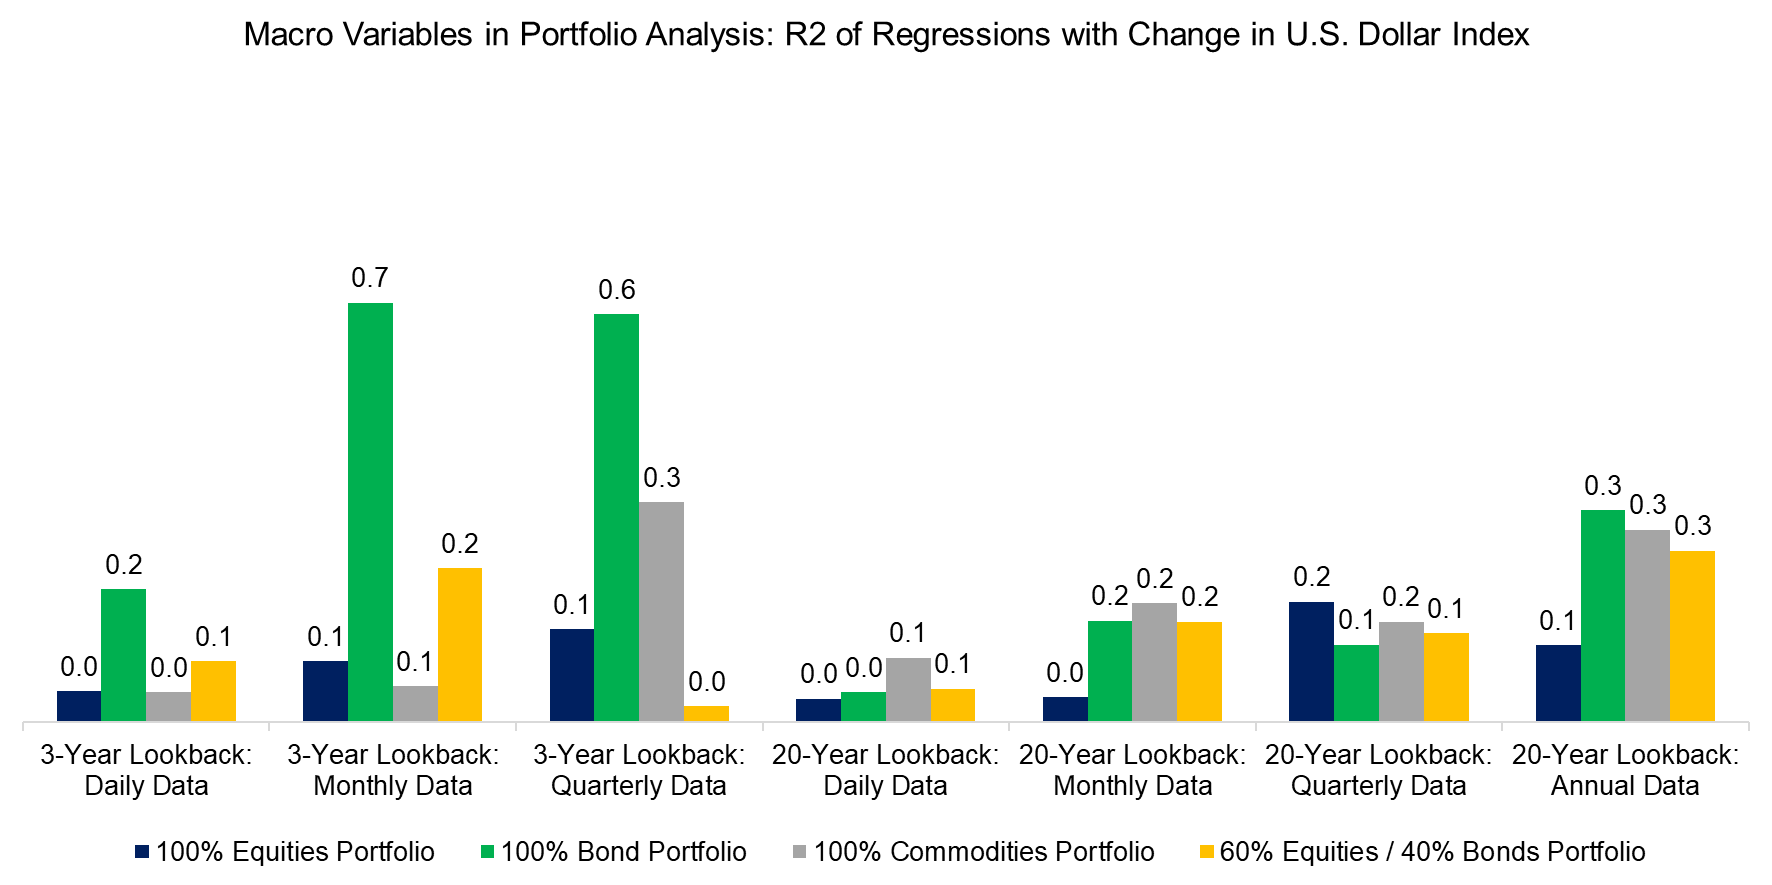
Over a 20-year lookback, we observe a moderate R-squared for all portfolios which can be explained by the interplay of various other factors like yields, risk sentiment etc. For instance, higher U.S. yields often attract foreign investment, strengthening the dollar, which typically results in an inverse correlation between bonds and the dollar index. We also observe that the R2s vary significantly between the lookback periods so the choice of lookback becomes essential.
Source: Finominal
SENSITIVITY TO U.S. VIX INDEX
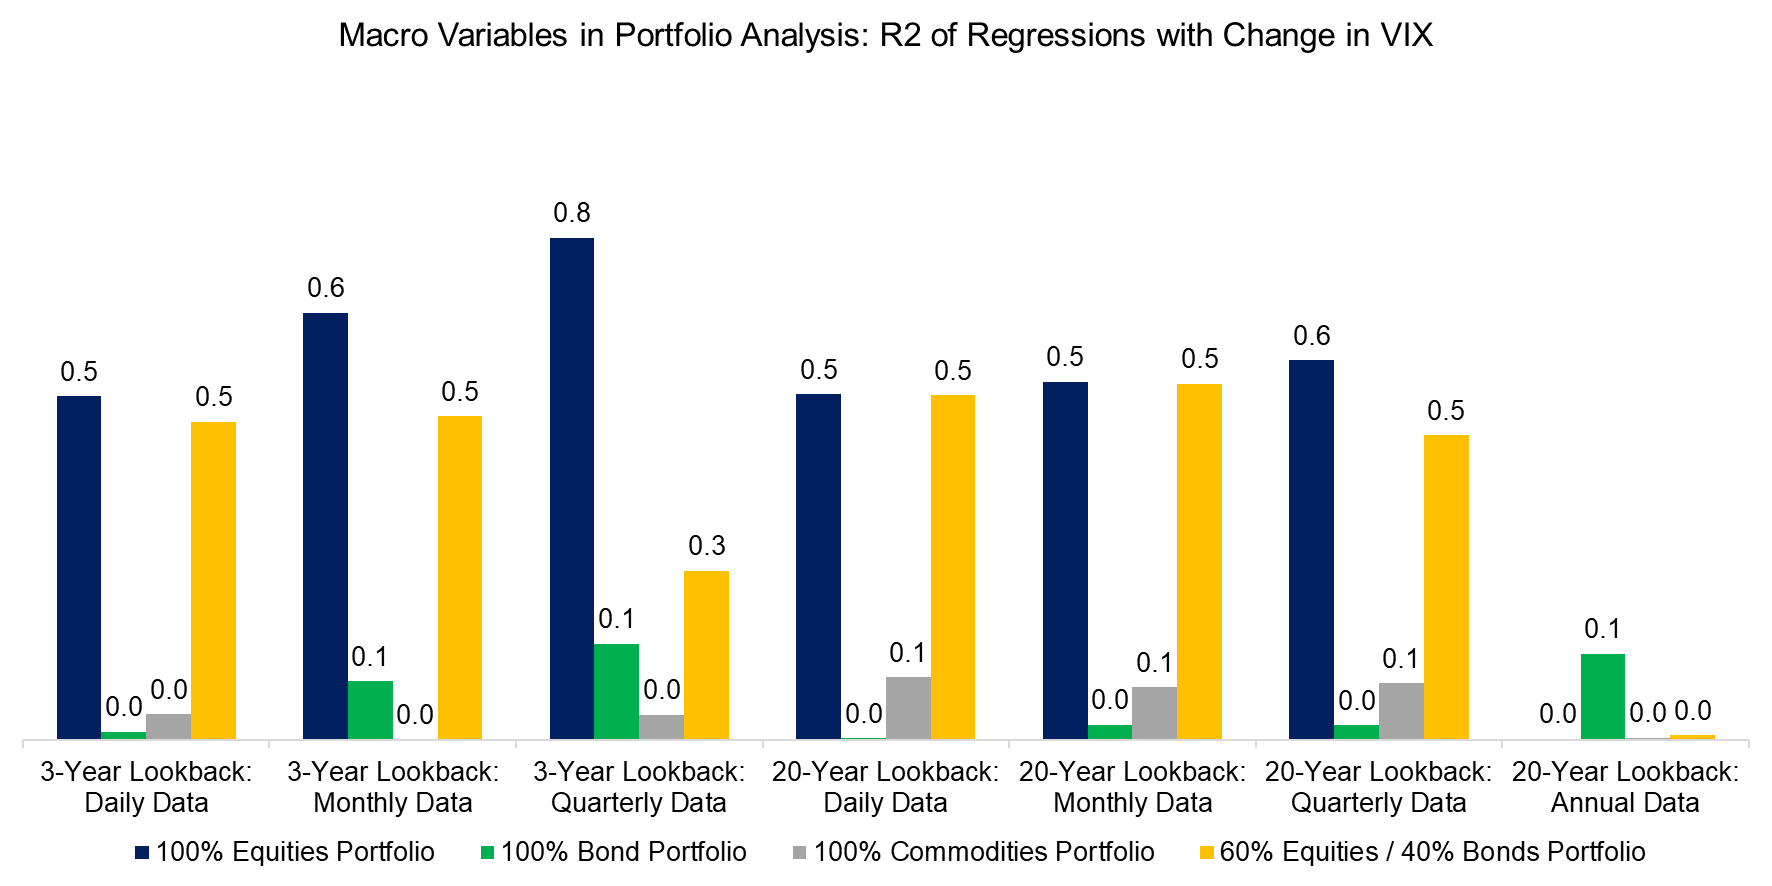
Lastly, we measure the R2s to change in the U.S VIX Index, which gauges the market’s expectations of volatility in the S&P 500 over the next 30 days.
Naturally, we observe a significant relationship between the VIX and the equities portfolio. Interestingly, the relationship fades away as we move to an annual frequency. The R2 values remain fairly consistent across both 3-year and 20-year lookbacks, so we can conclude that the sensitivity to VIX should be calculated on a higher frequency data while the choice of lookback can be more flexible.
Source: Finominal
FURTHER THOUGHTS
This article sought to determine the optimal lookback period and data frequency for measuring sensitivities to macroeconomic variables. The answer? It depends.
Variables such as GDP and inflation require time for their effects to materialize, making a longer lookback and lower frequency more appropriate. However, given that most ETFs and mutual funds have short life spans, makes it questionable if these variables can be used effectively at all.
Further research could explore non-synchronous and multivariate regressions, which might enhance the explanatory power of these macroeconomic variables. This remains an interesting avenue for future research.
RELATED RESEARCH
Factor Exposure Analysis 106: Macro Variables
Equity Factors & Inflation
Equity Factors & GDP Growth
Duration of U.S. Equities – II
Factor Exposure Analysis 108: Fixed Income Factors II
Factor Exposure Analysis 107: Fixed Income Factors
ABOUT THE AUTHOR
Abhik Roy, CFA is a Quantitative Researcher at Finominal, which empowers professional investors with data, technology, and research insights to improve their investment outcomes. Abhik holds a Masters in Economics and Bachelors in Engineering from BITS Pilani. Previously he worked at Kristal.AI, a Singapore based fintech firm as a Quantitative Analyst.
Connect with me on LinkedIn.

