Minimum Variance Versus Low Volatility
Benchmarking USMV
February 2019. Reading Time: 10 Minutes. Author: Nicolas Rabener.
SUMMARY
- The largest smart beta Low Volatility ETF is technically a Minimum Variance strategy
- Low Volatility and Minimum Variance have comparable and attractive characteristics
- However, both currently feature a high sensitivity to interest rates
INTRODUCTION
The Low Volatility factor was the best performing factor in 2018, which few investors expected at the beginning of the year. Central banks across the globe were expected to start normalizing their zero interest rate policies, which would be negative for Low Volatility stocks given interest rate sensitivity. Although the factor generated negative returns in the first few quarters of 2018, the performance turned positive in the final quarter when global growth concerns emerged and investors shifted expectations to less hawkish central bank policies (read The Dark Side of Low-Volatility Stocks).
Investors anxious about global growth and interested in Low Volatility strategies may consider smart beta ETFs. The largest smart beta ETF focused on this factor is the iShares MSCI Min Vol USA ETF (USMV), which has approximately $20 billion assets under management. Although the ETF’s marketing materials allude to low volatility, technically it represents a minimum variance strategy. Investors might question if a minimum variance strategy provides the same attractive characteristics of the Low Volatility factor. In this short research note, we will contrast Low Volatility to Minimum Variance.
METHODOLOGY
USMV tracks the MSCI USA Minimum Volatility Index, which is based on the MSCI USA Index, a universe of the largest 600 U.S. stocks. The Low Volatility portfolio is created by sorting stocks of that universe by their annualized volatility and selecting the bottom 20% exhibiting the lowest volatility. Stocks are weighted by their market capitalization. The Minimum Variance portfolio is created by selecting stocks that will minimize the portfolio variance under certain constraints. These are in line with MSCI USA Minimum Volatility Index and are as follows:
- Stock weights: The lower of 1.5% or max 20x the weight as per the stocks’ market capitalization, with a minimum of 5 basis points
- Factor constraints: All factors are constrained except for Low Volatility
- Sector constraints: +/- 5% or max 3x the original sector weight
- Turnover constraints: 10% one-way turnover
In this analysis, we are effectively contrasting an unconstrained portfolio as featured in factor investing research, i.e. the Low Volatility portfolio, with an investible product that is designed with commercial considerations such as tracking error, i.e. the Minimum Variance portfolio (read Low Volatility, Low Beta & Low Correlation).
MINIMUM VARIANCE, LOW VOLATILITY AND MSCI USA
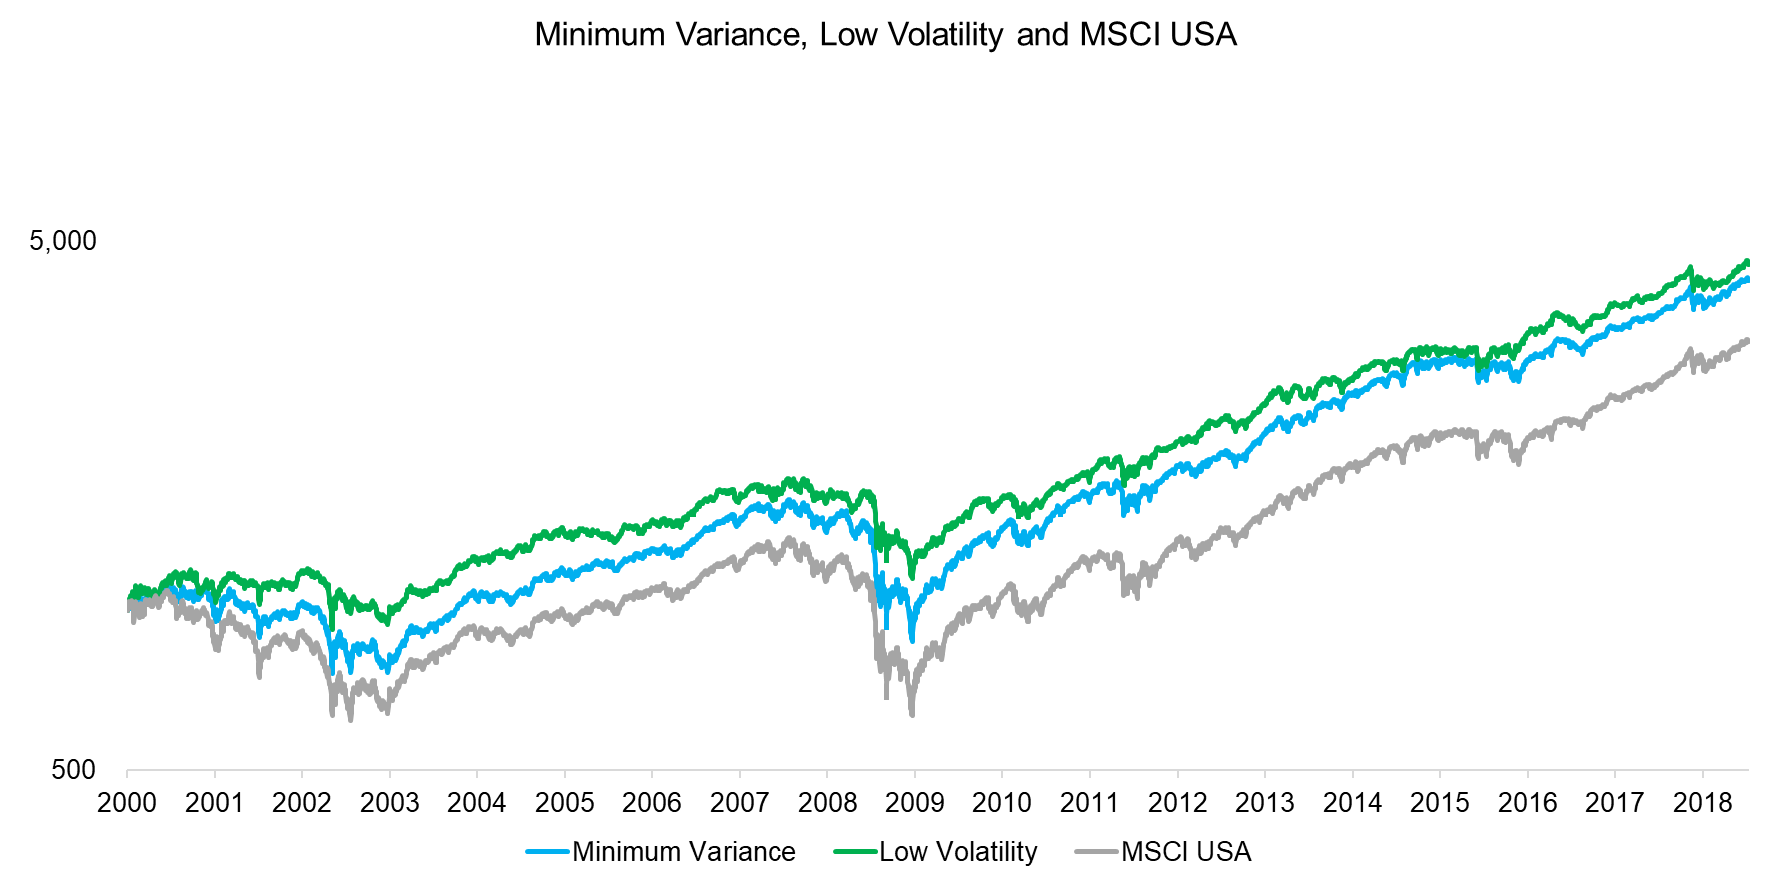
The Low Volatility portfolio outperformed the benchmark index significantly since 2000, which can mainly be explained by a far better performance during the Tech Bubble implosion between 2000 and 2003 and the Global Financial Crisis between 2008 and 2009. The Minimum Variance strategy also outperformed the market, but less than Low Volatility, which is expected given the additional constraints.
Source: FactorResearch
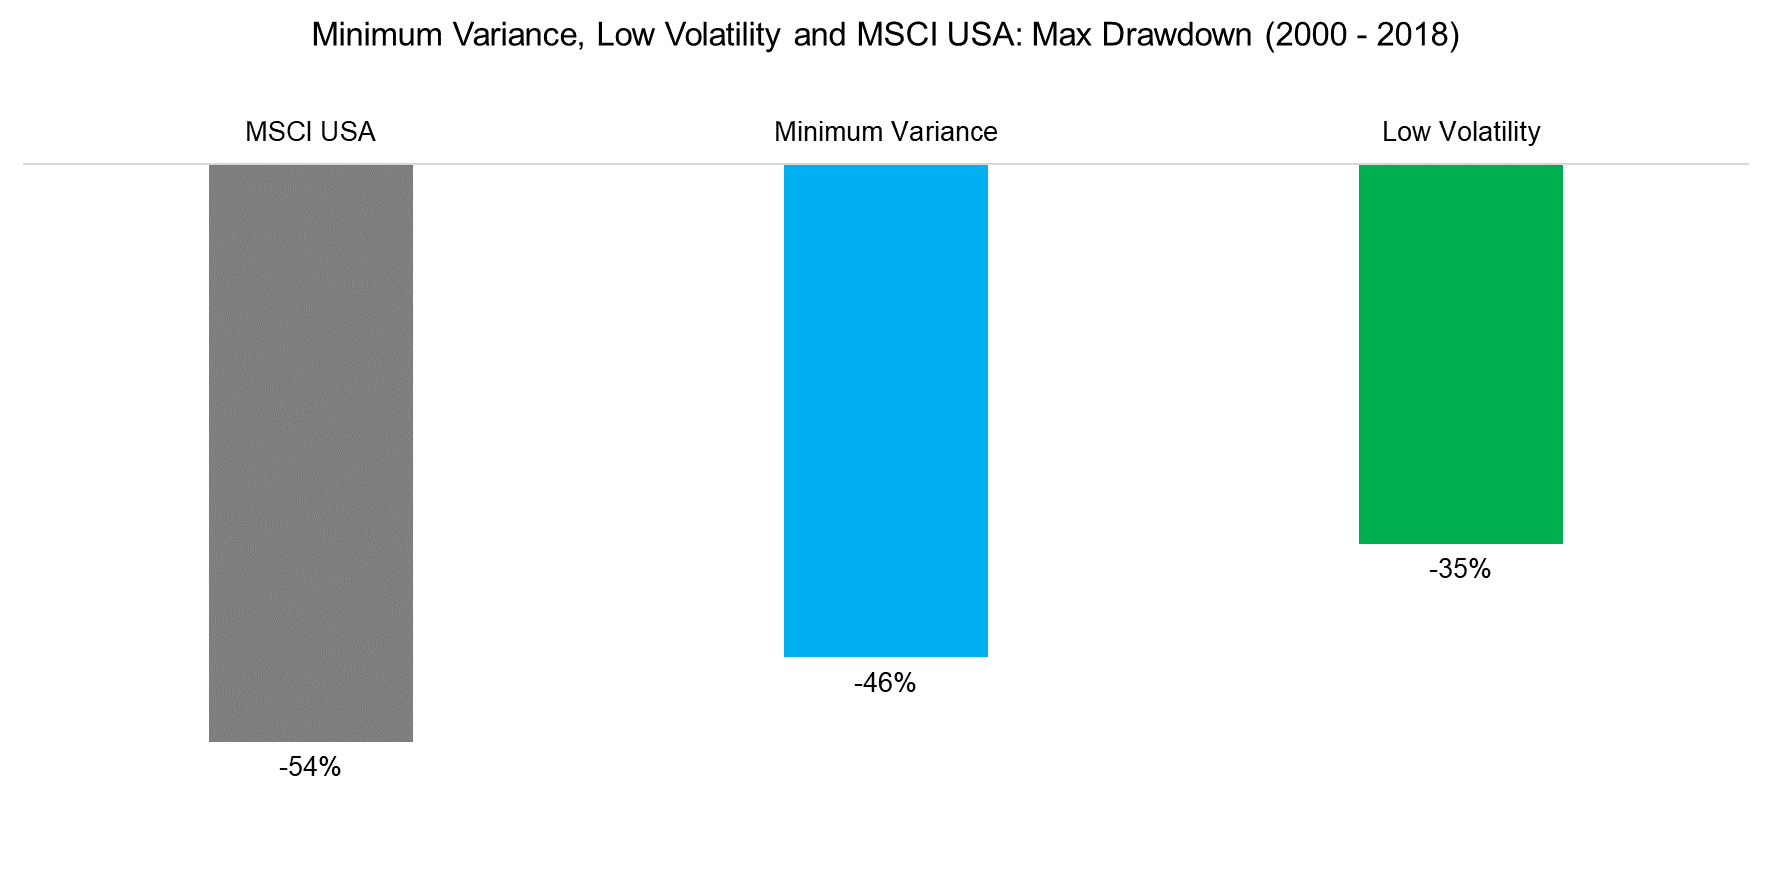
Investors are primarily seeking to reduce risk when allocating to Low Volatility strategies. We observe that both Low Volatility and Minimum Variance significantly reduced the maximum drawdown of the MSCI USA Index between 2000 and 2018, which was reached during the Global Financial Crisis.
Source: FactorResearch
ANALYSING LOW VOLATILITY AND MINIMUM VARIANCE PORTFOLIOS
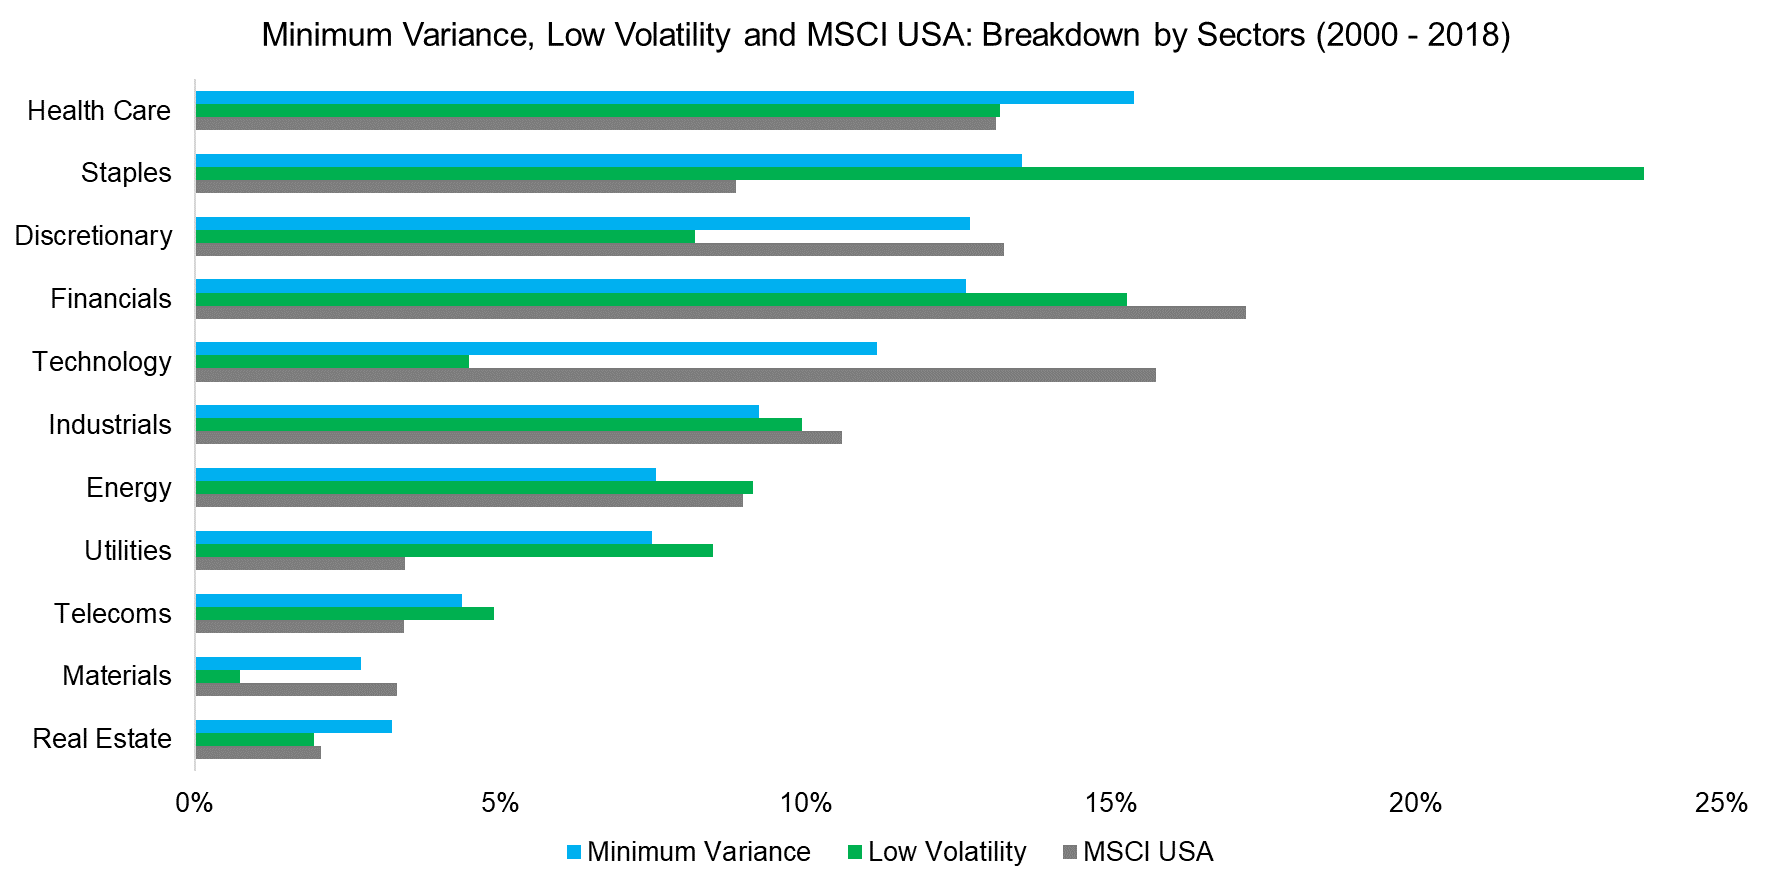
Low Volatility portfolios are well-known to exhibit biases towards sectors like Telecoms, Utilities, and Real Estate as these businesses are less cyclical and therefore trade less volatile than the market. However, there is a significant difference between constructing portfolios equal-weight, which is the standard in academic research, or by market capitalization, which is how most smart beta ETFs are created.
We use the MSCI USA with approximately 600 constituents as universe and weight by market capitalization, which naturally limits the sector overweights and underweights. Furthermore, the Minimum Variance portfolio has sector constraints that minimize the tracking error to the MSCI USA.
The largest difference is for Utilities, where the Minimum Variance portfolio has twice the weight of the benchmark. In contrast, we observe that the less constrained Low Volatility portfolio has a significant overweight in Staples and Utilities as well as an underweight in Technology and Materials.
Source: FactorResearch
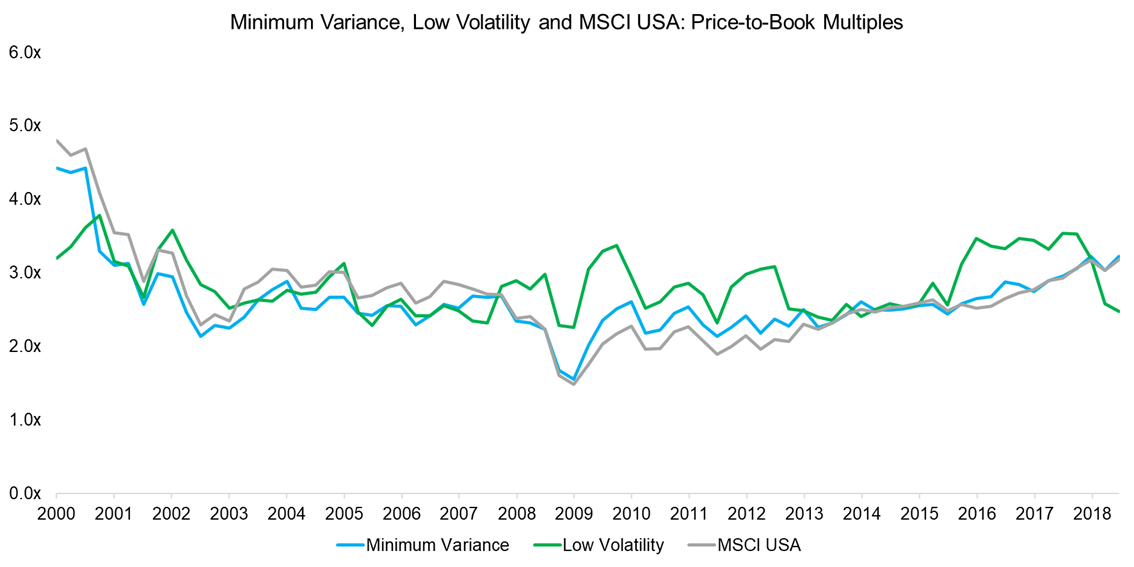
Next, we analyse the valuation of the two portfolios and the market via price-to-book multiples. The analysis highlights relatively similar multiples, which is explained by using a relatively small universe of stocks and applying market capitalization-weighting. If we would select stocks from the S&P 1500 and weight equally, then we would see more heterogeneous valuations. Low Volatility stocks became more expensive than the market after the Global Financial Crisis in 2008 to 2009, likely reflecting the bond-proxy characteristics of Low Volatility stocks and investors’ interest in the strategy.
Source: FactorResearch
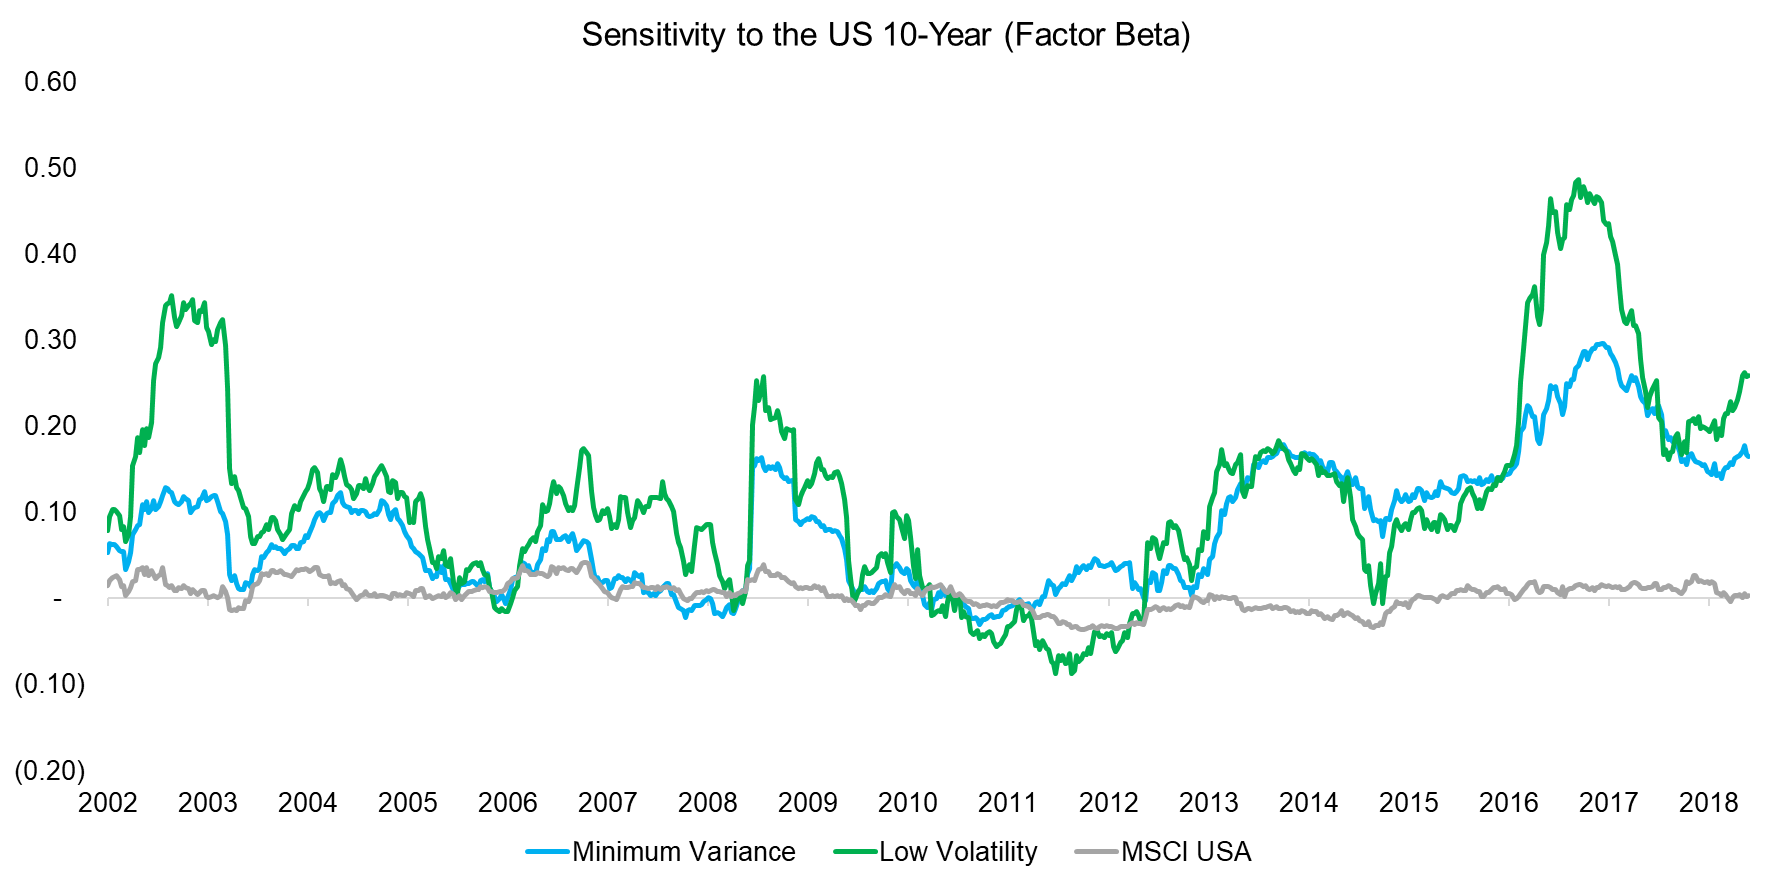
Finally, we highlight the sensitivity of the two portfolios to the U.S. 10-year. We observe that the Low Volatility and Minimum Variance portfolios exhibit a far higher interest rate sensitivity than the benchmark index. Investors concerned about the U.S. Federal Reserve raising interest rates might view these strategies as less attractive from this perspective.
Source: FactorResearch
FURTHER THOUGHTS
This short research note highlights that a Minimum Variance strategy as employed by the largest smart beta ETF in that space is relatively comparable to an unconstrained Low Volatility portfolio. Both portfolios reduced the maximum drawdowns during the Global Financial Crisis, which explains the attractiveness to investors. However, the high sensitivity to interest rates is less appealing and worth considering when evaluating these strategies.
RELATED RESEARCH
LOW VOLATILITY: INTEREST-RATE SENSITIVITY & SECTOR-NEUTRALITY
ABOUT THE AUTHOR
Nicolas Rabener is the CEO & Founder of Finominal, which empowers professional investors with data, technology, and research insights to improve their investment outcomes. Previously he created Jackdaw Capital, an award-winning quantitative hedge fund. Before that Nicolas worked at GIC and Citigroup in London and New York. Nicolas holds a Master of Finance from HHL Leipzig Graduate School of Management, is a CAIA charter holder, and enjoys endurance sports (Ironman & 100km Ultramarathon).
Connect with me on LinkedIn or X.

