Multi-Factor Models 101
Top-Down vs Bottom-Up
January 2018. Reading Time: 15 Minutes. Author: Nicolas Rabener.
SUMMARY
- Three common approaches for creating multi-factor portfolios are the Combination, the Intersectional and the Sequential models
- The results from the Combination and Intersectional models are comparable in terms of trend
- Each model has its own advantages and disadvantages, the selection will depend on investor preferences
INTRODUCTION
One way to differentiate amongst investment managers is by examining whether they analyse stocks in a bottom-up or top-down approach. Whilst the former describes investors who specialise on individual securities, i.e. traditional stock pickers, the latter group prefers to analyse countries or sectors and therefore focus their efforts more on macro trends. There is no empirical evidence that one of these approaches is superior to the other; rather, the approach reflects the experience and philosophy of the fund manager and his firm. Factor investors can also be differentiated in a similar fashion as some build factor portfolios bottom-up while others create them top-down. In this white paper we provide an analysis of three common approaches for creating multi-factor portfolios, these being the Combination, the Intersectional and the Sequential models (read Intersectional Model: Sorting 7 Factors).
METHODOLOGY
The analysis focuses on the following seven factors as components of the multi-factor portfolios: Value, Size, Momentum, Low Volatility, Quality, Growth and Dividend Yield across the following seven markets: US, Europe, UK, Japan, Australia, Hong Kong and Singapore. The factors are constructed as beta-neutral long-short portfolios by taking the top and bottom 10% of the stock universes in the US, Europe and Japan and 20% in other markets given smaller stock universes. Portfolios rebalance monthly, only contain stocks with market capitalisations larger than $1 billion and include 10 basis points of costs per transaction. The analysis covers the period from 2000 to 2017.
MODEL OVERVIEW
The three common approaches to creating multi-factor portfolios are the Combination, the Intersectional and the Sequential models. The Combination model ranks stocks by single factors and then combines these single-factor portfolios into a multi-factor portfolio. The Intersectional model sorts stocks by several factors simultaneously, which results in only one portfolio. The Sequential model ranks stocks by multiple factors sequentially, which results in one portfolio. The graphic below illustrates the three models and examples of resulting multi-factor portfolios.
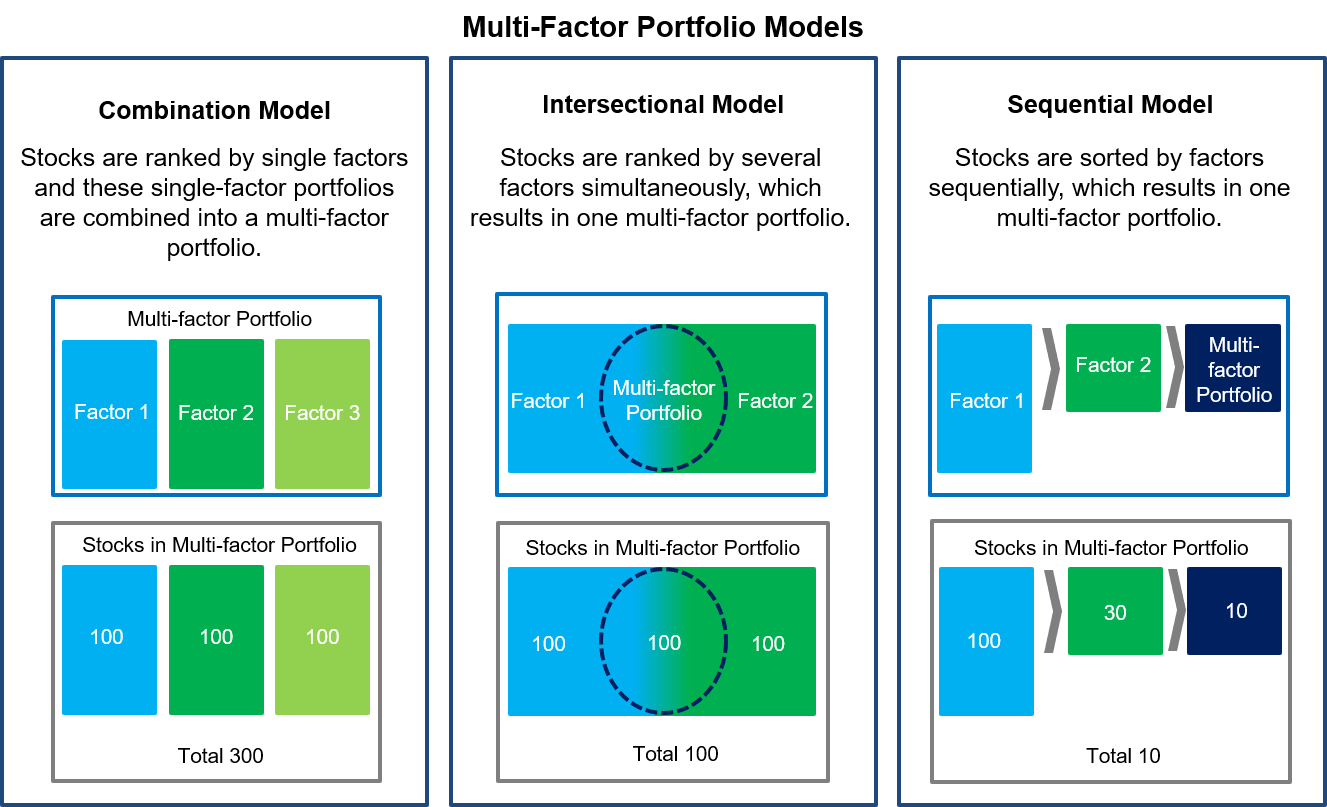
Source: FactorResearch
All three models can be applied to the same universe of stocks. The table below highlights the advantages and disadvantages, which may support an investor in the model selection process.

Source: FactorResearch
SEQUENTIAL MODEL
The model comparison in this white paper will focus on the Combination and Intersectional models and exclude the Sequential model. Although the Sequential model is a common approach for creating multi-factor portfolios and therefore worth highlighting conceptually, there are two characteristics that make the performance and risk metrics difficult to compare with those of the other two models.
First, the Sequential Model can incorporate only relatively few factors as after each sorting iteration the available stock universe decreases significantly. For example, our definition of the US universe currently includes 1,600 tradable stocks above $1 billion market capitalisation, which reduces to 480 stocks after sorting by the first factor and then to 144 stocks after sorting for a second factor, assuming 30% percentile for the top and bottom in each iteration. In countries with smaller stock universes, e.g. Australia, this model quickly has too few stocks for achieving a meaningfully diversified portfolio. In comparison, there are no limits to how many factors are used when creating multi-factor portfolios with the Combination or Intersectional model.
Secondly, the results of the Sequential Model strongly depend on the sequence of the factors. For example, if the first factor for sorting is the Value factor, then all stocks will have a Value tilt, regardless of which factors are used for the sorting thereafter. The Combination and Intersectional models treat factors equally in terms of ranking, while this is not the case for the Sequential model.
COMBINATION VS INTERSECTIONAL MODEL
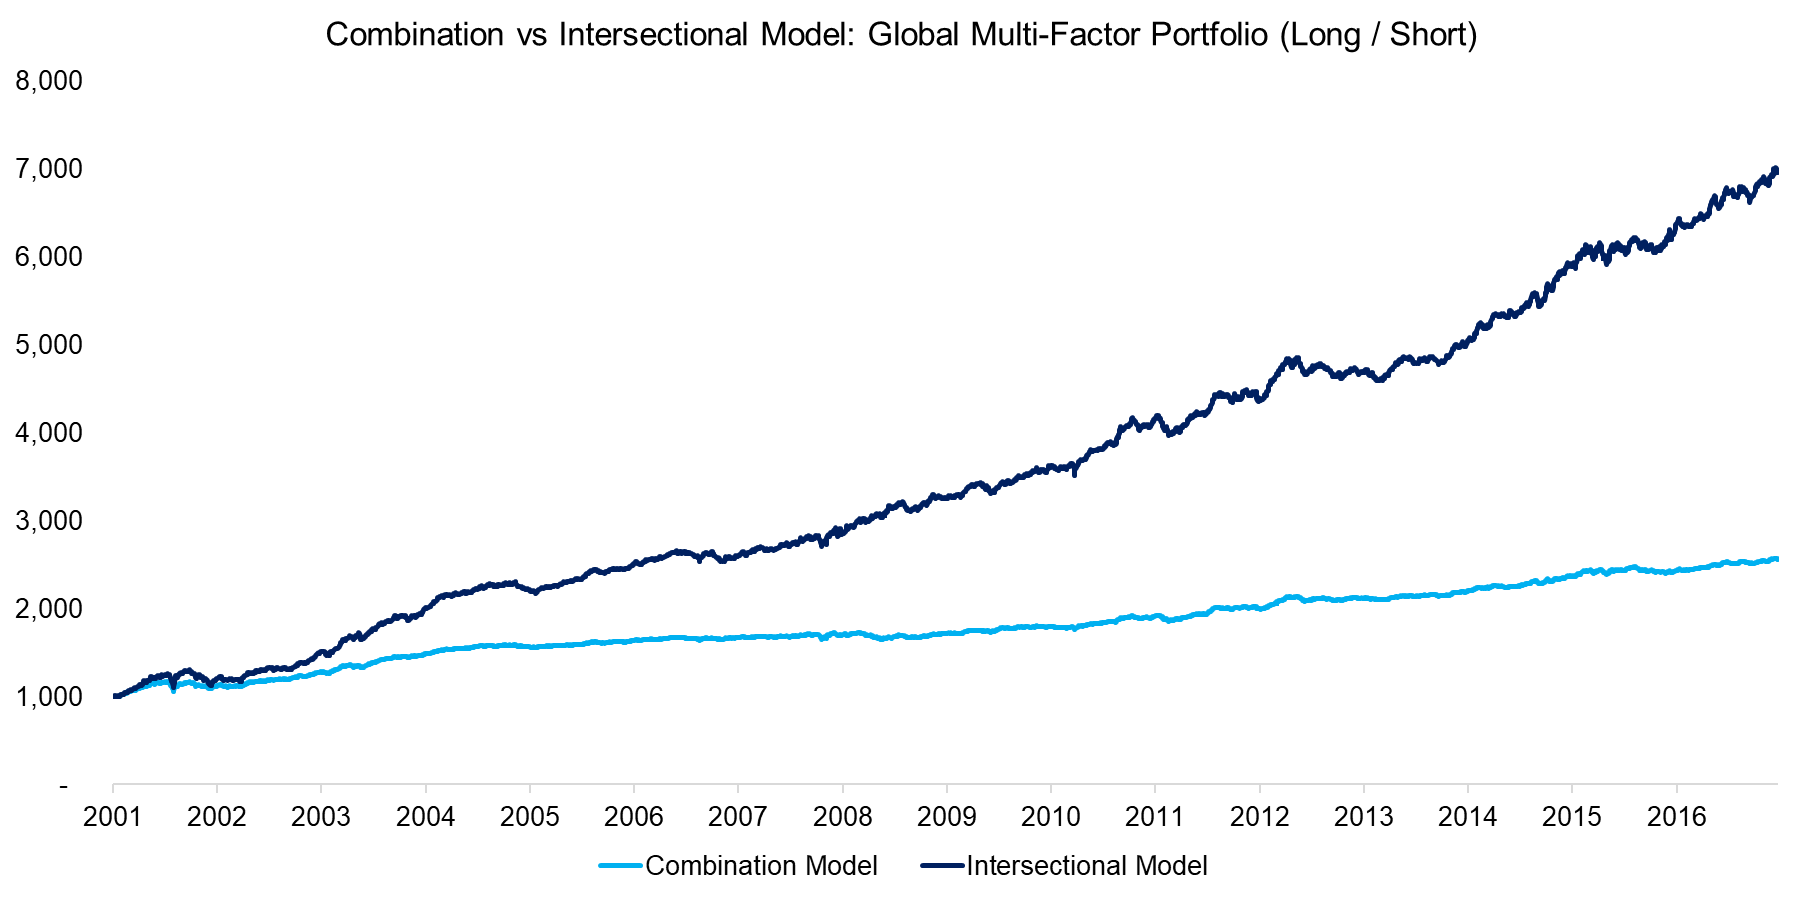
The chart below compares the performance of the Combination versus Intersectional models for a global multi-factor portfolio, which is created by equally allocating across the seven factors (Value, Size, Momentum, Low Volatility, Quality, Growth and Dividend Yield) and weighting the country allocations based on the number of stocks available in the seven markets (US, Europe, UK, Japan, Australia, Hong Kong and Singapore). We can observe similar trends, but a clear outperformance of the Intersectional model for the observation period from 2000 to 2017. The multi-factor portfolios from the Intersectional model can be viewed as extreme versions of the portfolios from the Combination model as these hold only a fraction of the number of stocks, i.e. the stocks in the intersection of factors.
Source: FactorResearch
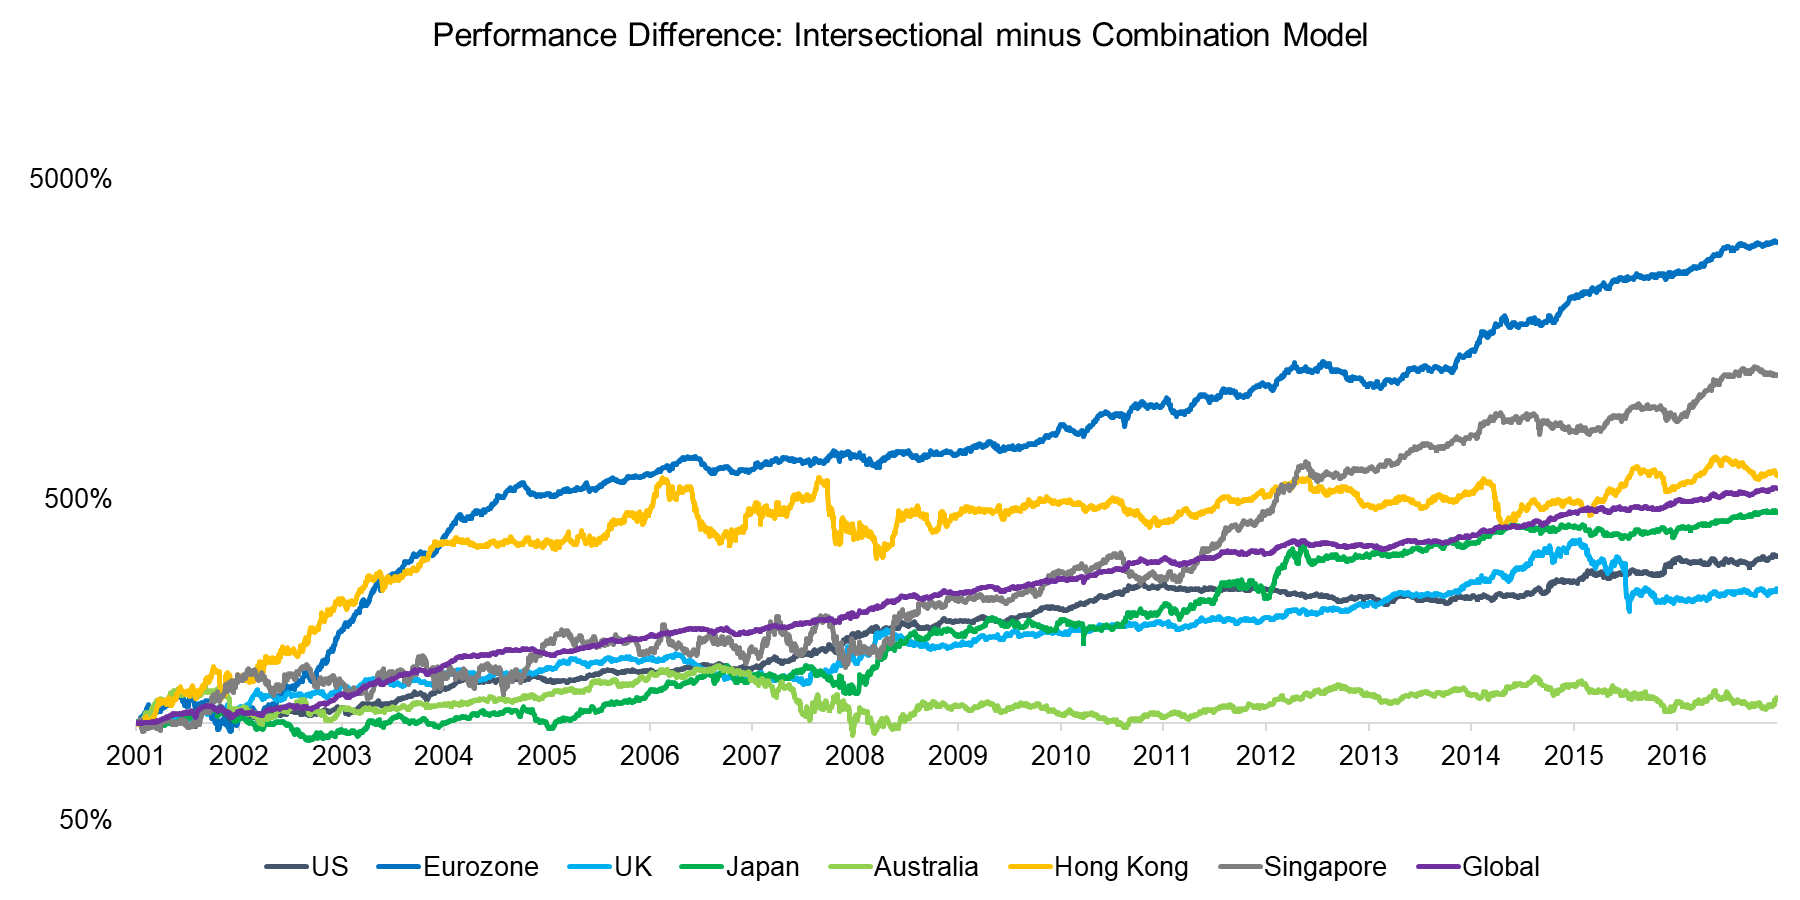
In order to analyse the outperformance of the Intersectional model further, we can study the differences on country level, which are shown on the chart below. We observe that there is a consistent outperformance across most markets, except for Australia. The performance difference seems especially strong in the Eurozone, although this is likely more random than explained by a particular reason.
Source: FactorResearch
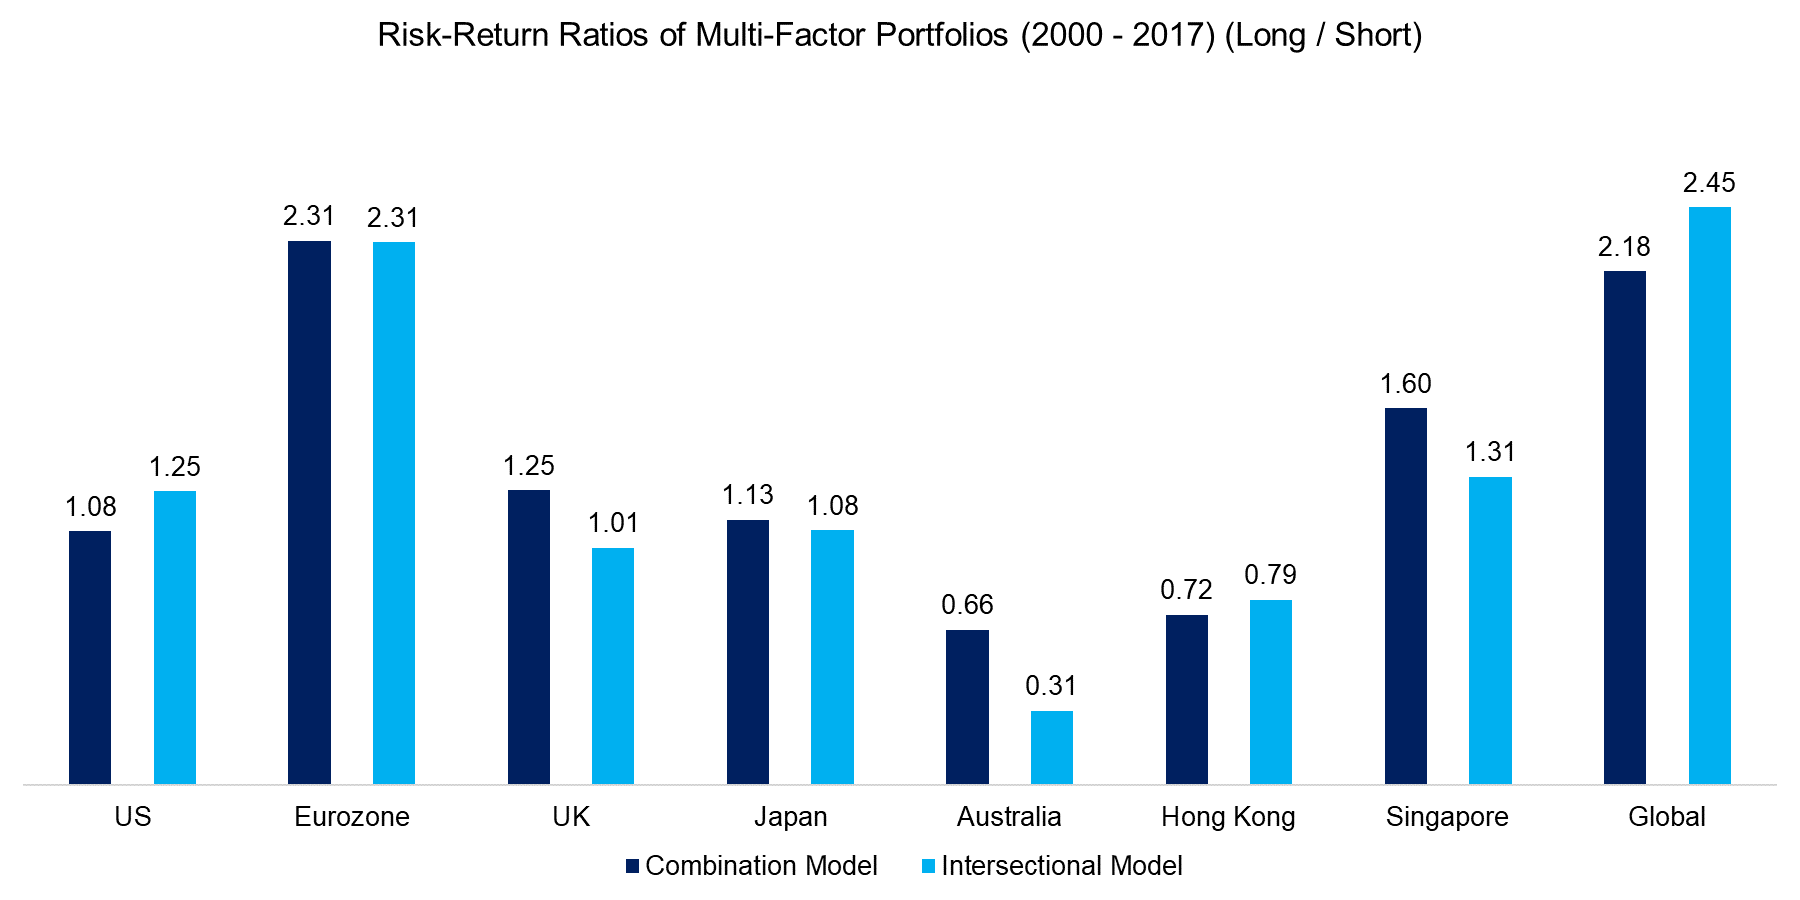
In addition to observing the performance of the two models, we can also analyse the risk-return ratios across markets, which are shown in the chart below. The Combination model shows higher risk-return ratios than the Intersectional model in most markets. The risk-return ratio of the global multi-factor portfolio is higher for the Intersectional model; however, that can be explained by the large weighting of the US in the portfolio, which is approximately 50%.
Source: FactorResearch
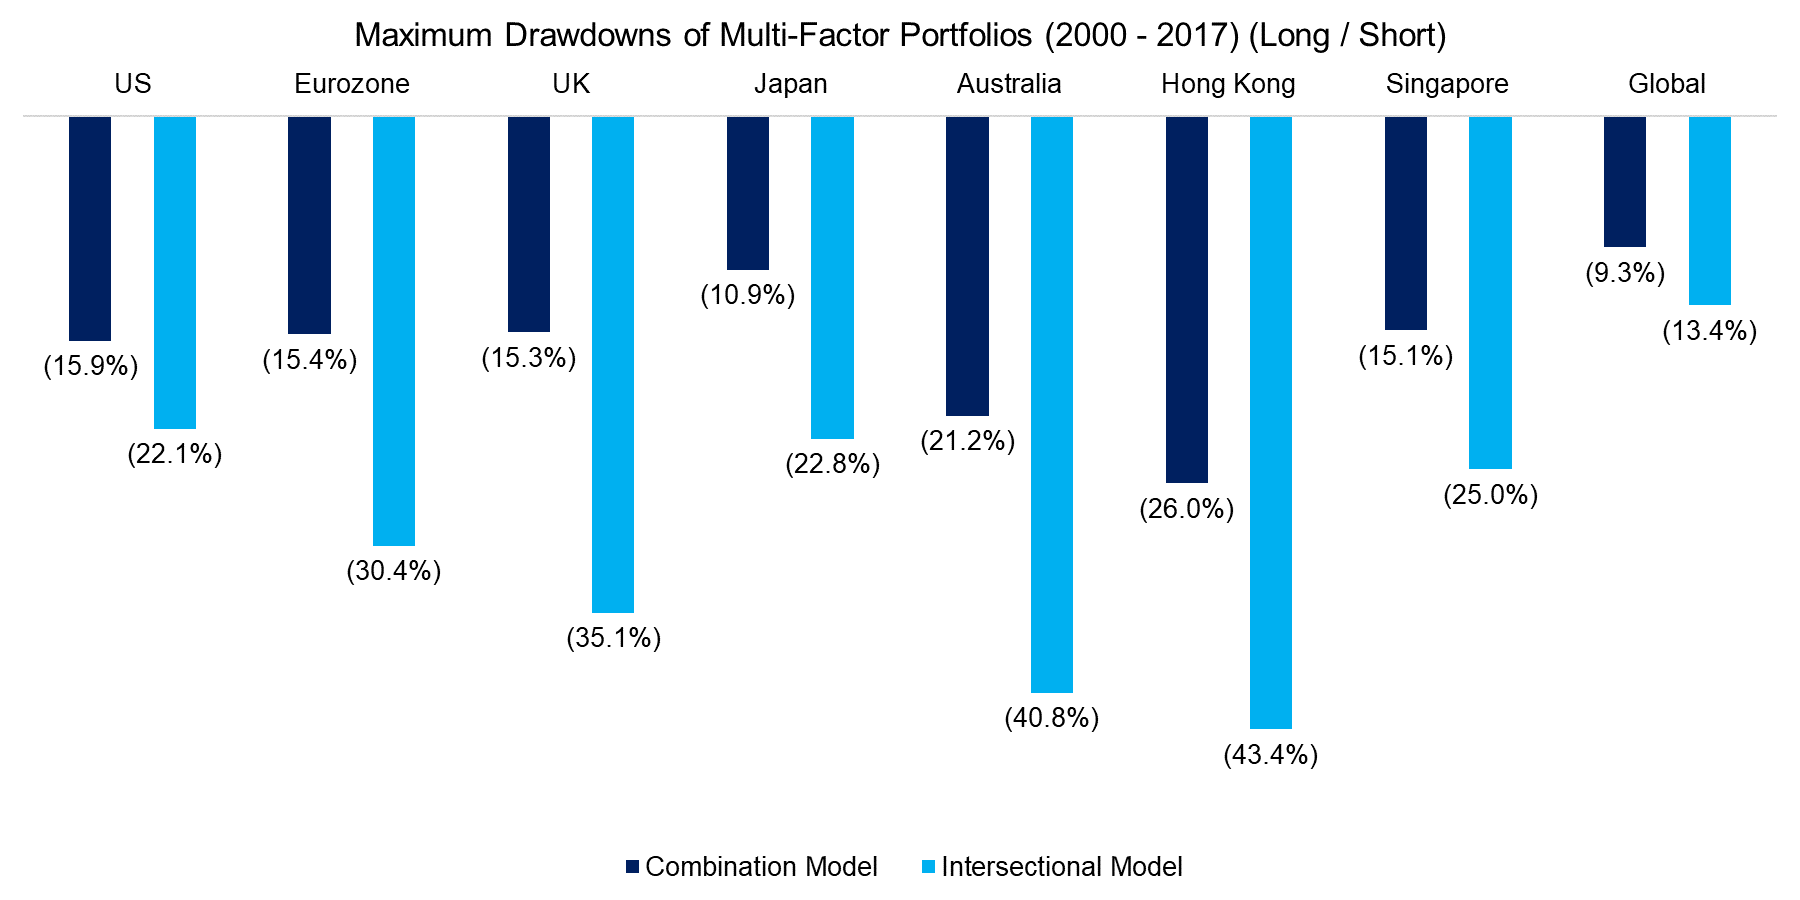
The higher risk-return ratios of the Combination model are reflected in lower maximum drawdowns compared to the Intersectional model as the chart below shows. The lower drawdowns can be explained by much larger portfolios, which offer significantly higher diversification benefits.
Source: FactorResearch
CONCLUSION
This white paper outlines three common approaches for creating multi-factor portfolios: the Combination, the Intersectional and the Sequential models. The comparison of the performance and risk metrics of the first two models highlights higher returns, but lower risk-return ratios and higher maximum drawdowns for the Intersectional model compared to the Combination model. The Sequential model was excluded from the model comparison as the results are not comparable to the other two models given that only few factors can be included and that the factor weights are not equally-weighted. Investors have the choice of utilising any of the models and can weigh the advantages and disadvantages. The model selection process is likely significantly influenced by the number of stocks of the multi-factor portfolios, which differ substantially and play a significant role in portfolio management from an operational perspective (read Factor Construction: Portfolio Scenarios).
FURTHER THOUGHTS
The analysis highlights that multi-factor portfolios, regardless if created via the Combination or Intersectional model, showed attractive returns and risk-return ratios for the period from 2000 to 2017. However, only few factors have shown structural positive excess returns across time and markets and even these are highly cyclical. Factor selection and allocation are challenging subjects and should be coupled with a sound risk management approach.
APPENDIX
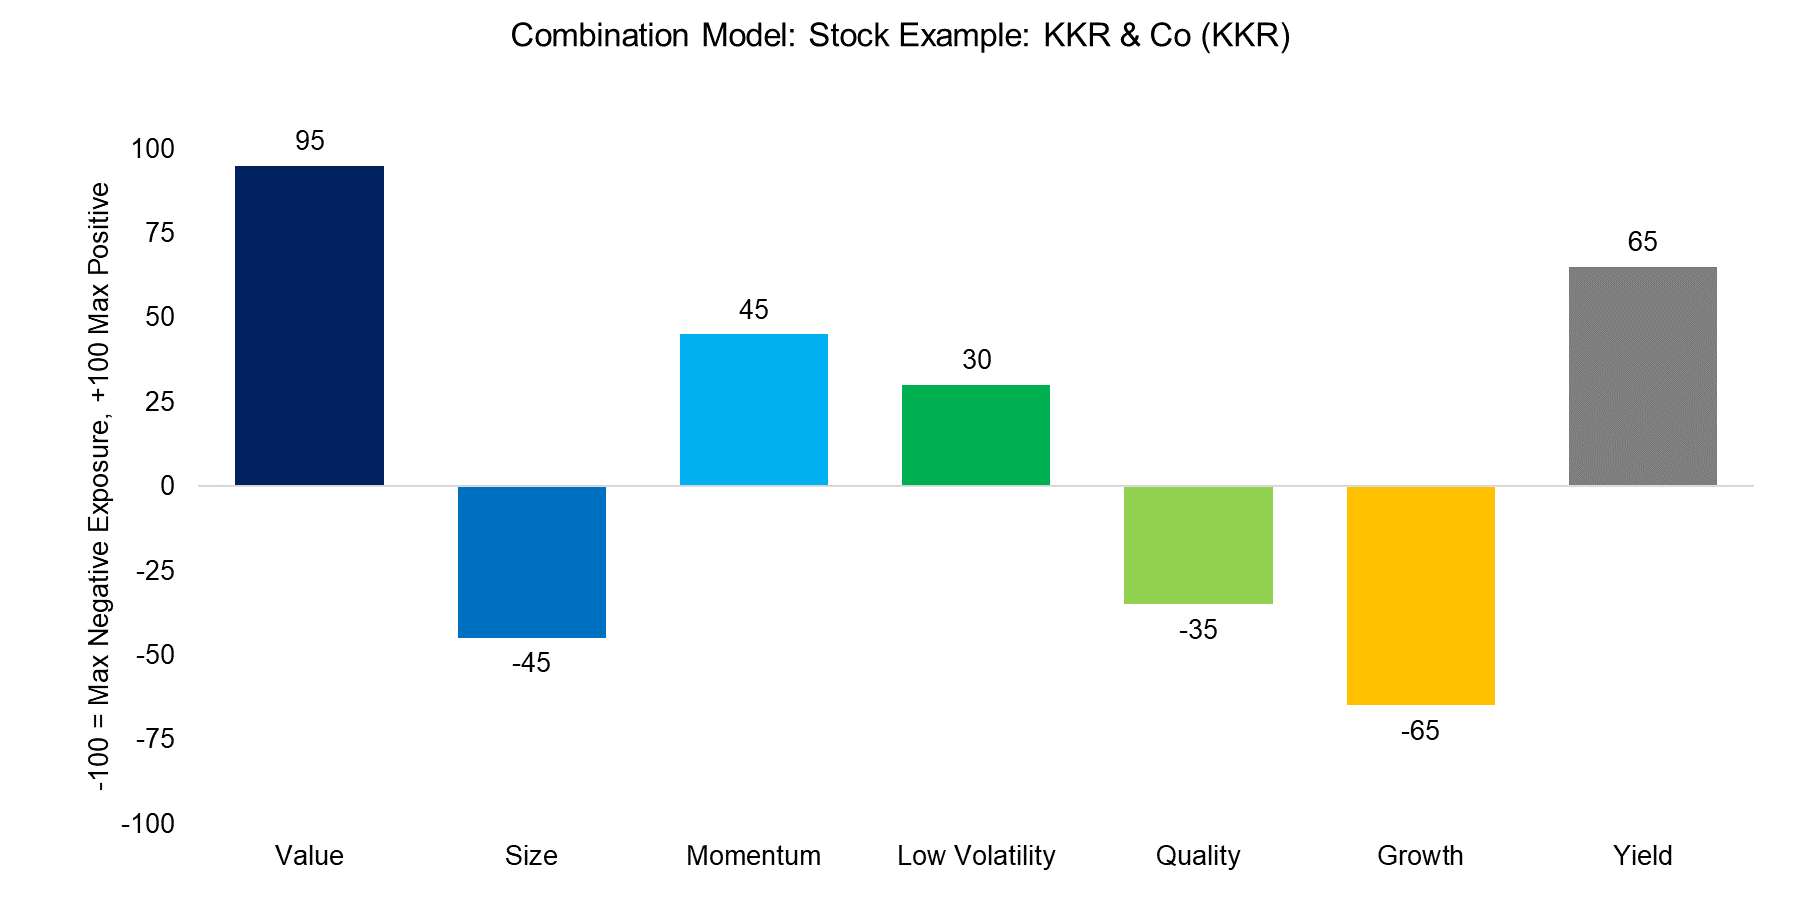
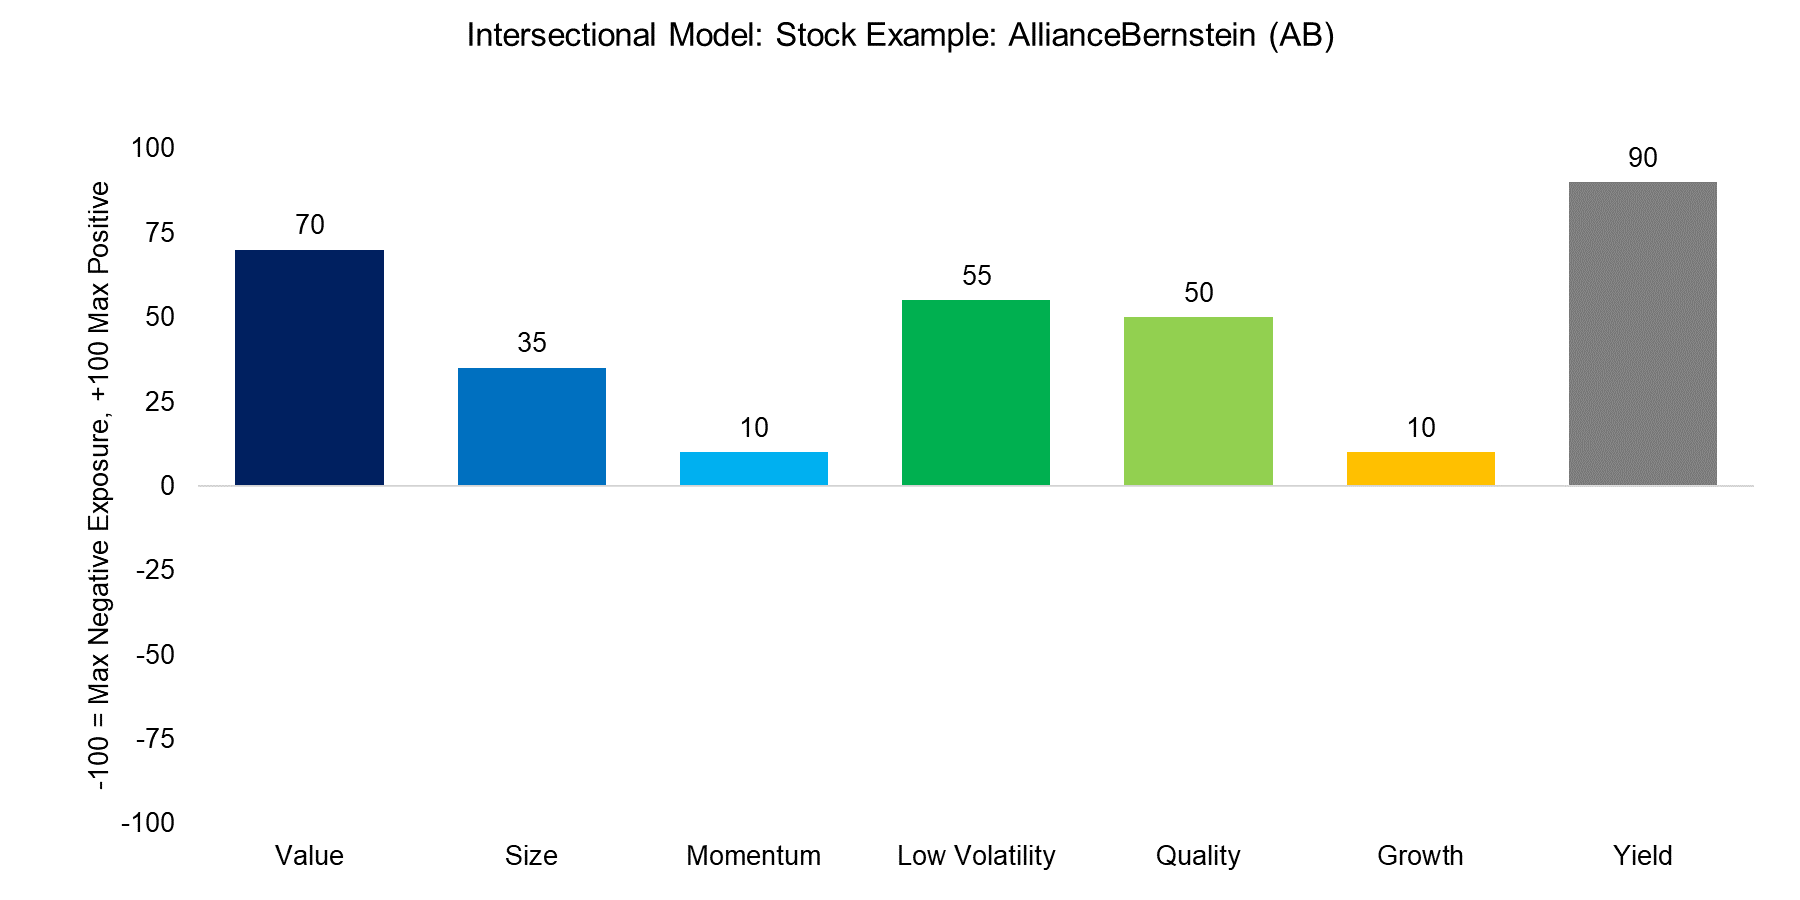
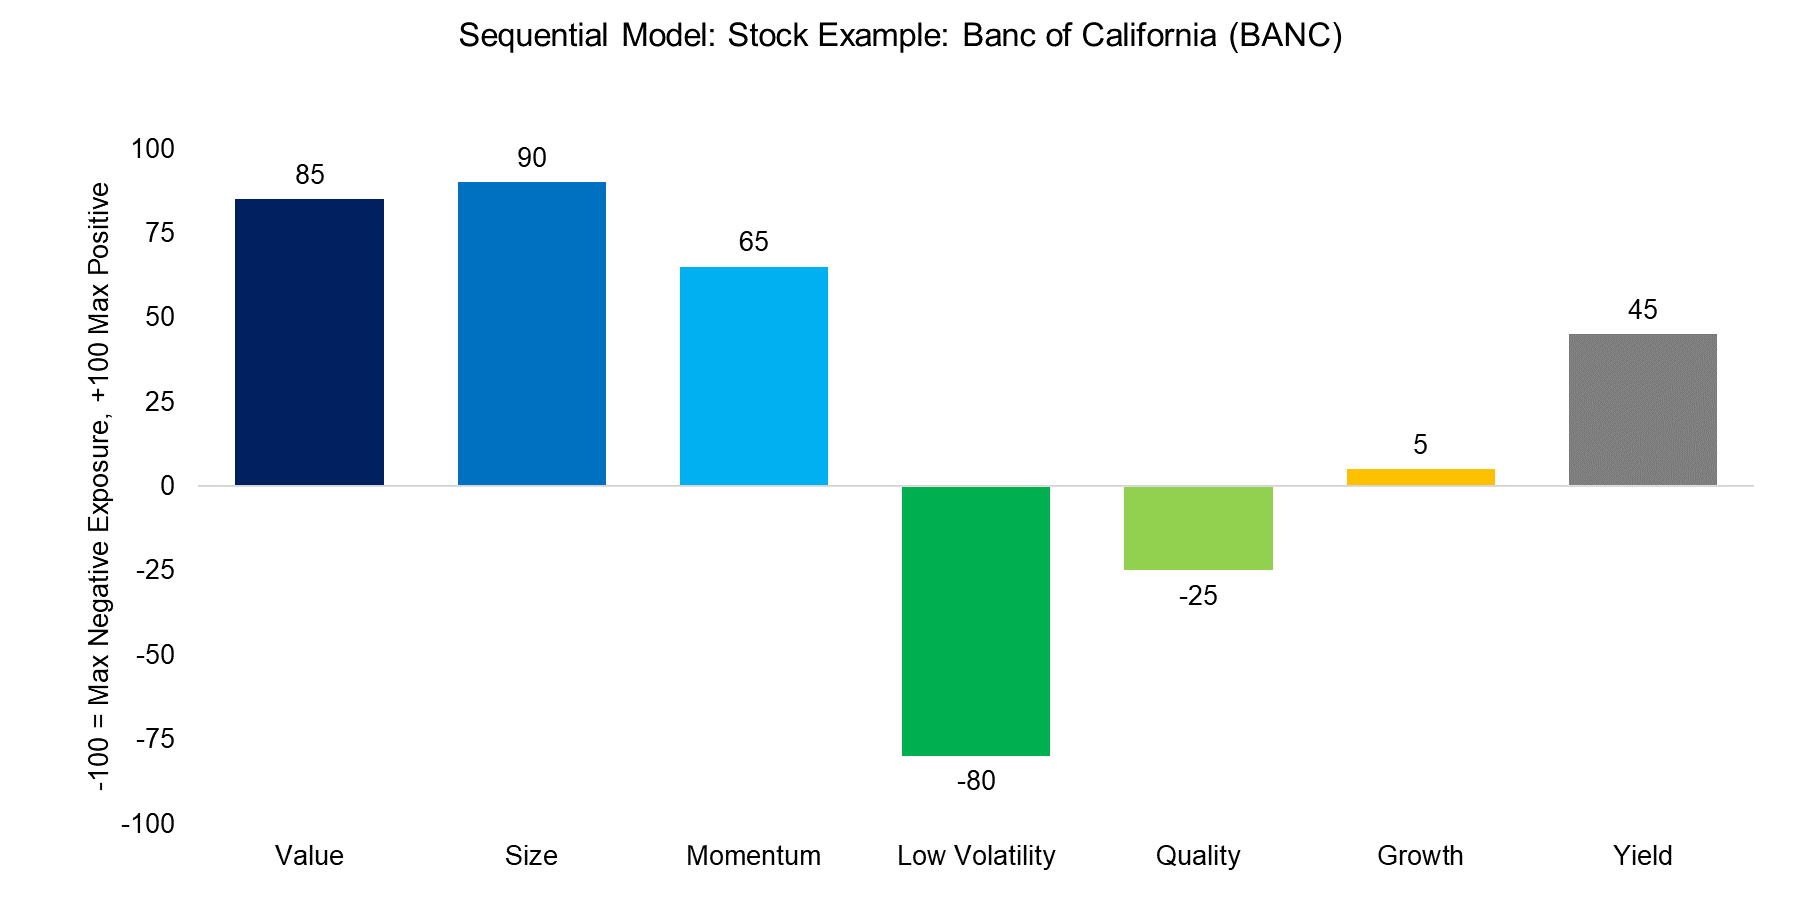
Below we exhibit three stock examples of each model, in all cases from the long portfolio. The charts highlight the factor exposure of each stock, which can be positive or negative. If the factor exposure is above 90, then the stock would be included in the long portfolio of a factor, while if the factor exposure was below -90, then the stock would be included in the short portfolio, assuming the factor takes the top and bottom 10% of the stock market for the portfolio construction.
COMBINATION MODEL
The Combination model ranks stocks by single factors and then combines these single-factor portfolios into a multi-factor portfolio. The stock below is an example from the Value sub-portfolio of the multi-factor portfolio as it ranks highly on the Value factor while the ranking of the other factors is not of importance.
Source: FactorResearch
INTERSECTIONAL MODEL
The Intersectional model sorts stocks by several factors simultaneously, which results in only one portfolio. The stock below is an example of the multi-factor portfolio as it ranks highly on average across all factors.
Source: FactorResearch
SEQUENTIAL MODEL
The Sequential model ranks stocks by multiple factors sequentially, which results in one portfolio. The stock below is an example of the multi-factor portfolio, which was created by ranking sequentially by the Value, Size, and Momentum factors. The stock therefore shows exposure to those three factors while being indifferent to other factors.
Source: FactorResearch
MODEL CHARACTERISTICS
The table below highlights the key differences between the three multi-factor models.

ABOUT THE AUTHOR
Nicolas Rabener is the CEO & Founder of Finominal, which empowers professional investors with data, technology, and research insights to improve their investment outcomes. Previously he created Jackdaw Capital, an award-winning quantitative hedge fund. Before that Nicolas worked at GIC and Citigroup in London and New York. Nicolas holds a Master of Finance from HHL Leipzig Graduate School of Management, is a CAIA charter holder, and enjoys endurance sports (Ironman & 100km Ultramarathon).
Connect with me on LinkedIn or X.

