Musings on Low Volatility
Has minimum volatility minimized volatility in 2020?
June 2020. Reading Time: 10 Minutes. Author: Rodolfo Martell.
SUMMARY
- The Low Volatility strategy failed to protect investors in March and April 2020
- Industrials & materials generated positive and technology & real estate negative relative performance
- Low Vol strategies do not deliver ESG benefits
INTRODUCTION
Low volatility (Low Vol) strategies have gained popularity over the past decade with retail and institutional investors alike. Although initially, their adoption was slow (does Low Vol have a rational risk-based explanation? A behavioral one? Does it arise from structural inefficiencies?), as their successful track record built up, assets started piling in. Even when in recent years evidence showed Low Vol strategies getting progressively more expensive, investors continued to allocate money to them given their positive performance (read Low Vol Factor: From Obscurity to Stardom).
One big misconception remains regarding Low Vol strategies: it is still often thought of as a passive strategy, partly because a Low Vol strategy typically tracks a low volatility or minimum volatility index. Let us be clear about one point here: Low Vol is an active strategy, and its positions should be measured against a regular cap-weighted benchmark.
So, to evaluate Low Vol strategies we have to look at the improvements in risk measures like volatility, drawdown profile, beta reduction versus a market capitalization-weighted benchmark, and Sharpe ratio improvements, among others, which we will evaluate in this short research note.
LOW VOLATILITY PERFORMANCE IN 2020
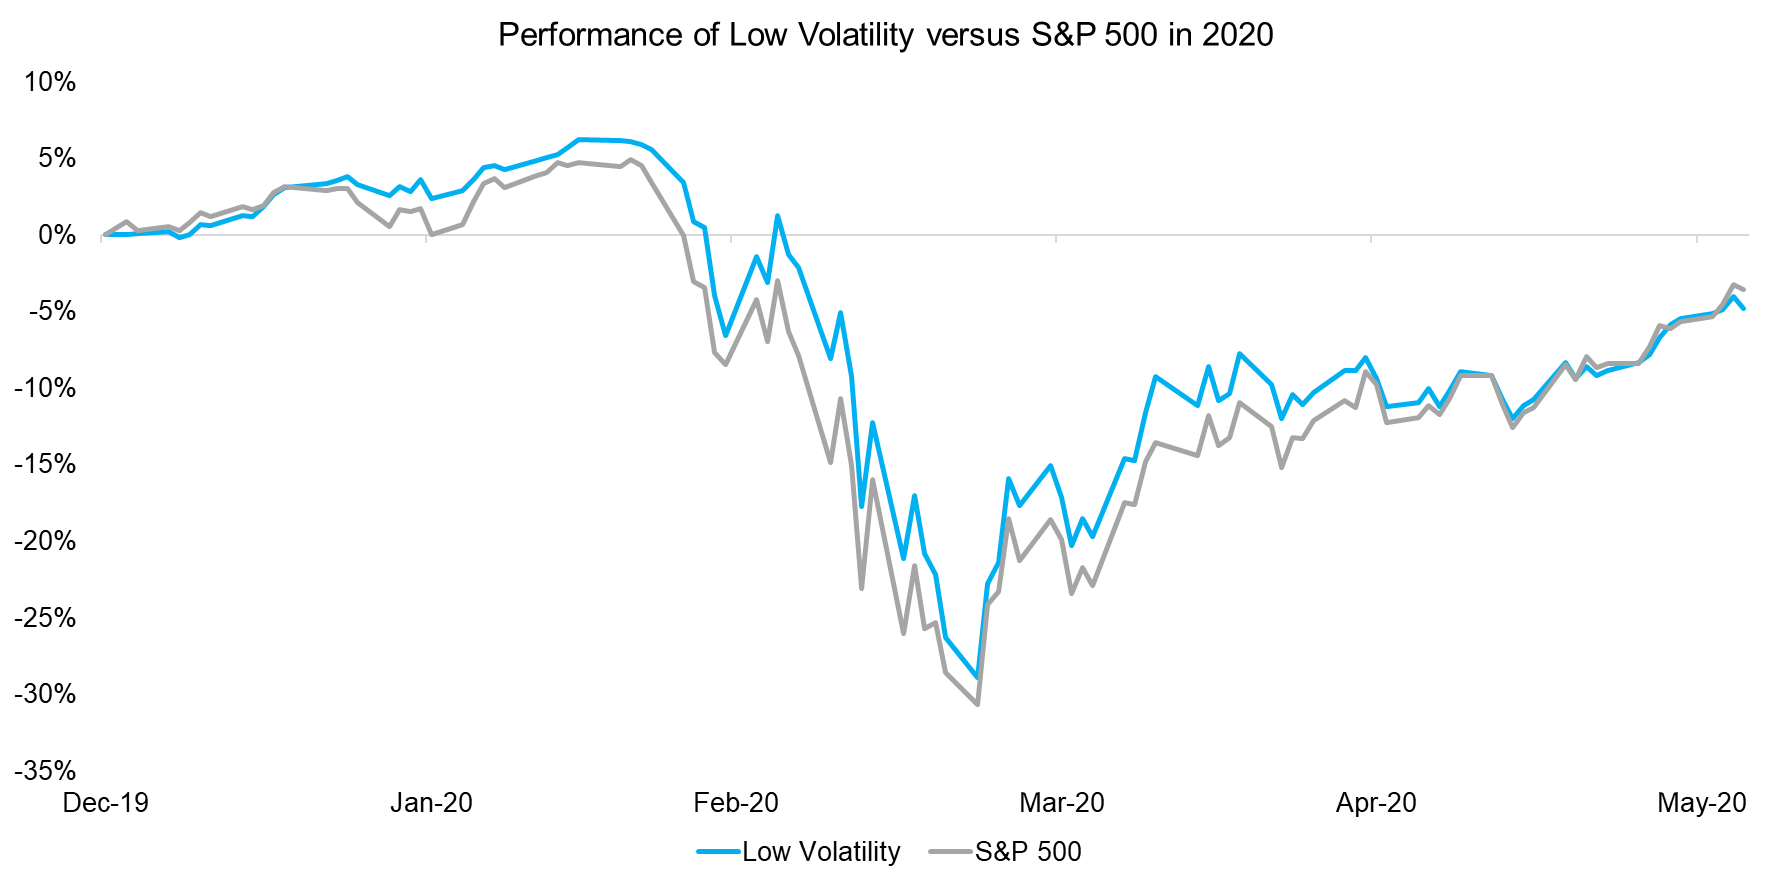
Low Vol strategies, as measured by the largest ETF namely USMV in this smart beta category, started the year continuing the positive trend from previous years, outperforming a regular capitalization-weighted benchmark such as the S&P 500. By mid-February, Low Vol reached its 2020 peak at 6.2%, compared to 4.9% for the regular cap-weighted benchmark.
Then, while the COVID drawdown unfolded, Low Vol continued to minimally outperform, beating the benchmark by only 2.7% by the end of March. Since then, as the chart below shows, both strategies have posted a swift recovery, with a neck-to-neck photo finish as of early June. The chart below does not scream “defensive”, rather it seems that Low Vol tracked very closely its cap-weighted cousin.
Source: FactorResearch
WHAT HAS BEEN DRIVING LOW VOLATILITY PERFORMANCE?
What happened to Low Vol in 2020? What worked and what did not work?
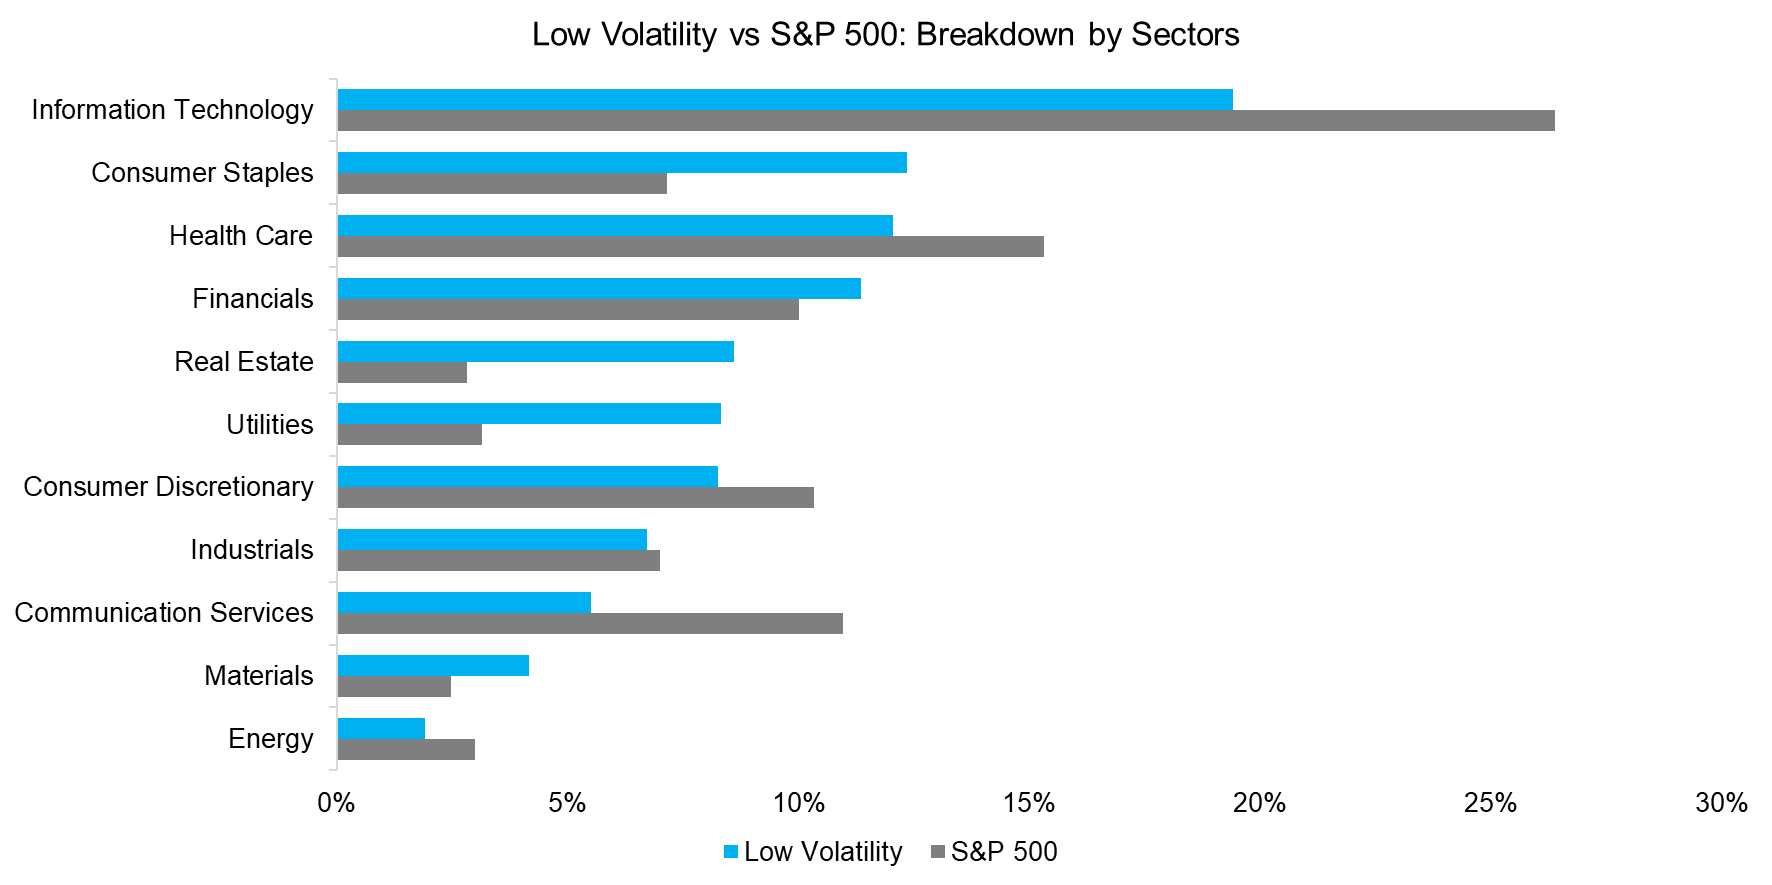
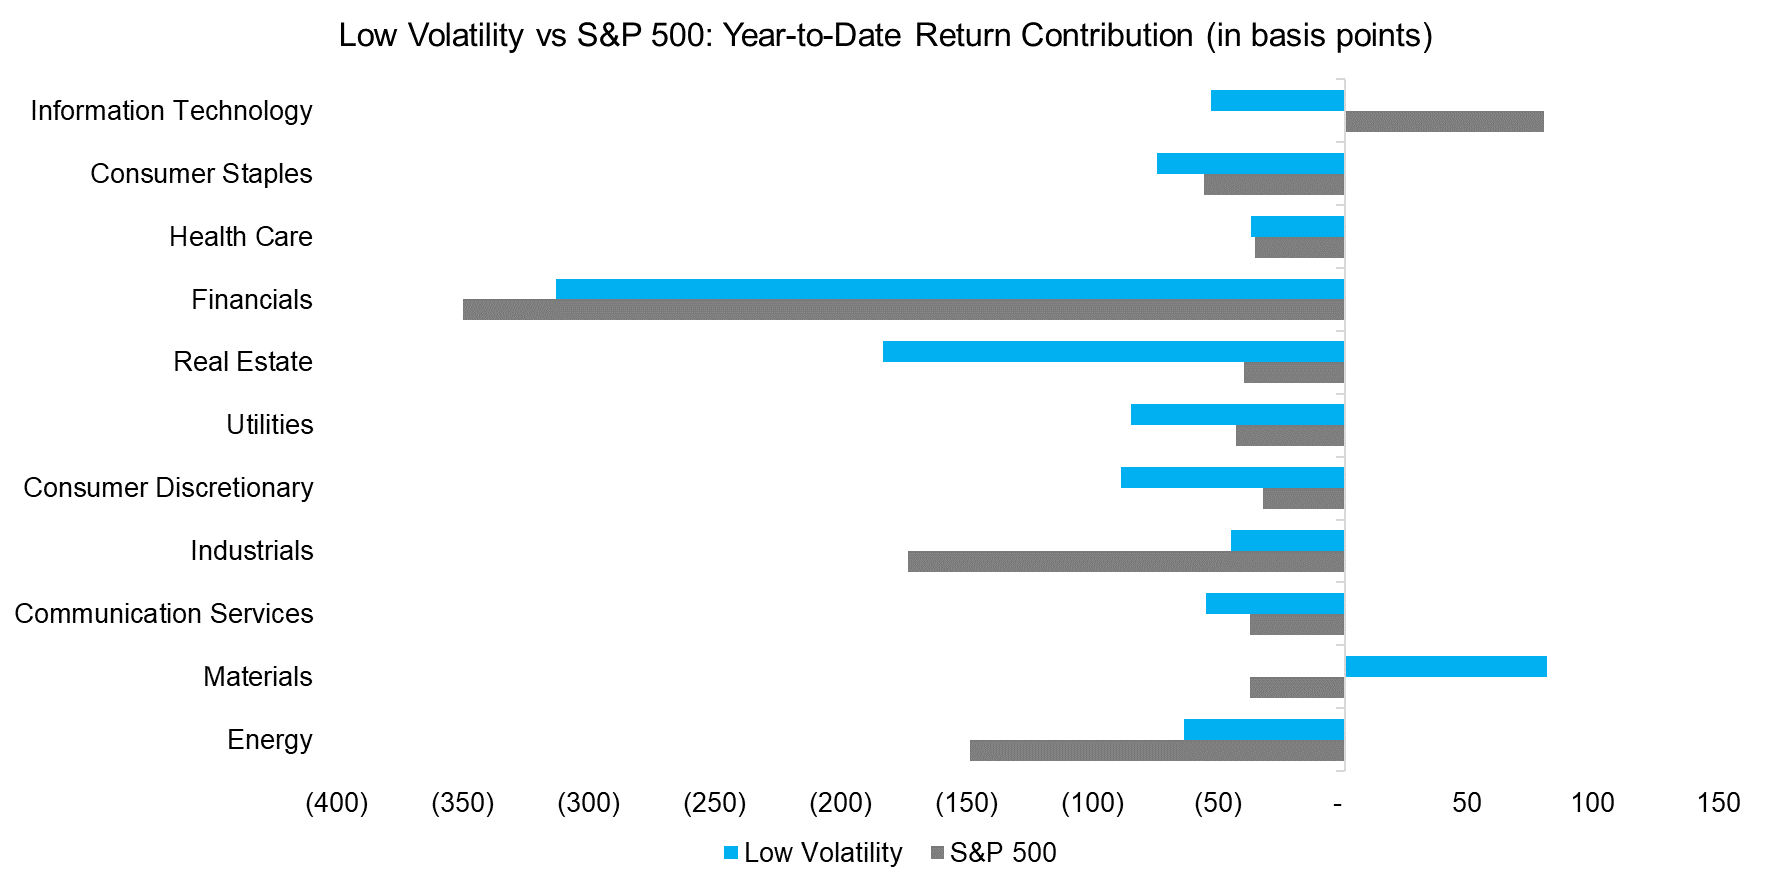
One answer is to look at positioning, particularly looking at the different sector exposures both strategies hold (data as of the end of May). Before we look at sector positioning and its contribution, it is important to remember that in the years prior to 2020, Low Vol strategies tended to be overweight utilities, real estate and consumer staples, while being underweight information technology, energy, health care and communication services. The two charts below show the positioning and year-to-date contribution to return from such positioning (read Low Volatility Factor: Interest Rate Sensitivity & Sector-Neutrality).
Source: FactorResearch
Interestingly, the two largest contributions to returns in year-to-date 2020 for Low Vol came from industrials and materials, where clearly methodological differences in portfolio construction favored companies with low realized beta in the case of Low Vol, which helped returns.
More interestingly, though, is what did not help performance for Low Vol. Overweight positions in utilities and real estate, as well as an underweight position in information technology, did actually detract substantially from returns, which is a stark reversal from recent years, where those positions usually helped with performance.
Source: FactorResearch
HOW RISKY IS LOW VOL?
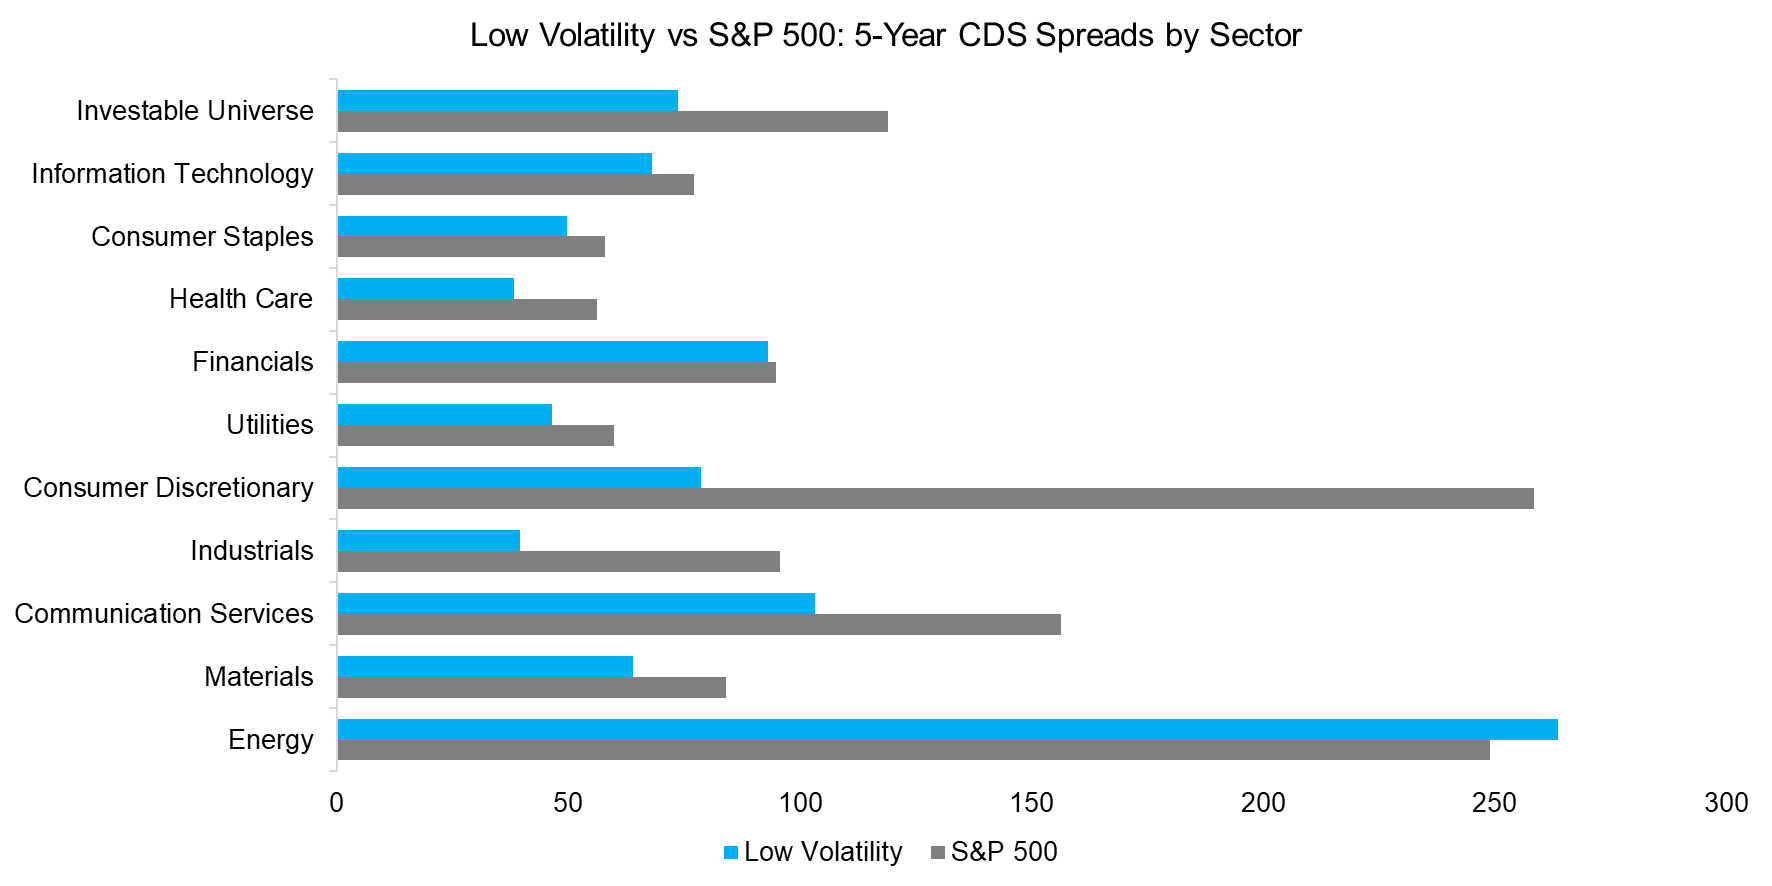
Another way to look at the defensive properties of Low Vol strategies is to look at the average default risk of their holdings. In order to measure default risk, we look at the average 5-year CDS by sector. Notably, holdings of Low Vol were riskier in energy stocks, and lower everywhere else. The largest differences, i.e., the sector where the average stock held by Low Vol was safer, were in consumer discretionary, industrials, materials and communication services. This is an interesting result given that consumer discretionary is a sector where Low Vol lost more money than the cap-weighted benchmark, even though its stocks were considered safer from a default perspective.
Source: FactorResearch, data as of April-end 2020
HOW GREEN IS LOW VOL?
Finally, given the rising popularity of ESG, we look at the ESG characteristics of both strategies. The motivation for looking at ESG metrics is the loose relation between low statistical risk (low beta) and low ESG risk (potentially low fundamental risk, or higher quality firms). We compare average standarized values for a disclosure score, percentage of non-executive directors, CEO tenure, and average board tenure. It turns out all measures are the same for both Low Vol and the cap-weighted benchmark index.
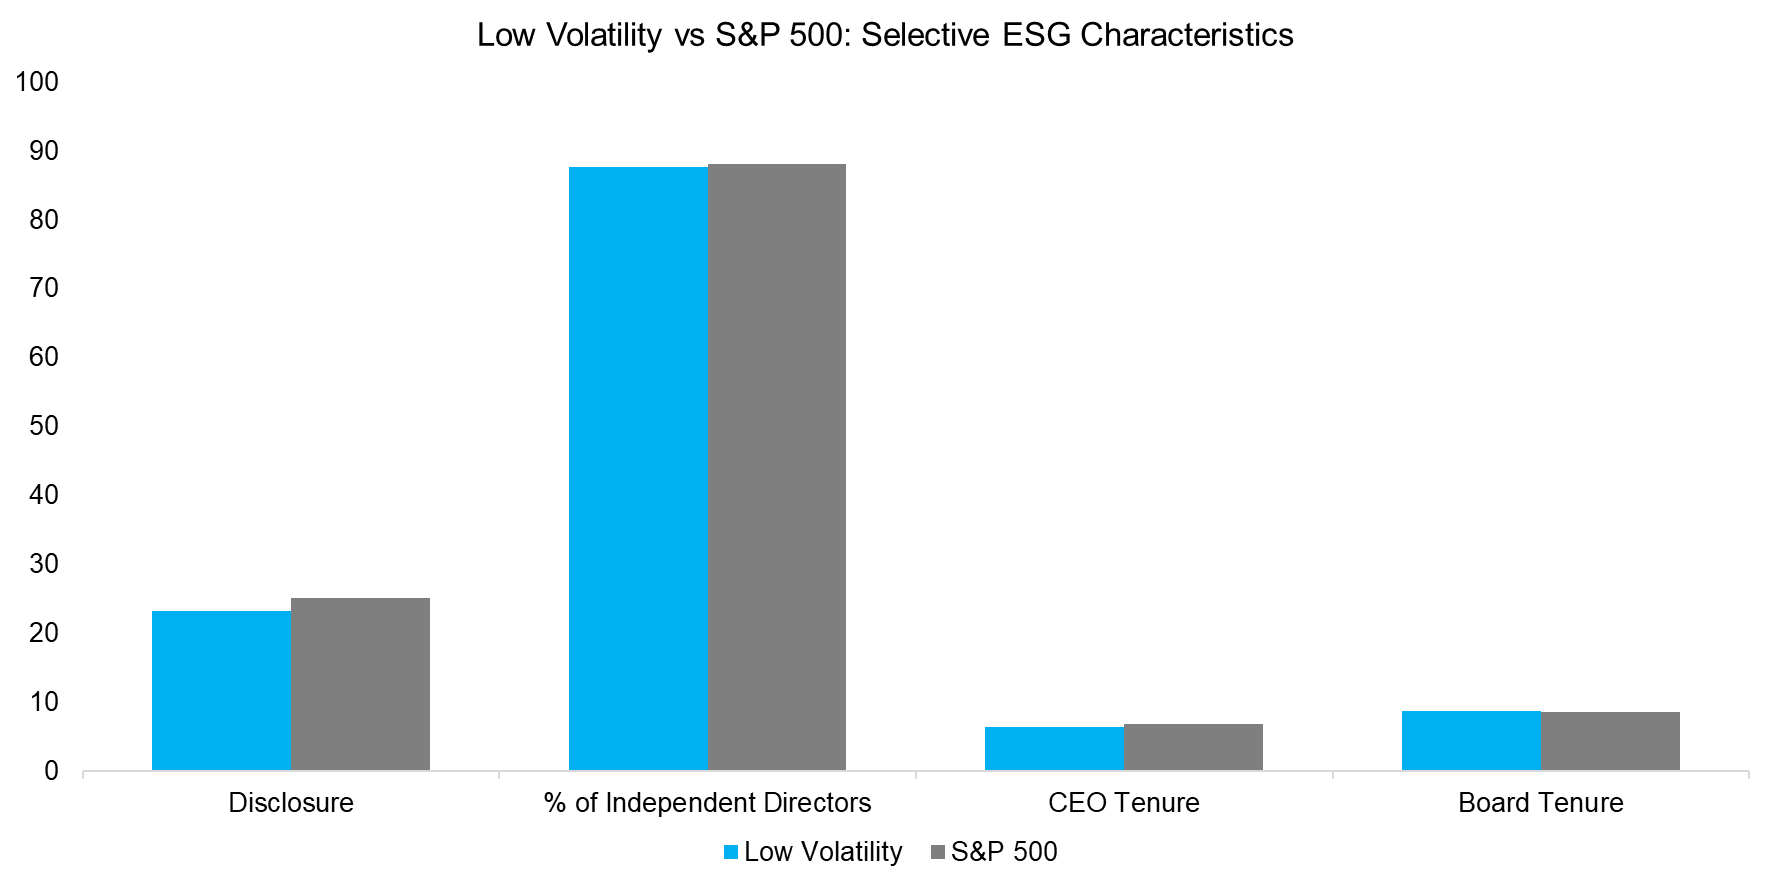
Source: FactorResearch, as of April-end 2020
This puzzling result made us look at sector level data, where we find some dispersion in the numbers. No strategy has a clear advantage in the percentage of independent, non-executive directors. It is interesting, though, that Low Vol has better ESG scores in this subcategory in sectors it usually overweights like utilities or consumer staples.
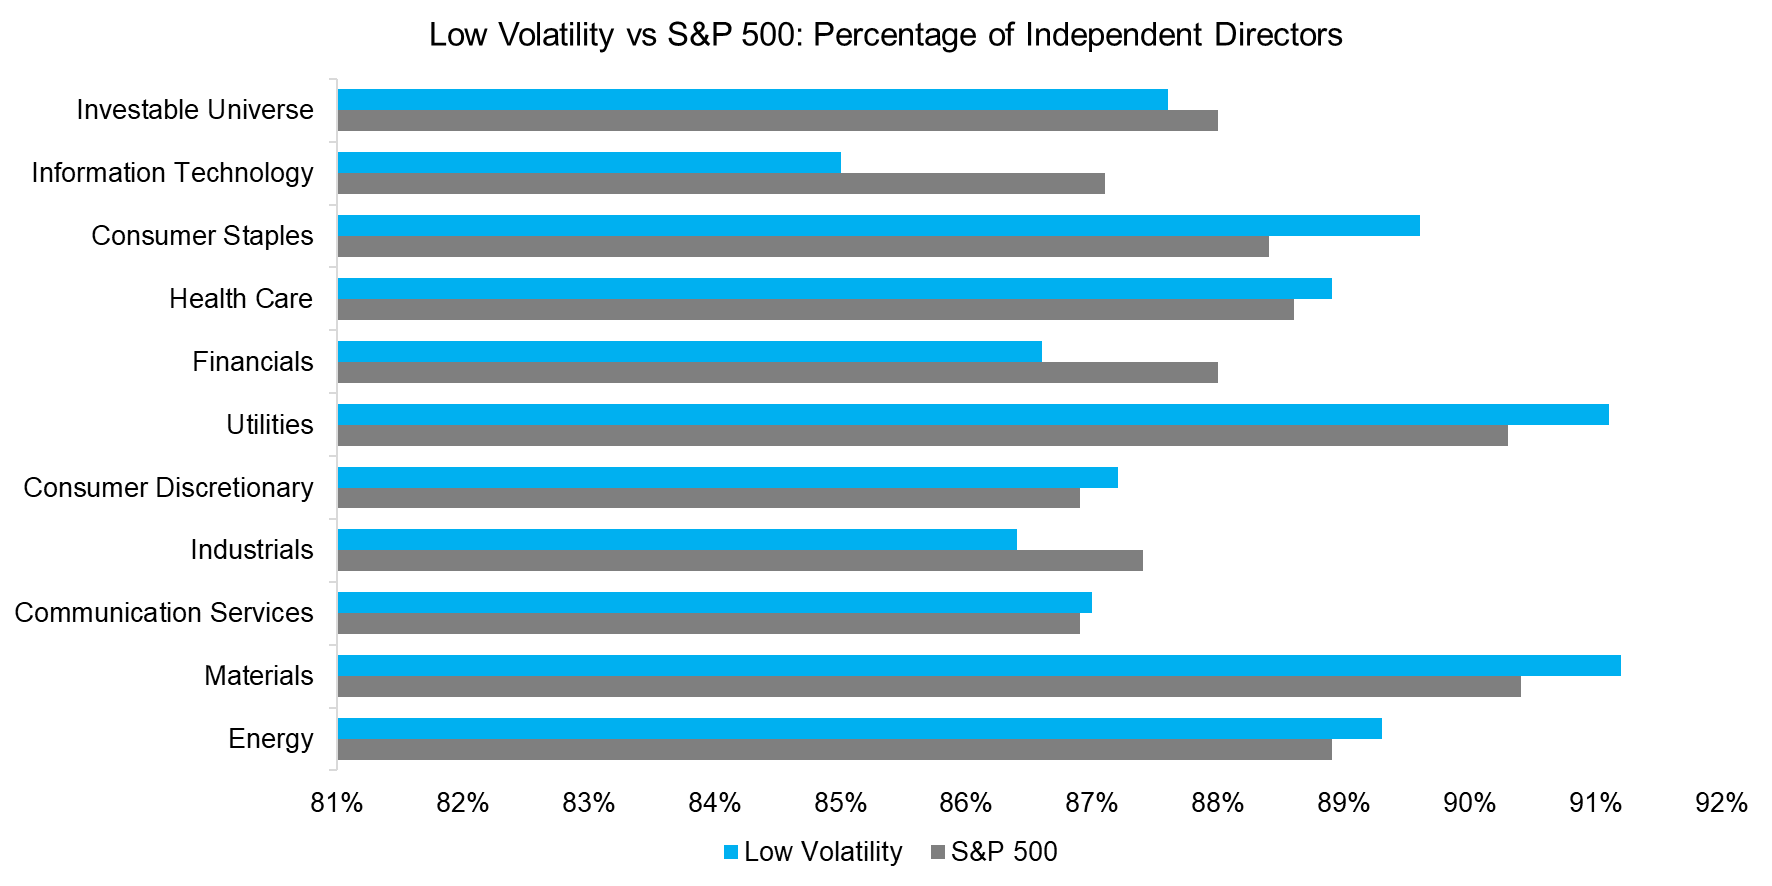
Source: FactorResearch
FURTHER THOUGHTS
Musing further about Low Vol and avenues for future research:
- One explanation for the existence of Low Vol strategies is leverage aversion. Will that aversion change in an environment of lower interest rates going forward?
- Warren Buffett’s recent decision to reduce holdings in airlines and financial companies got substantial press coverage. It raises interesting questions given that those holdings exhibited lower beta than their industry peers. Is Buffett questioning the value of Low Vol in 2020?
- The link between Low Vol strategies and ESG requires additional analysis. Lower (or higher) beta is the result of multiple firm characteristics, so trying to analyze ESG in Low Vol strategies is like reviewing a car while driving at 45 mph, in the rain, on a gravel road, and with the radio at full volume. Following the car metaphor, it is a better idea to analyze the car in each of those conditions separately.
RELATED RESEARCH
Low Vol Factor: From Obscurity to Stardom
ABOUT THE AUTHOR
Rodolfo Martell is an investment professional who previously worked at AQR as a Managing Director in the Global Stock Selection Group. Before that, he was employed by QMA, a PGIM company, as a global strategist and co-chair of the ESG Committee. He started his investment career at BlackRock, where he ultimately worked as a senior portfolio manager in the Scientific Active Equities Group. He has been a lecturer at UC Berkley and an Assistant Professor at Purdue University. He holds PhD in finance from Ohio State University.

